
Let's have a go at making some changes to our dashboard to show that it is straightforward; and all you need to do is just think about the setup of the code a little differently from what you did when it was set up in Simple XML. In this part of the chapter, we are going to change our chart to provide two separate line graphs for each for the companies that we are providing closing values for. This will mean that we will need to make changes to the HTML section, add another search manager for another search query, and then code a second visualization for the second line graph:
- Log on to your development server, and as we have converted our Simple XML dashboard to HTML, the file for this dashboard will now be in the local directory of our Splunk App. So move to that directory:
cd $SPLUNK_HOME/etc/apps/stock_market/local/data/ui/html/ - There should only be one file in the directory, so either use the Splunk Code Editor or use a text editor to open the
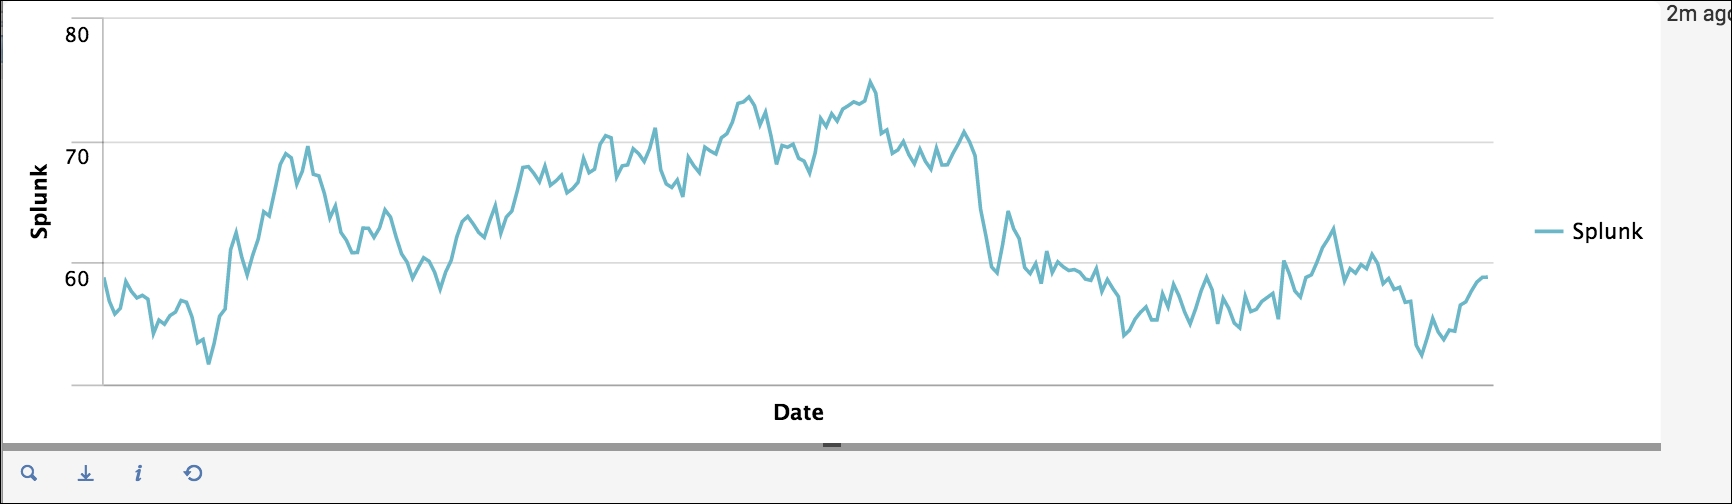
stock_market_historical_overview_html.htmlfile. - Move down to line 39 and change the heading element to now display a new heading relevant to the Splunk stock values. We can see this as follows:
39 <h3>Historical Overview of Splunk Closing Value</h3>
- We move just past line 46 in our code where we have closed off the
divcontainer forelement1. We are going to add the following lines to the code so that it will display a second graph:47 <div id="row2" class="dashboard-row dashboard-row2"> 48 <div id="panel1" class="dashboard-cell" style="width:100%;"> 49 <div class="dashboard-panel clearfix"> - We open up our
divwithrow2as the ID for our second row, and we also name our second classdashboard-row2. We then set up the panel for the chart. - The following code can then be added where we set up the class for our new
panel-element; name itelement2and provide it with its own heading to reflect the data it is going to display:51 <div class="panel-element-row"> 52 <div id="element2" class="dashboard- element chart" style="width: 100%"> 53 <div class="panel-head"> 54 <h3>Historical Overview of Yahoo Closing Value</h3> 55 </div> 56 <div class="panel-body"></div> - Now close off all of the
divcontainers for this part of the HTML code:57 </div> 58 </div> 59 </div> 60 </div> 61 </div> - We can now move down to the section of the code where our search managers are set up. We will first need to change the search query that is being run by the current search to only find and display the Splunk stock market data:
214 "search": "source="*splkstock.csv" | chart values(Close) AS Splunk by Date", - We now basically want to make a new search manager that will mirror the current one but specify Yahoo! as the subject of our search. We will add the following code lines after
search1. With the additions that we have made so far, this should be at about line 223:223 var search2 = new SearchManager({ 224 "id": "search2", 225 "status_buckets": 0, 226 "earliest_time": "-1y@y", 227 "search": "source="*yhoostock.csv" | chart values(Close) AS Yahoo by Date", 228 "latest_time": "$latest$", 229 "cancelOnUnload": true, 230 "app": utils.getCurrentApp(), 231 "auto_cancel": 90, 232 "preview": true, 233 "runWhenTimeIsUndefined": false 234 }, {tokens: true, tokenNamespace: "submitted"}); - It is a simple addition where we call our new manager,
search2, and our search will point to the Yahoo! stock market data. Each of the other options, including earliest and latest times, will be the same assearch1. - We move down towards the bottom of the code where our visualization elements are set up. Currently, we have
element1already in place. If you remember, we have now entered a second element to be referenced within the HTML part of our code. As it will be very similar toelement1, move just below this code and add the following code lines from line 281:281 var element2 = new ChartElement({ 282 "id": "element2", 283 "charting.chart": "bar", 284 "resizable": true, 285 "managerid": "search2", 286 "el": $('#element2') 287 }, {tokens: true, tokenNamespace: " submitted"}).render(); - As you can see, we have set up the new visualization as
element2, which simply references the new search manager we have now set up, calledsearch2. - We save our changes, and we will also add this to our menu and navigation, as HTML dashboards are displayed a little bit differently. We move into our navigation directory for our Splunk App:
cd $SPLUNK_HOME/etc/apps/stock_market/default/data/ui/nav/ - Open the
default.xmlfile, and we will add an entry that will place the new dashboard on our interface and load it up when it is clicked. The following is the entire code for thedefault.xml, so you can see the difference between displaying Simple XML and HTML dashboards in our menu:1 <nav search_view="search" color="#65A637"> 2 <view name="overview" default='true' /> 3 <a href="stock_market_historical_overview_html">Stock Market Historical Overview HTML</a> 4 <view name="search" /> 5 </nav> - When we specify a Simple XML dashboard, we use the
viewelement, but as you can see, we now use the anchor element with anhrefattribute to add our new HTML dashboard. We also need to specify the name that is going to be displayed in between thetagelements. If we do not specify the name to be displayed, it will display the filename and not the title as it did with our Simple XML dashboards. - Save your changes and reload the cache to your Splunk environment. If your changes have worked, you should be seeing something similar to the following screenshot:

We now have our separate line charts displayed on the one dashboard and we have also been able to add a new item to the menu at the top of the screen.
So there seems to be a lot of code in the HTML section of our dashboard, but a lot of this code has been set up to improve the visual appeal of the information we are presenting to our users. The main reason why all of these visual elements are in place in our HTML is basically so that we can change and manipulate every tiny detail of the way our dashboard is displayed to our users. We are going to take this opportunity to quickly create a new dashboard that will remove all of the unnecessary code and only include the basic HTML code that we need to have our chart displayed on the page. Our new dashboard will be a copy of our original HTML dashboard so that we can compare the two:
- If you are not already on your development server, log back in and move into the directory where your HTML dashboard is:
cd $SPLUNK_HOME/etc/apps/stock_market/local/data/ui/html/ - Make a copy of the current dashboard; and we will create it with the word "raw" preceding the name:
      cp stock_market_historical_overview_html.html
      raw_stock_market_historical_overview_html.html
- Open the new dashboard that you have now created with your text editor and remove the lines of code from line 18 to line 63 within the HTML section of the code.
- We have now removed close to 50 lines of code, and all we are going to replace it with is the following line:
18 <p id="element1" />
- Now we can also add this new HTML dashboard to our navigation, so move into the
navdirectory for our Splunk App:cd $SPLUNK_HOME/etc/apps/stock_market/default/data/ui/nav/ - Open the
default.xmlfile with your text editor and add the following line after the previous HTML dashboard that we added:4 <a href="raw_stock_market_historical_overview_html">Only A Graph Will be Displayed</a> - Save your changes and reload the cache for the Splunk environment. When you reload the stock market Splunk App, you will see that we have a new menu item named Only A Graph Will be Displayed. Select the menu item and you will now be presented with a very sparse dashboard page. It gives a good idea of how all the other items including the Splunk menus and headers are displayed.
It may be rare that you actually want to display a dashboard in the way that we have done in the previous example. In my opinion, the exercise gives a really good example of where Splunk has such a great amount of power, and one of its major benefits lies in the way it is able to display data to your user.
In the following exercise, we are going to make a template from the Splunk App that we have just created. For me personally, I prefer to have all of my Splunk App code and configurations in the default directory of my Splunk App. I recommend that you copy the most recent HTML dashboards that we have created into a new html directory within the default directory of our Splunk App.