Complex projects inevitably throw up obstacles in the form of bugs. As these arise, you can congratulate yourself for choosing such a challenging project and bear in mind the satisfaction you will feel when all the problems have been overcome. Here is some software that should help you find and fix problems you may encounter.
Visualizing data from the sensors in real time can be tremendous help in understanding what is actually happening in your sketch. Figure C-1 shows the screen from a Processing sketch that enables you to easily view Arduino values.
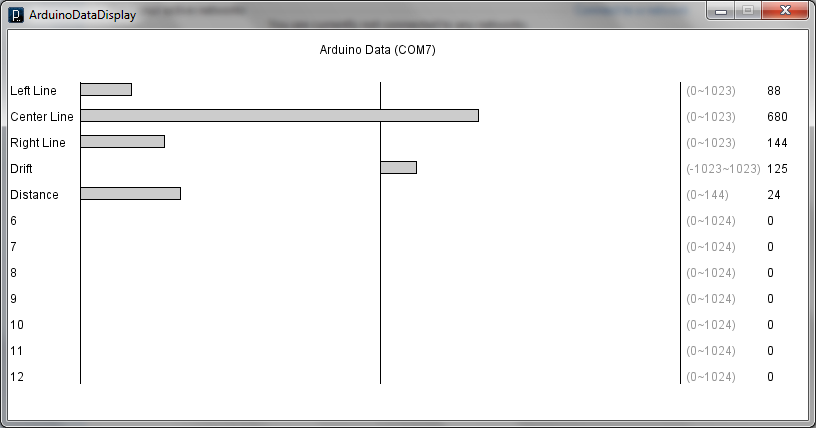
Figure C-1 depicts the analogRead values from left, center and right and sensors used in line detection. The grey numbers in parentheses on the right indicate the possible range of values, the following number is the numeric value sent from Arduino.
The figure shows the values when the robot is straying slightly to the right of a dark line it is trying to follow (the values increase when the sensor is over the line). The Position value goes positive when straying right and negative when left. The Position value is used in the line following sketch to adjust the robot direction so it stays on the line. The Distance value is in inches and is obtained from the ping distance sensor.
The Processing sketch expects data in the following format; fields are separated by commas:
The string: Data
The row to display; the first row is row 1
The value to display
The newline character " "
For example, sending "Data,2,680
" will display
a bar with a value of 680 on the second line.
You can send labels for each line by sending a string such as:
                    "Label,2,Center Line
"
, which will tag the second row with the label
"Center Line".
The data range can be sent using a string such as
"Range,5,0,144
"
which will set the range of the fifth line
from 0 to 144.
The easiest way to send this data is to add the DataDisplay tab to your sketch and call the functions to format and send the data:
sendData(row, value);sends the specified value for display on the given rowsendLabel(row, label);sends the specified label for display on the given rowsendRange(row, minimum, maximum);sends the minimum and maximum values for the specified row
The sketch named myRobotDebug contains the DataDisplay tab and provides
an example of how to send data to the Processing. Example C-1 shows the main sketch
code.
Example C-1. myRobotDebug main sketch code
/**********************************************************
MyRobotDebug.ino

Simple debug example using Processing debug monitor
This version displays values from the line and distance sensors

***********************************************************/
#include "robotDefines.h"  // global defines

const byte pingPin = 10; // Distance sensor connected to digital pin 10

enum {DATA_start, DATA_LEFT, DATA_CENTER, DATA_RIGHT,DATA_DRIFT,DATA_DISTANCE,
     DATA_nbrItems};

char* labels[]= {"","Left Line","Center Line","Right Line","Drift","Distance"};
int minRange[]= { 0,          0,            0,           0,  -1023,        0 };
int maxRange[]= { 0,       1023,         1023,        1023,   1023,       144};

// Setup runs at startup and is used configure pins and init system variables
void setup()
{
  Serial.begin(9600);
  while(!Serial);  // only needed for leonardo

  dataDisplayBegin(DATA_nbrItems, labels, minRange, maxRange );
  Serial.println("Ready");
}

void loop()
{
  lineSense();
  int distance = pingGetDistance(pingPin);
  sendData(DATA_DISTANCE, distance); // send distance
}

/****************************
   Line  Sensor code
****************************/
// defines for locations of sensors
const int SENSE_LINE_LEFT  = 0;
const int SENSE_LINE_RIGHT = 1;
const int SENSE_LINE_CENTER = 2;

//returns drift - 0 if over line, minus value if left, plus if right
int lineSense()
{
  int leftVal = analogRead(SENSE_LINE_LEFT);
  int centerVal = analogRead(SENSE_LINE_CENTER);
  int rightVal = analogRead(SENSE_LINE_RIGHT);

  sendData(DATA_LEFT, leftVal);      // send left sensor value
  sendData(DATA_CENTER, centerVal);  // send center sensor value
  sendData(DATA_RIGHT, rightVal);    // send right sensor values

  int leftSense = centerVal - leftVal;
  int rightSense = rightVal - centerVal;
  int drift = leftVal- rightVal   ;

  sendData(DATA_DRIFT, drift);    // send drift sensor values

  return drift;
}

// Returns the distance in inches
// this will return 0 if no ping sensor is connected or
// the distance is greater than around 10 feet
int pingGetDistance(int pingPin)
{
  long duration, cm;

  pinMode(pingPin, OUTPUT);
  digitalWrite(pingPin, LOW);
  delayMicroseconds(2);
  digitalWrite(pingPin, HIGH);
  delayMicroseconds(5);
  digitalWrite(pingPin, LOW);

  pinMode(pingPin, INPUT);
  duration = pulseIn(pingPin, HIGH, 20000); // if a pulse does not arrive in 20 ms then
                                            // the ping sensor is not connected
  if(duration >=20000)
    return 0;
  // convert the time into a distance
  cm = duration / 29 / 2;
  return (cm * 10) / 25 ; // convert cm to inches
}
The Arduino code that sends the data is in the tab named DataDisplay (Example C-2),
you can copy the code into any sketch you want to debug, or you can simply add the
tab to the sketch.
Example C-2. the DataDisplay tab code
// DataDisplay

void dataDisplayBegin(int nbrItems, char* labels[], int minRange[], int maxRange[] )
{
   for(int i = 1; i < nbrItems; i++)
   {
     sendLabel(i, labels[i]);
     sendRange(i,  minRange[i], maxRange[i]);
   }
}

void sendLabel( int row, char *label)
{
  sendString("Label"); sendValue(row); sendString(label); Serial.println();
}

void sendRange( int row, int min, int max)
{
  sendString("Range"); sendValue(row); sendValue(min); sendValue(max); Serial.println();
}


void sendData(int row, int val)
{
   sendString("Data"); sendValue(row); sendValue(val); Serial.println();
}

void sendValue( int value)
{
   Serial.print(value); Serial.print(",");
}

void sendString(char *string)
{
   Serial.print(string); Serial.print(",");
}
The Processing sketch is called ArduinoDataDisplay and is located in
the Processing folder of the example code download (see How to Contact Us for the download location). Example C-3 shows the code.
Example C-3. Processing sketch for displaying data
/*
 * ArduinoDataDisplay
 * based on Arduino Cookbook code from Recipe 4.4
 *
 * Displays bar graphs of sensor data sent as CSV from Arduino
 * in all cases, N is the Row to be associated with the given message
 * Labels sent as: "Label,N,the label
"  // "the label" is used for Row N
 * Range sent as : "Range,N,Min, Max
"  // Row N has a range from min to max
 *    if Min is negative then the bar grows from the midpoint of Min and Max,
 *    else the bar grows from Min
 * Data sent as:  "Data,N,val
"   // val is plotted for row N
 */

short portIndex = 1;  // select the com port, 0 is the first port

int maxNumberOfRows = 12;
int graphWidth      = 600;
int displayWidth    = 1024;
int displayHeight   = 800;

int fontSize = 12;
PFont fontA;

int windowWidth;
int windowHeight;

int graphHeight;
int rectCenter;
int rectLeft;
int rectRight;
int topMargin;
int bottomMargin;
int leftMargin = 50;
int rightMargin = 80;

int textHeight;

ArrayList<String> labelList = new ArrayList<String>();
int [] values   = { 0, 0, 0, 0, 0, 0, 0, 0, 0, 0, 0, 0, 0};
int [] rangeMin = { 0, 0, 0, 0, 0, 0, 0, 0, 0, 0, 0, 0, 0};
int [] rangeMax = { 0, 1024, 1024, 1024, 1024, 1024, 1024, 1024, 1024, 1024, 1024, 1024, 1024};

float lastMsgTime;
float displayRefreshInterval = 20; // min time between screen draws

void setup() {
  String os=System.getProperty("os.name");
  println(os);
  initComms();
  fontA = createFont("Arial.normal", fontSize);
  textFont(fontA);
  textHeight = (int)textAscent();
  for (int i = 0; i <= maxNumberOfRows; i++)
    labelList.add(Integer.toString(i));
  adjustSize();
  drawGrid();
}

void adjustSize()
{
  topMargin = 3 * textHeight;
  bottomMargin = 0;
  if (displayWidth > 800) {
    windowWidth = 800;
    windowHeight = topMargin + bottomMargin + yPos(maxNumberOfRows);
    size(windowWidth, windowHeight);
  }
  else {
    windowWidth = displayWidth;
    windowHeight = displayHeight;
  }
  //leftMargin = getleftMarginLen() ;
  graphHeight = windowHeight - topMargin - bottomMargin;
  rectCenter = leftMargin + graphWidth / 2;
  rectLeft = leftMargin;
  rectRight = leftMargin + graphWidth;
}

void drawGrid() {
  fill(0);
  String Title = "Arduino Data" + commsPortString() ;

  int xPos = (int)( rectCenter - textWidth(Title)/2) ;
  text(Title, xPos, fontSize*2); // Title

  line(rectLeft, topMargin + textHeight,
       rectLeft, yPos(maxNumberOfRows) + 2);     // left vertical line

  line(rectRight, topMargin + textHeight, rectRight, yPos(maxNumberOfRows )+ 2);  // right line
  line(rectCenter, topMargin+textHeight, rectCenter, yPos(maxNumberOfRows) + 2); // center line

  for (int i=1; i <= maxNumberOfRows; i++) {
    fill(0);
    text(labelList.get(i), 2, yPos(i));  // row labels
    fill(150);
    String rangeCaption = "(" + rangeMin[i] + "~"  + rangeMax[i] + ")";
    text(rangeCaption, rectRight + textWidth("  "), yPos(i)); // range caption
  }
}

int yPos(int index) {
  return topMargin  + ((index) * textHeight * 2);
}

void drawBar(int rowIndex) {
  fill(204);
  if ( rangeMin[rowIndex] < 0) {
    if (values[rowIndex] < 0) {
      int width = int(map(values[rowIndex], 0, rangeMin[rowIndex], 0, graphWidth/2));
      rect(rectCenter-width, yPos(rowIndex)-fontSize, width, fontSize);
    }
    else {
      int width = int(map(values[rowIndex], 0, rangeMax[rowIndex], 0, graphWidth/2));
      rect(rectCenter, yPos(rowIndex)-fontSize, width, fontSize);
    }
  }
  else {
    int width=int(map(values[rowIndex], rangeMin[rowIndex], rangeMax[rowIndex], 0,graphWidth));
    rect(rectLeft, yPos(rowIndex)-fontSize, width, fontSize);   //draw the value
  }
  fill(0);
  text(values[rowIndex],
       rectRight + (int)textWidth(" (-1000~1000)   "), yPos(rowIndex)); // print the value
}

void processMessages() {
  while(true) {
    String message = commsGetMessage();
    if (message.length() > 0)
    {
      int row = 0;

      String [] data  = message.split(","); // Split the CSV message
      if ( data[0].equals("Data")) {  // check for data header
        row =  Integer.parseInt(data[1]);
        values[row] = Integer.parseInt(data[2]);
        checkRefresh();
      }
      else if ( data[0].equals("Label") ) { // check for label header
        row =  Integer.parseInt(data[1]);
        labelList.set(row, data[2]);
        if ( (int)textWidth(data[2]) > leftMargin) {
          leftMargin = (int)(textWidth(data[2]) + textWidth("  ") + 2) ;
          adjustSize();
        }
        checkRefresh();
      }
      else if ( data[0].equals("Range")) {  // check for Range header
        row =  Integer.parseInt(data[1]);
        rangeMin[row] = Integer.parseInt(data[2]);
        rangeMax[row] = Integer.parseInt(data[3]);
        checkRefresh();
      }
     else
       println(message) ;
    }
    else
      break; // finish processing when the message length is 0
    }
  }

  void checkRefresh()
  {
    if ( lastMsgTime < 1)
      lastMsgTime = millis(); // update the time if it was reset by the last display refresh
  }

void draw() {
  processMessages();
  if ( millis() - lastMsgTime > displayRefreshInterval)
  {
    background(255);
    drawGrid();
    for ( int i=1; i <= maxNumberOfRows; i++)
    {
      drawBar(i);
    }
    lastMsgTime = 0;
  }
}

/******************************
  code for Serial port
*****************************/

import processing.serial.*;

Serial myPort;  // Create object from Serial class

void initComms(){
  String portName = Serial.list()[portIndex];
  println(Serial.list());
  println(" Connecting to -> " + portName) ;
  myPort = new Serial(this, portName, 9600);

}

String  commsPortString() {
  return " (" + Serial.list()[portIndex] + ")"  ;
}

String message;

String commsGetMessage() {

  if (myPort.available() > 0) {
    try {
      message = myPort.readStringUntil(10);
      if (message != null) {
       // print(message);
        return message;
      }
    }
    catch (Exception e) {
      e.printStackTrace(); // Display whatever error we received
    }
  }
  return "";
}
This sketch talks to Arduino using the serial port and you need to ensure that the
Processing sketch is using the same port that is connected to your robot. The port
Arduino uses is displayed on in the Arduino IDE. You set the Processing port by
changing the value of the variable portIndex. When starting the
Processing sketch, you will see a list of the ports on your computer.
portIndex is the position of the Arduino port in this list,
but note that the index starts from 0, so the default value of 1 for
portIndex is for the second port in the list.
A robot tethered via USB is not very convenient when you want to see what the robot is
doing while moving. Adding a wireless serial device such as Bluetooth or XBee can be
a big help when debugging or tuning your robot. If you are using a Leonardo,
note that the TX/RX pins (digital 1 and 0) are accessed through
Serial1 rather than Serial, so modify your
code accordingly (you'll need to replace all instances of Serial with Serial1 in all
the tabs of your sketch).
A standard board like the Uno uses the same Serial object as
USB and although you don't need to modify the example code, you will need to
disconnect the wireless device from the pins when uploading code. This is because
the wireless device uses the same pins (digital 1 and 0) as USB.