
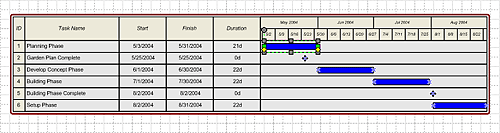
Just as you use Visio timelines to view your project at a glance, you use Gantt charts to manage the project details. With Gantt charts, you can track the details of each project task, create task dependencies, see how changes to one task affect another, and quickly identify task owners and status. A Gantt chart includes a list of project tasks and details about the tasks, Gantt bars that represent the duration of each task, and a timescale. With Gantt charts, you can track the specifics that project managers and project members need to complete their tasks and keep the project on schedule.

You can create Gantt charts from existing timeline data by using the Import Project Data Wizard or from scratch by using the Gantt Chart template. To create a Gantt chart from scratch, on the File menu, point to New, point to Project Schedule, and then click Gantt Chart. Then use the Gantt Chart Options dialog box to configure and format your Gantt chart.
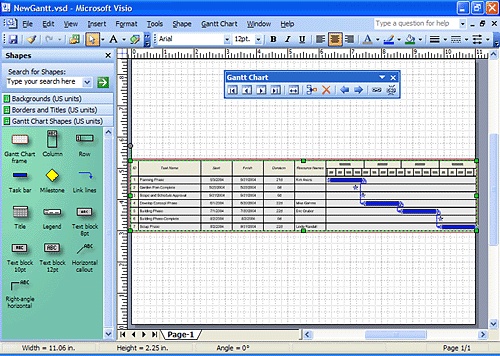
After you create a Gantt chart from existing data or from scratch, you add rows and columns to the chart. Each row represents a task, and each Gantt bar in a row represents the duration of the task. Each column represents project data you want to track, such as start date, end date, percentage complete, resource name, and task notes.
You can also show that one task can't start until another ends by creating task dependencies. To create task dependencies, you select the Gantt bar for the task that starts first, select the bar for the next task, and then link the bars. Visio draws arrows between the linked tasks.
In this exercise, you open the Gantt chart you created in the previous exercise and track task details by creating task dependencies, inserting columns, and creating new tasks. For visual appeal, you also add a title and background to the diagram.
OPEN the NewGantt file in the My DocumentsMicrosoft PressVisio 2003 SBSCreatingSchedules folder.
Select the first blue Gantt bar in the chart.
Hold down the
 key while you select the three other Gantt bars, from top to bottom.
Important
The order in which you select and link the tasks is important. Select the Gantt bar for the task that starts first, the bar for the task that can't start until the other ends, and so on. The bar you select first (the primary shape) is enclosed by a dark magenta selection box. The selection boxes for the other bars (secondary shapes) are light magenta, and the selection box for all the shapes is green.
To create task dependencies, on the Gantt Chart menu, click Link Tasks.
Visio links the selected tasks with lines.
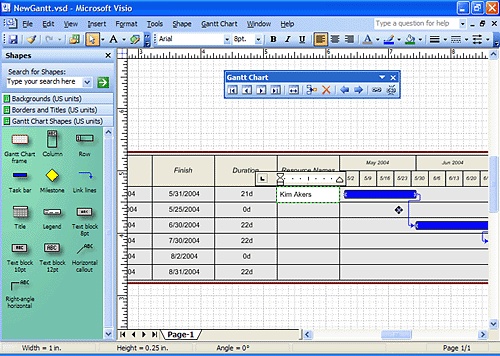
To track more task details, right-click the Duration column, and then click Insert Column.
The Insert Column dialog box appears.
To add column with which you can track each task owner, click the down arrow, click Resource Names in the list, and then click OK.
Visio inserts the Resource Names column after the Duration column.
On the Shape menu, click Center Drawing.
Visio centers the Gantt chart on the drawing page.
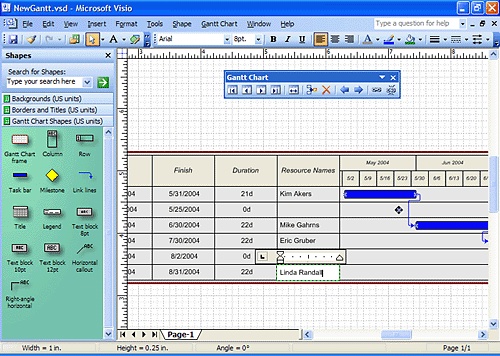
Select the first cell in the Resource Names column, and type Kim Akers.
Skip the second cell, select the third cell in the Resource Names column, and type Mike Gahrns.
Select the fourth cell in the Resource Names column, and type Eric Gruber.
Skip the fifth cell, select the last cell in the Resource Names column, and type Linda Randall.
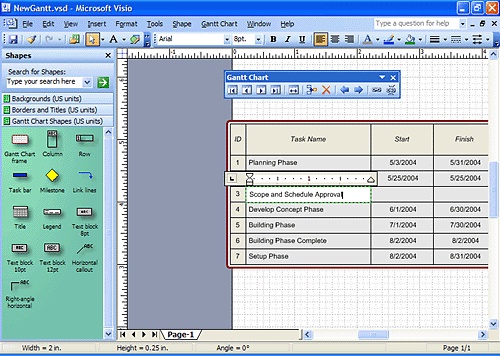
To add one more milestone to the Gantt chart, in the ID column, right-click 3 (the third row), and then click New Task on the shortcut menu.
Visio inserts a row before the Develop Concept Phase task row and selects the Task Name cell in the new row.
With the Task Name cell for the new milestone selected, type Scope and Schedule Approval.
Select the Start cell for the new milestone.
Visio inserts default task information for you.
Type 5/31, and click the drawing page outside the Gantt chart.
Visio changes the finish date to match the start date of the milestone.
To make this task a milestone, select the Duration cell for the task, type 0 because milestones don't have duration, and then click the drawing page outside the Gantt chart.
Visio changes the Gantt bar to a diamond.
To change the milestone shape to a star for all the milestones in the Gantt chart, on the Gantt Chart menu, click Options.
The Gantt Chart Options dialog box appears.
Click the Format tab, and in the Shape drop-down list, click Star.
Click OK.
Visio changes the milestone shapes in the Gantt chart from diamonds to stars.
To change the drawing page size so the Gantt chart fits on the page, on the File menu, click Page Setup.
The Page Setup dialog box appears.
Click the Page Size tab, and in the Page size area, select the Custom size option. In the Custom size area, type 13 in the first box.
Click OK.
Visio widens the drawing page.
On the Shape menu, click Center Drawing.
Visio centers the Gantt chart on the drawing page.
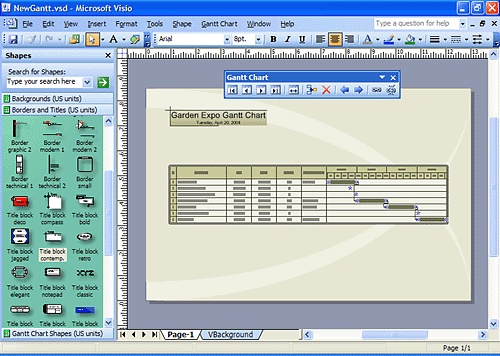
To add a background to the diagram, click the Backgrounds stencil, and drag the Background web shape onto the drawing page.
Visio creates a background for the diagram.
To add a title to the diagram, click the Borders and Titles stencil, drag the Title block contemp. shape onto the drawing page, and position it in the upper-left corner of the page.
With the Title block contemp. shape selected, press the
 key.
key.Highlight the word Title, and type a new title, Garden Expo Gantt Chart.
The shape expands to fit your title.
Click the pasteboard to close the text block and deselect the title shape.
Click the title shape, and drag it to align it with the left edge of the Gantt chart.
To add a color scheme to your timeline, right-click the drawing page, and click Color Schemes.
The Color Schemes dialog box appears.
In the Choose a color scheme list, click Coffee, and then click OK.
Visio changes the color scheme of the diagram.
On the File menu, click Save As to open the Save As dialog box.
In the File name box, type GanttChart, and click the Save button to save the diagram.


CLOSE the GanttChart file.