Organization charts are used to visually document the groups within an organization— such as departments and teams—and their reporting relationships. Using the Organization Chart template in Microsoft Office Visio, you can easily create organization charts by dragging shapes, which represent people within an organization, onto the drawing page. By taking advantage of the intelligent behavior of these shapes, you can show employee relationships within an organization. For example, when you drag shapes on top of other shapes, Visio positions and connects the shapes for you, creating the reporting hierarchy as you add shapes to the drawing page. Shapes in organization charts can also store information about the people and relationships within the organization, and you can show as much or little of that information as you choose. You can also rearrange the shapes in a chart and create synchronized copies of departments without redrawing the hierarchy from scratch.
With the Organization Chart Wizard template, you have even more options. The template includes a step-by-step approach to building organization charts from information stored in data files or information that you enter in the wizard. If you already have organization data stored in a file and you don't want to create a chart from scratch, or if you prefer entering data into a wizard rather than dragging shapes onto a drawing page, this template is for you. You can also share an organization chart—or any type of Visio diagram— by saving it as a Web page and publishing it to a Web site, such as a corporate intranet site. Colleagues or team members in any location can easily view the chart with a Web browser at any time of day or night, making global collaboration easier.
In this chapter, you import human resources data from a Microsoft Office Excel spreadsheet to create an organization chart for The Garden Company. You view the additional data stored with each shape, modify the data, display some of the data in the chart, and then format the text in all the shapes. You change the layout of the organization chart, insert a hyperlink, and add color and a background to enhance the appearance of the chart. Finally, you save the chart as a Web page and view it in a Web browser.
See Also
Do you need only a quick refresher on the topics in this chapter? See the Quick Reference entries. in Quick Reference
Important
Before you can use the practice files in this chapter, you need to install them from the book's companion CD to their default location. See "Using the Book's CD" for more information.
Today, many organizations maintain human resources information in electronic form. With the Organization Chart Wizard template, you can create an organization chart by importing employee information already stored in corporate data sources such as databases and data files. If the organizational structure changes, you can simply update the chart rather than having to re-create it—a huge timesaver, especially for large organizations. You can import organization data from Microsoft Office Excel spreadsheets (.xls), text files (.txt), Microsoft Office Exchange Server directories, Microsoft Office Access databases (.mdb), or any ODBC-compliant (Open Data Base Connectivity) database application.
Important
For the Organization Chart Wizard template to work, the source data must be properly formatted and include, at minimum, data identifying unique employee names and the managers to whom they report. In an Excel spreadsheet, columns of information represent data fields that can be imported to create an organization chart. For example, a human resources spreadsheet might include columns listing each person's name, manager, department, title, e-mail address, phone number, and office number.
With the Organization Chart Wizard template, you first specify the data source you want to use to import the data, and then you determine which columns contain the information for the organization chart. In a typical chart, Visio uses an Employee Name field and a Reports to field (the manager's name) to specify the reporting structure. That means that every employee name in the data source must be associated with the name of the manager to whom the employee reports (except the person at the very top of the organization). For example, if Luis Bonifaz (employee) reports to Bob Hohman (manager), the data source must include both of those pieces of information so that Visio can structure the organization chart correctly.
Next, you select the data fields you want to appear in the organization chart and identify the additional fields you want to import as custom properties. Custom properties are categories of information that are stored with each shape and that correspond to data. For example, a Manager shape might include a Telephone custom property, and the telephone number would be the custom property data. Custom property data might not be displayed in the chart, but it is additional information about each employee. For example, custom properties for a shape might include Name, Manager, Department, Title, E-mail Address, Phone Number, and Office Number. However, your organization chart might display only each employee's name and title. The additional custom property data can be viewed through the Custom Properties window in Visio, but it doesn't appear in the organization chart.
Tip
Depending on the size and number of shapes in your organization charts, you might need to periodically zoom in to the drawing page to see the shapes and text more clearly.
In this exercise, you import data from an Excel spreadsheet to generate an organization chart for The Garden Company. In addition to importing the Name and Reports to fields, you import data identifying the title, telephone number, and e-mail address for each employee.
Tip
For help creating organization charts, type "organization chart" in the "Type a question for help" box on the right side of the menu bar.
USE the TGC Employees.xls file located in the My DocumentsMicrosoft PressVisio 2003 SBS CreatingCharts folder.
Start Visio. In the Choose Drawing Type window, in the Category area, click Organization Chart. In the Template area, click Organization Chart Wizard.
The Organization Chart Wizard template opens a drawing page, three stencils, and the first page of the Organization Chart Wizard.
On the first page of the Organization Chart Wizard, make sure the Information that's already stored in a file or database option is selected, and then click Next.
The next page of the wizard appears, prompting you to identify the type of data source from which you are importing.
Make sure the A text, Org Plus (*.txt) or Excel file option is selected, and then click Next.
The next page of the wizard appears, prompting you to locate the file that contains the organization information.
Click Browse, navigate to the My DocumentsMicrosoft PressVisio 2003 SBSCreatingCharts folder, and then double-click TGC Employees.xls.
The wizard displays the file and its path.
Click Next.
The next page of the wizard appears, prompting you to choose the columns in the spreadsheet that contain the information that defines your organization.
In the Name box, make sure Name is displayed, and in the Reports to box, make sure Manager is displayed. Click Next.
The next page of the wizard appears, prompting you to choose the fields you want to display in your organization chart.
Make sure the Displayed fields list displays Name and Title. Click Next.
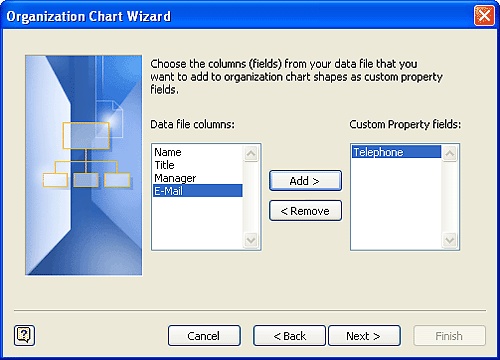
The next page of the wizard appears, prompting you to choose additional columns (or fields) to import into your organization chart as custom properties.
In the Data file columns box, click Telephone, and then click the Add button to move Telephone to the Custom Property fields box.
Telephone is listed in the Custom Property fields box.
Repeat the previous step to add E-Mail to the Custom Property fields box. Click Next.
The next page of the wizard appears, asking you whether you want Visio to break your organization chart across pages.
Make sure the I want the wizard to automatically break my organization chart across pages option is selected, and then click Finish.
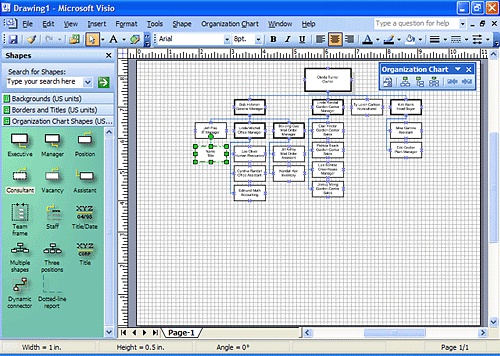
The wizard imports the data according to the specifications you entered, and Visio creates the organization chart on the drawing page. The Organization Chart Wizard template also opens an Organization Chart menu and toolbar.
From the Organization Chart Shapes stencil, drag a Consultant shape onto the Jeff Pike shape.
In the Connecting Shapes dialog box, select the Don't show this message again option, and then click OK.
Visio positions the Consultant shape below the Jeff Pike shape and draws a connector between the two shapes.
With the shape selected, press
 to open the shape's text block.
Type Jay Hamlin, press
 , and then type Network Consultant.
Visio displays the employee's name and title in the shape.
Tip
You can also add up to 50 employee shapes to your organization chart at once by using the Multiple shapes shape on the Organization Chart Shapes stencil. Just drag it on top of the shape that represents the manager to whom all the employees report, and then in the dialog box, select the number of and type of shapes you want to add.
Click the pasteboard to close the text block and deselect the shape.
Notice that this shape has a dashed-line border, which indicates that the shape represents a consultant.
On the File menu, click Close, and then click No when Visio asks you if you want to save the changes to the drawing.
Visio and the drawing close.