
Chapter 9: Extracting Metadata from Financial Documents
In the previous chapter, we learned how to build an intelligent solution for media content monetization using AWS AI services. We did this by talking about how our fictitious company LiveRight Holdings private limited requires a cost-effective expansion for content monetization. We designed an architecture using AWS AI services, media services, and the content delivery network for an end-to-end walkthrough of how to monetize content in video files.
In this chapter, we will look at how AWS AI services can help us extract metadata for financial filing reports for LiveRight Holdings. This will allow their financial analysts to look into important information and make better decisions concerning financial events such as mergers, acquisitions, and IPOs.
We will talk about what metadata is and why it is important to extract metadata. Then, we will cover how to use Amazon Comprehend entity extraction and how Amazon Comprehend events can be used to extract metadata from documents.
In this chapter, we will be covering the following topics:
- Extracting metadata from financial documents
- Setting up the use case
Technical requirements
For this chapter, you will need access to an AWS account. Please make sure that you follow the instructions specified in the Technical requirements section of Chapter 2, Introducing Amazon Textract, to create your AWS account, and log into the AWS Management Console before trying the steps in the Extracting metadata from financial documents section.
The Python code and sample datasets for our solution can be found at https://github.com/PacktPublishing/Natural-Language-Processing-with-AWS-AI-Services/tree/main/Chapter%2009. Please use the instructions in the following sections, along with the code in the aforementioned repository, to build the solution.
Check out the following video to see the Code in Action at https://bit.ly/3jBxp3E.
Extracting metadata from financial documents
In this section, we will talk about a use case where LiveRight Holdings private limited is attempting to acquire AwakenLife Pvt Ltd. They are going to do a press release soon and financial analysts are curious to identify the important metadata such as the acquisition date, amount, organization, and so forth so that they can act according to the market. LiveRight analyzed the Amazon Whole Foods merger to determine what it can learn and how metadata extraction will be useful for its due diligence. We will use the Amazon Whole Foods merger sample dataset to understand how you can perform metadata extraction using the preceding architecture:
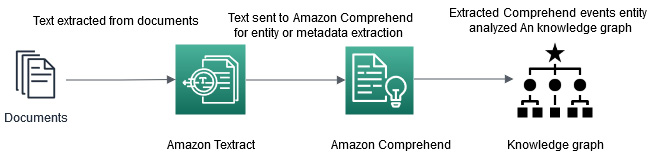
Figure 9.1 – Metadata extraction architecture
In this architecture, we will start with large financial documents for extracting metadata. We will show you how you can use Amazon Textract batch processing jobs to extract data from this large document and save this extracted data as a text file. Then, we will show you how to extract entities from this text file using Comprehend Events and visualize the relationships between the entity using a knowledge graph. Alternatively, you can use Amazon Neptune, which is a graph database that's used to visualize these relations.
In the next section, we'll look at this architecture by using Jupyter Notebook code.
Setting up the use case
In this section, we will cover how to get started and walk you through the architecture shown in the preceding diagram.
We have broken down the solution code walkthrough into the following sections:
- Setting up the notebook code and S3 bucket creation
- Uploading sample documents and extracting text using Textract
- Metadata extraction using Comprehend
- Starting Comprehend Events job with the SDK
- Collecting the Comprehend Events job results from S3
- Analyzing the output of Comprehend Events
Setting up the notebook code and S3 Bucket creation
Follow these steps to set up the notebook:
- In the SageMaker Jupyter notebook you set up in the previous chapters, Git clone https://github.com/PacktPublishing/Natural-Language-Processing-with-AWS-AI-Services/.
- Then, go to /Chapter 09/chapter 09 metadata extraction.ipynb and start running the notebook.
- Now that we have set up the notebook, we'll create an Amazon S3 bucket. Follow the steps provided in Chapter 2, Introducing Amazon Textract, to create an Amazon S3 bucket.
- Copy the created bucket, open your sample code from Chapter 9, Extracting Metadata from Financial Documents (Chapter 09/chapter 09 metadata extraction.ipynb), and paste it into the following notebook cell to get started:
bucket = '<your s3 bucket name>'
Note
We assume that your notebook has IAM access for Amazon Comprehend full access, Amazon S3 full access, and Amazon Textract full access. If you do not have access, you will get an access denied exception.
If you get an access denied exception while running any of the steps in this notebook, please go to Chapter 2, Introducing Amazon Textract, and set up the relevant IAM roles.
In the next section, we will walk you through the code so that you understand how the architecture works.
Uploading sample documents and extracting text using Textract
In this section, we will walk you through how you can quickly set up the proposed architecture shown in Figure 9.1. We have already created an Amazon S3 bucket where your output and sample documents will be stored. We also pasted that S3 bucket's name in the notebook cell. If you haven't done this yet, please complete the preceding steps.
We will refer to the following notebook: https://github.com/PacktPublishing/Natural-Language-Processing-with-AWS-AI-Services/blob/main/Chapter%2009/chapter%2009%20metadata%20extraction.ipynb. Let's get started:
- First, we must download the sample PDF financial press release document from Amazon S3.
Now, we must upload it using the upload_file S3 command via the sample_financial_news_doc.pdf boto3 API to an S3 bucket for processing. The same bucket will be used to return service output:
filename = "sample_financial_news_doc.pdf"
s3_client.upload_file(filename, bucket, filename)
Note
This PDF file consists of a press release statement of the Whole Foods and Amazon merger in 2017 and consists of 156 pages.
- Now, we will run Amazon Textract to convert this PDF into a text file; Amazon Comprehend accepts a text input file with UTF 8 encoding for metadata extraction as input. You can run the notebook code to start an asynchronous processing job to extract text from documents. We explained how the asynchronous Textract batch processing code works in detail in Chapter 2, Introducing Amazon Textract. If you want to deep dive, please refer to that chapter. Run the following cell to get the job results:
jobId = startJob(bucket, filename)
print("Started job with id: {}".format(jobId))
if(isJobComplete(jobId)):
response = getJobResults(jobId)
At this point, you will get a Job ID. Wait until the job's status changes from in progress to complete:

Figure 9.2 – Textract job status
- Now, we will convert the extracted data from Amazon Textract into a UTF 8 text file for Amazon Comprehend by running the following notebook cell:
text_filename = 'sample_finance_data.txt'
doc = Document(response)
with open(text_filename, 'w', encoding='utf-8') as f:
for page in doc.pages:
page_string = ''
for line in page.lines:
#print((line.text))
page_string += str(line.text)
#print(page_string)
f.writelines(page_string + " ")
The financial press release document text will be extracted from the press release documents:
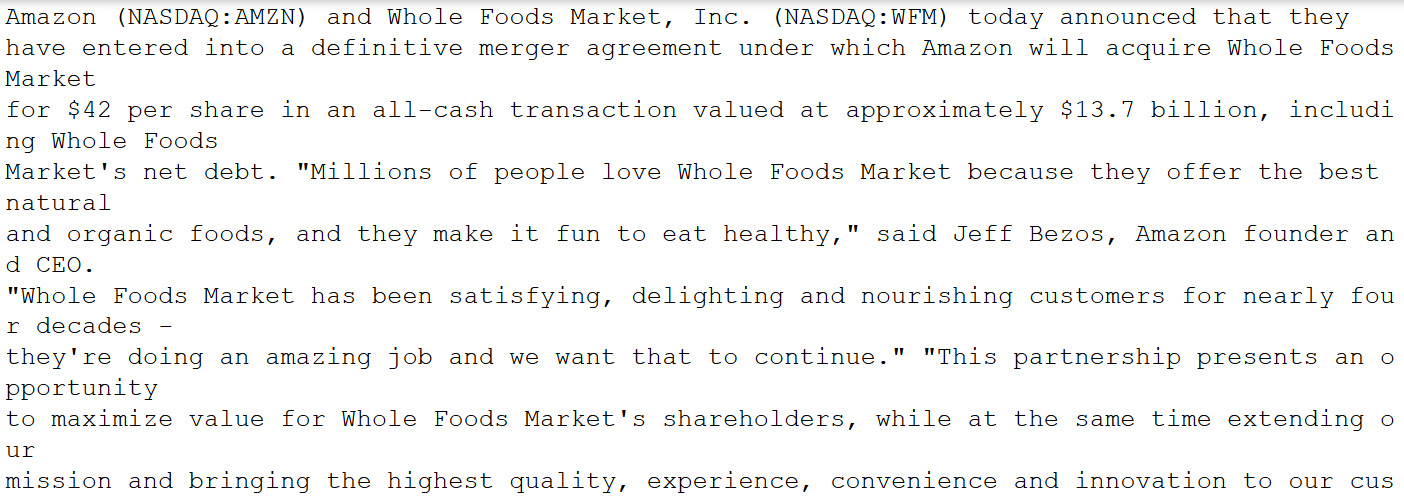
Figure 9.3 – Text extracted from the press release document using Amazon Textract
In this section, we covered how to extract text data from a press release document (a 2017 press release about Amazon's acquisition of Whole Foods), which consists of 156 pages, into text format using Amazon Textract. In the next section, we will talk about how to extract metadata from this document using Comprehend entity detection sync APIs and Comprehend events async jobs.
Metadata extraction using Comprehend
In this section, we will use the aforementioned text file to extract metadata using the Amazon Comprehend Events API.
Comprehend Events API
Amazon Comprehend Events is a very specific API that can help you analyze financial events such as mergers, acquisitions, IPO dates, press releases, bankruptcy, and more. It extracts important financial entities such as IPO dates, the merger parties' names, and so on from these events and establishes relationships so that financial analysts can act in real time on their financial models and make accurate predictions and quick decisions.
Amazon Comprehend Events can help you analyze asynchronous jobs. To do this, you must ensure you do the following first:
- Set up an Amazon Comprehend Events job through the AWS Console.
- Set up an Amazon Comprehend Events job through the notebook (https://github.com/PacktPublishing/Natural-Language-Processing-with-AWS-AI-Services/blob/main/Chapter%2009/chapter%2009%20metadata%20extraction.ipynb) using boto3 Python APIs.
Note
You can choose one of the aforementioned approaches to analyze your press release documents using Amazon Comprehend events.
Let's start by setting up an Amazon Comprehend Events job using the Amazon Comprehend consol:
- Open the Amazon Comprehend console by going to https://console.aws.amazon.com/comprehend/v2/home?region=us-east-1#home.
- Go to Analysis Jobs -> Create Analysis Job.
- In Job Settings, enter Name: Test-events. You will see that we can choose from various types of analysis, such as Sentiment, PII, Entity, and Topic modeling. Choose Events. For Language choose English, while for Target Event Types, choose all the available options, as shown in the following screenshot:
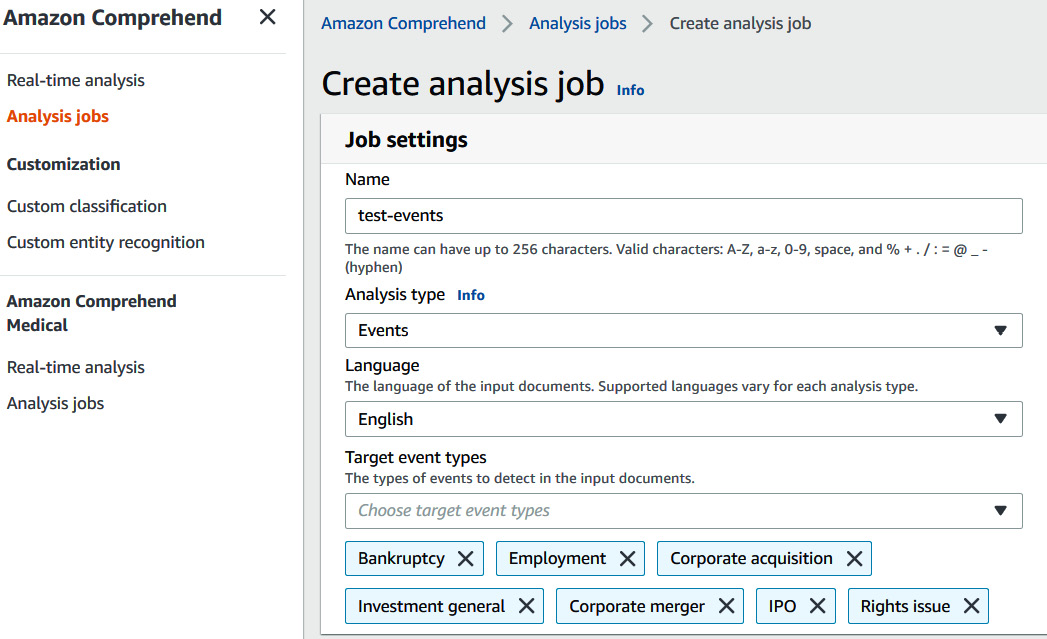
Figure 9.4 – Creating a Comprehend events analysis job
- For Input data, select My documents and provide the S3 location information of your input text file; for example, s3://<your bucket>/ sample_finance_data.txt. Choose one document per line for Input format.
Note
We are using one document per line as the input format instead of one document per file. This is because the total file size of this press release document is 655 KB and the limit for one document per file is 10 KB. One document per line format can have 5,000 lines in a single document; the press release document we are using for this demo contains 156 lines.

Figure 9.5 – Choosing Input data for the analysis job
- For Output Data, under S3 location, enter the location where you want your output to be saved. It will be the same bucket you created in the previous step; that is, s3://<your-bucket>:
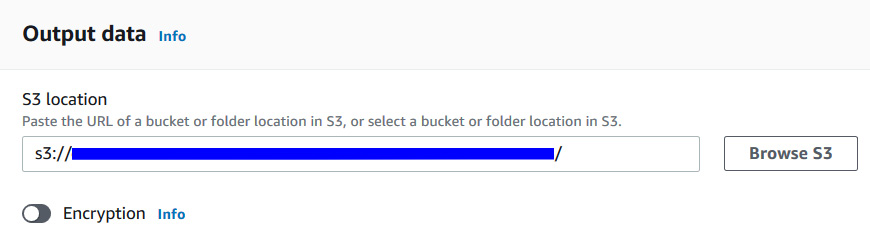
Figure 9.6 – Choosing an output S3 location for the analysis job
- For Access permissions, choose Create an IAM Role. For Name suffix, write events-role:
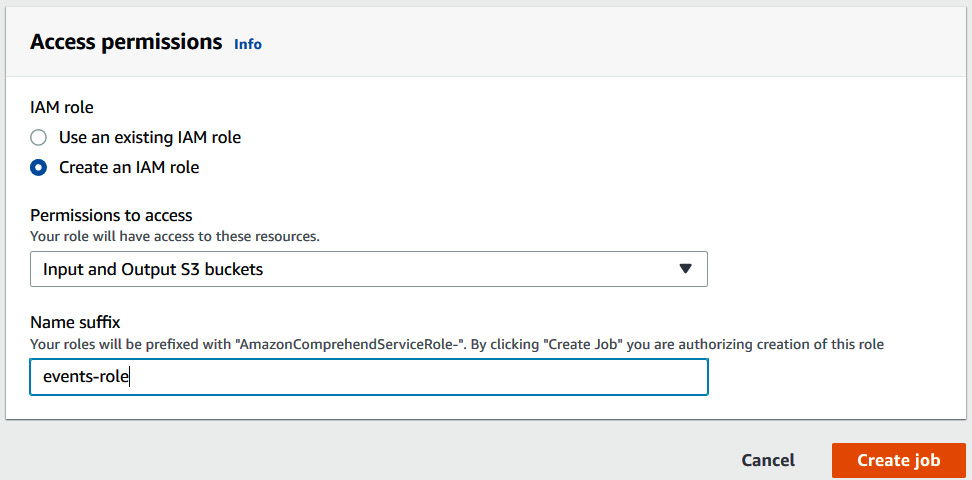
Figure 9.7 – Setting up access permissions by creating an IAM role
- Click on the Create Job button to trigger an events job. Grab a coffee/tea as this job will take 15 minutes to complete.
- Once your job is complete, go to Events-job, copy the job ID, as highlighted in the following screenshot, and move back to the Collect Results from S3 notebook section so that you can use this as the Events Job ID:
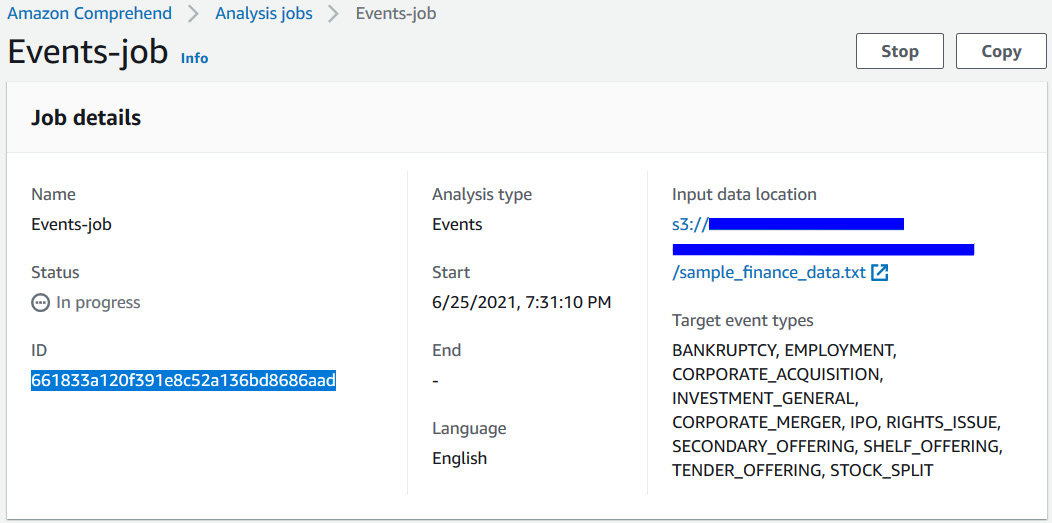
Figure 9.8 – Copying the job ID from the Job details page after creating a job
Note
If you are creating events using the Amazon Comprehend console, skip the Start an asynchronous job with the SDK section in the notebook and move on to the Collect the results from S3 section.
In this section, we covered how to create a Comprehend Events job using the AWS Console for a large financial press release document. Skip the next section if you have already set up using the console.
Starting Comprehend Events jobs with the SDK
In this section, we will switch back to our notebook to start an asynchronous job with the SDK. Let's get started:
- Create an IAM role by going to the IAM console at https://console.aws.amazon.com/iam/home?region=us-east-1#/home. Ensure that you create an IAM role with access to Comprehend and have specified S3. Paste the following into the cell:
job_data_access_role = 'arn:aws:iam::<your account number>:role/service-role/AmazonComprehendServiceRole-test-events-role'
- Run the following cell to set up other Events job parameters, such as event types and input data format:
input_data_format = 'ONE_DOC_PER_LINE'
job_uuid = uuid.uuid1()
job_name = f"events-job-{job_uuid}"
event_types = ["BANKRUPTCY", "EMPLOYMENT", "CORPORATE_ACQUISITION",
"INVESTMENT_GENERAL", "CORPORATE_MERGER", "IPO",
"RIGHTS_ISSUE", "SECONDARY_OFFERING", "SHELF_OFFERING",
"TENDER_OFFERING", "STOCK_SPLIT"]
- Run the following cell to trigger the Events analysis job. This job is calling the Python boto 3 starts event detection job API. Go to https://boto3.amazonaws.com/v1/documentation/api/latest/reference/services/comprehend.html#Comprehend.Client.start_events_detection_job to learn more:
response = comprehend_client.start_events_detection_job(
InputDataConfig={'S3Uri': input_data_s3_path,
'InputFormat': input_data_format},
OutputDataConfig={'S3Uri': output_data_s3_path},
DataAccessRoleArn=job_data_access_role,
JobName=job_name,
LanguageCode='en',
TargetEventTypes=event_types
)
events_job_id = response['JobId']
In this section, we covered how to trigger Comprehend Events analysis jobs using the SDK. At this point, we have a job ID that we will use in the next section to collect the output and analyze the metadata.
Collecting the results from S3
In this section, we will analyze the output results of this job in Amazon S3. Let's get started:
- If you used the Amazon Comprehend console previously, you must have copied the Job ID at the end of that section. Please paste it in the following cell by uncommenting it. Then, run the cell:
events_job_id ="<Job ID>"
- If you used the Amazon Comprehend SDK to trigger Events analysis jobs, continue with the following cell to track the job's status:
job = comprehend_client.describe_events_detection_job(JobId=events_job_id)
waited = 0
timeout_minutes = 30
while job['EventsDetectionJobProperties']['JobStatus'] != 'COMPLETED':
sleep(60)
waited += 60
assert waited//60 < timeout_minutes, "Job timed out after %d seconds." % waited
job = comprehend_client.describe_events_detection_job(JobId=events_job_id)
- Once the job is completed, you can get the output from Amazon S3 by running the following cell:
output_data_s3_file = job['EventsDetectionJobProperties']['OutputDataConfig']['S3Uri'] + text_filename + '.out'
results = []
with smart_open.open(output_data_s3_file) as fi:
results.extend([json.loads(line) for line in fi.readlines() if line])
In this section, we covered how to track a Comprehend Events job's completion using SDKs and collect the output from Amazon S3. Now that we have collected the results, we will analyze the results and metadata that have been extracted.
Analyzing the output of Comprehend Events
In this section, we will show you different ways you can analyze the output of Comprehend Events. This output can be used by financial analysts to predict market trends or look up key information in large datasets. But first, let's understand the Comprehend Events system's output (https://docs.aws.amazon.com/comprehend/latest/dg/how-events.html):
- The system returns JSON output for each submitted document. The structure of the response is shown here:
result = results[0]
result
In the response, you get entities, as well as entities grouped as mentions, arguments, and triggers, along with the confidence score. We will see these terms being used throughout the notebook:
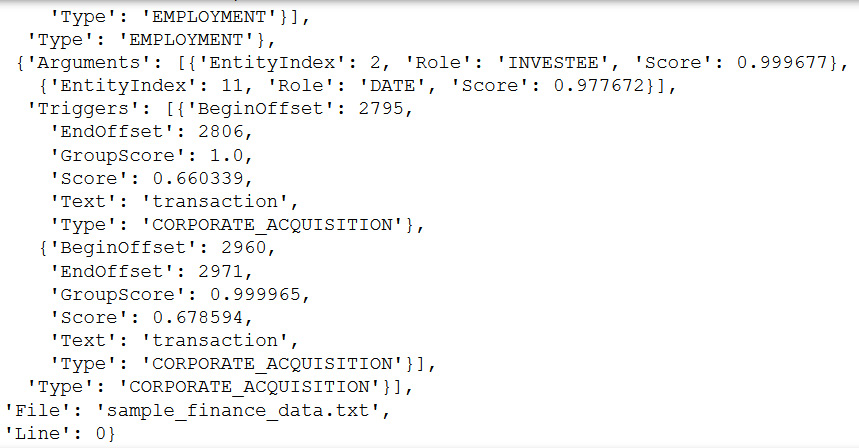
Figure 9.9 – Comprehend events JSON output
- Events are groups of triggers. The API's output includes the text, character offset, and type of each trigger, along with the confidence score. The confidence of event group membership is provided by GroupScore. Run the following notebook cell to take a look at these:
result['Events'][1]['Triggers']
The following is the output of the preceding code:
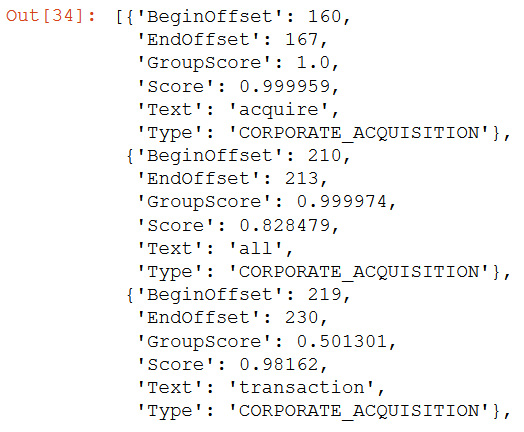
Figure 9.10 – Comprehend events triggers
acquire and transaction are related to the CORPORATE_ACQUISTION type event.
- Arguments are linked to entities by EntityIndex, along with the classification confidence of the role assignment. It talks about how the entity is related to the event. Run the following code to understand this:
result['Events'][1]['Arguments']
The output of arguments will look as follows:
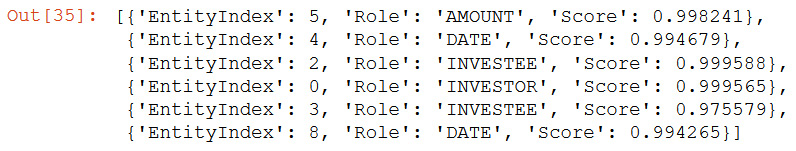
Figure 9.11 – Comprehend events arguments
Investee, Amount, and Date are roles with entity indexes and confidence scores.
- Entities are groups of Mentions that consist of text, character offset, and type of each mention, along with their confidence scores. The confidence of the entity group's membership is provided by Group Scores. Let's run the following cell to understand this:
result['Entities'][5]['Mentions']
The following output shows what the Mention entity looks like:
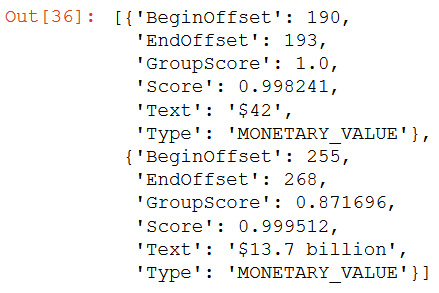
Figure 9.12 – Comprehend events mentions
entityIndex 5 refers to the Type Monetary_Value in the output.
Now that we know what entity, arguments, and mentions are, let's visualize the relationships between them.
Visualizing events and entities
In the remainder of the notebook, we'll provided several tabulations and visualizations to help you understand what the API is returning. First, we'll look at spans, both triggers and entity mentions. One of the most essential visualization tasks for sequence labeling tasks is highlighting tagged text in documents. For demonstration purposes, we'll do this with displaCy, which is a built-in dependency visualizer that lets you check your model's predictions in your browser (https://explosion.ai/demos/displacy):
- Run the following code to convert entity into displaCy format. Convert the output of Events into displaCy format:
entities = [
{'start': m['BeginOffset'], 'end': m['EndOffset'], 'label': m['Type']}
for e in result['Entities']
for m in e['Mentions']
]
- Use the following code to map triggers:
triggers = [
{'start': t['BeginOffset'], 'end': t['EndOffset'], 'label': t['Type']}
for e in result['Events']
for t in e['Triggers']
]
- Run the following code so that spans is sorted so that displaCy can process it correctly:
spans = sorted(entities + triggers, key=lambda x: x['start'])
tags = [s['label'] for s in spans]
output = [{"text": raw_texts[0], "ents": spans, "title": None, "settings": {}}]
- Now, we will render all entities participating in the event by running the following notebook code:
displacy.render(output, style="ent", options={"colors": color_map}, manual=True)
The following is the output of running the preceding code:
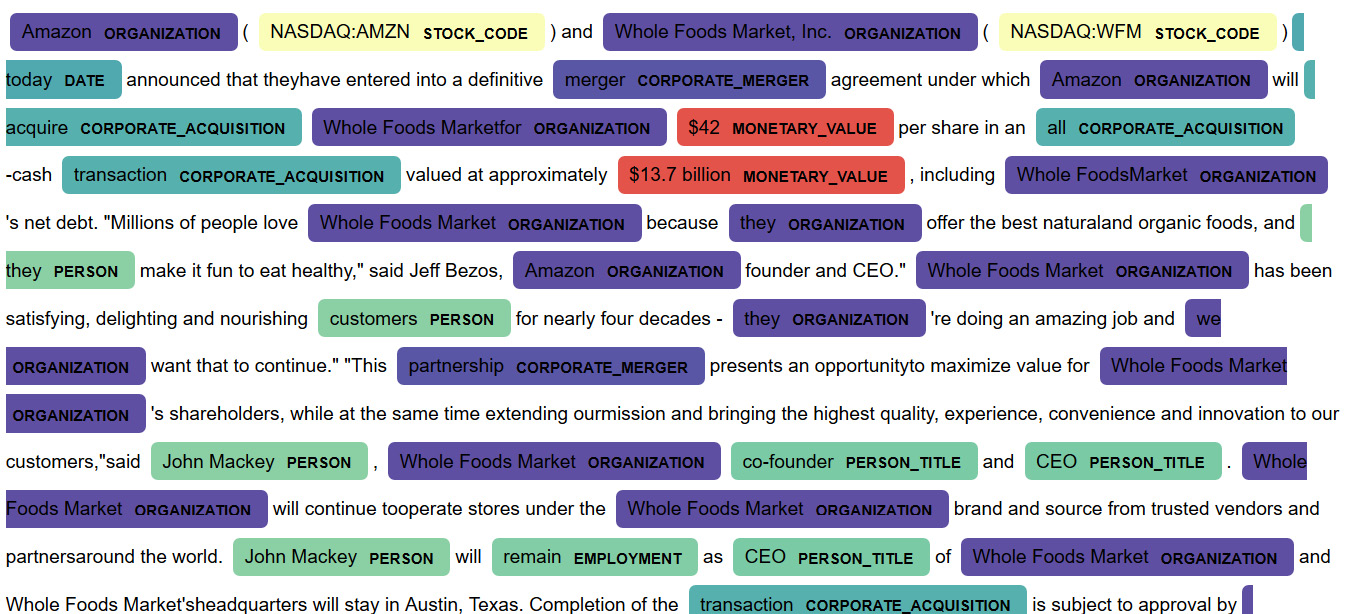
Figure 9.13 – Comprehend events and entities
We have color-coded the events based on the relationships that were found. Just by looking at the highlighted entities and relationships that are the same color, we can see that John Mackey is the co-founder and CEO and that he will remain employed.
Rendering tabular data
Many financial users use Events to create structured data from unstructured text. In this section, we'll demonstrate how to do this with pandas.
First, we must flatten the hierarchical JSON data into a pandas DataFrame by doing the following:
- Create the entities DataFrame. The entity indices must be explicitly created:
entities_df = pd.DataFrame([
{"EntityIndex": i, **m}
for i, e in enumerate(result['Entities'])
for m in e['Mentions']
])
- Create the events DataFrame. The Event indices must be explicitly created:
events_df = pd.DataFrame([
{"EventIndex": i, **a, **t}
for i, e in enumerate(result['Events'])
for a in e['Arguments']
for t in e['Triggers']
])
- The following code will join the two tables into one flat data structure:
events_df = events_df.merge(entities_df, on="EntityIndex", suffixes=('Event', 'Entity'))
The following is the output of EntityIndex as a tabular structure:
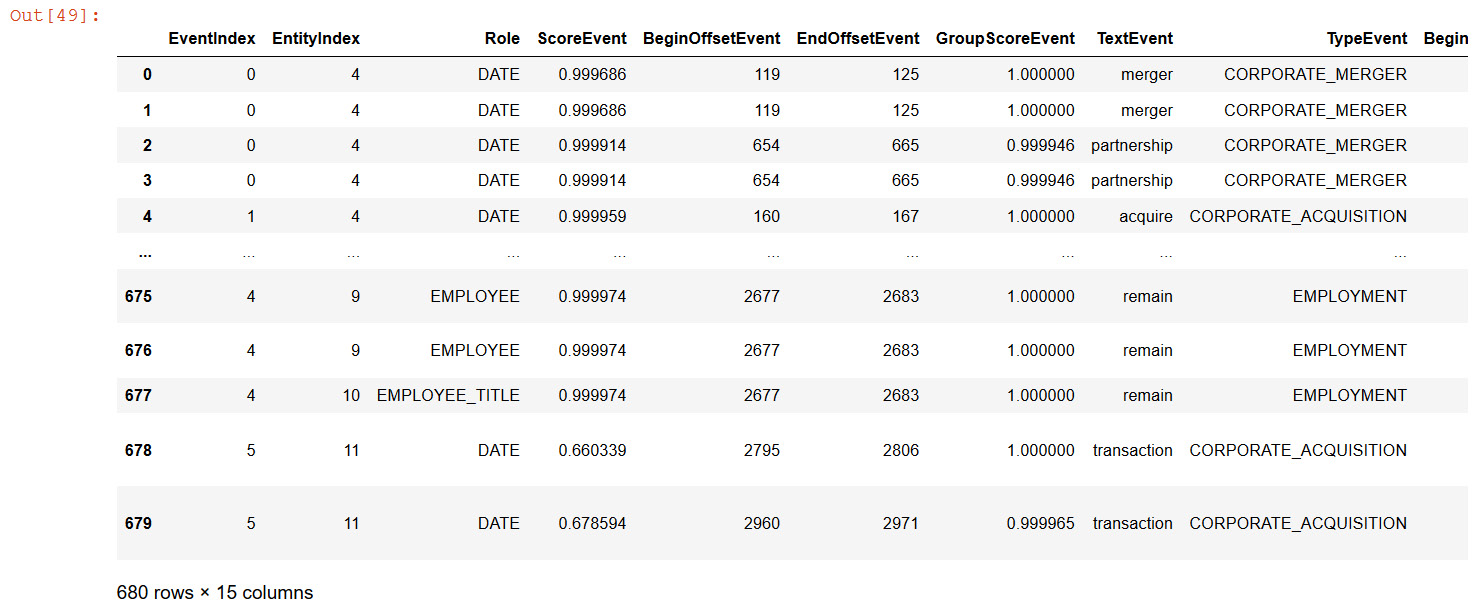
Figure 9.14 – Comprehend events entity as a DataFrame
We can see that its easy to analyze and extract important events and metadata respective to those events such as Date and time as a python pandas dataframe. Once your data is in dataframe this can be easily saved into downstream applications such as a database or a graph database for furthur analysis.
Tabular representation of analytics
We're primarily interested in the event structure, so let's make that more transparent by creating a new table with Roles as a column header, grouped by event:
- The following code will do this for us:
def format_compact_events(x):
This code will take the most commonly occurring EventType and the set of triggers.
d = {"EventType": Counter(x['TypeEvent']).most_common()[0][0],
"Triggers": set(x['TextEvent'])}
This code will loop for each argument Role, collect the set of mentions in the group.
for role in x['Role']:
d.update({role: set((x[x['Role']==role]['TextEntity']))})
return d
- The following code will group data by EventIndex and format:
event_analysis_df = pd.DataFrame(
events_df.groupby("EventIndex").apply(format_compact_events).tolist()
).fillna('')
event_analysis_df
The following screenshot shows the output of the DataFrame representing the tabular format of Comprehend Events:
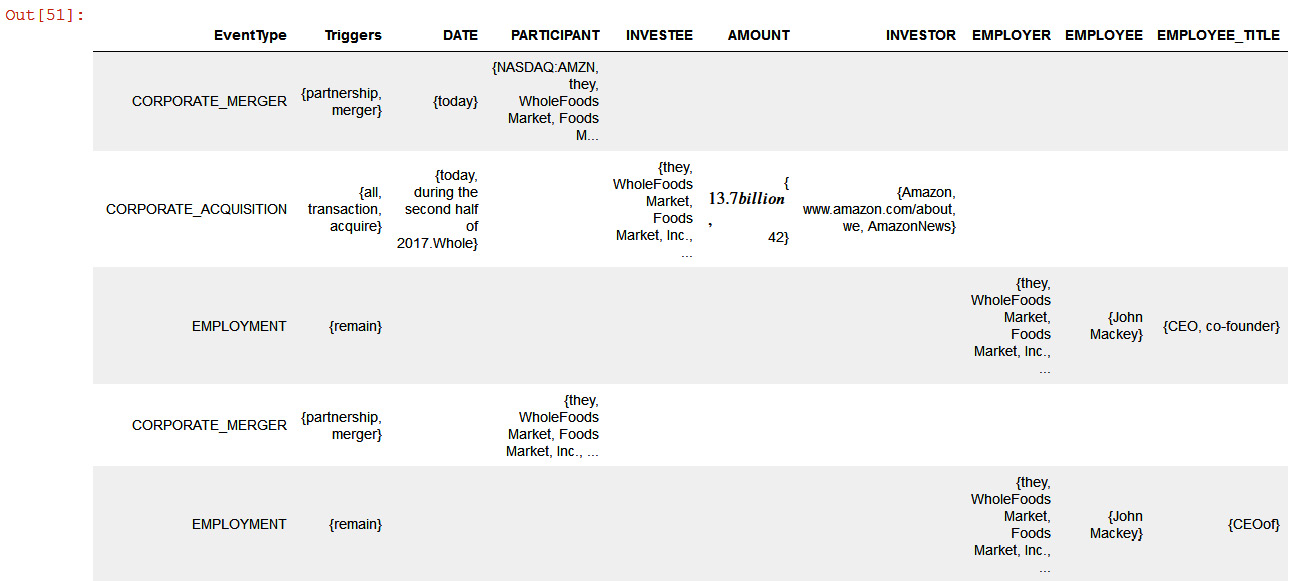
Figure 9.15 – Comprehend events tabular representation
In the preceding output, we have a tabular representation of the event type, date, investee, investor, employer, employee, and title, all of which can easily be used by financial analysts to look into the necessary metadata.
Graphing event semantics
The most striking representation of the output of Comprehend Events can be found in a semantic graph, which is a network of the entities and events that have been referenced in a document(s). The code we will cover shortly (please open the pyvis link for this) uses two open source libraries: Networkx and pyvis. Networkx is a Python package that's used to create, manipulate, and study the structure, dynamics, and functions of complex networks (https://networkx.org/), while pyvis (https://pyvis.readthedocs.io/en/latest/) is a library that allows you to quickly generate visual networks to render events system output. The vertices represent entity mentions and triggers, while the edges are the argument roles held by the entities concerning the triggers in the graph.
Formatting data
The system output must be conformed to the node (that is, the vertex) and edge list format required by Networkx. This requires iterating over triggers, entities, and argument structural relations. Note that we can use the GroupScore and Score keys on various objects to prune nodes and edges where the model has less confidence. We can also use various strategies to pick a "canonical" mention from each mention group to appear in the graph; here, we have chosen the mention with the longest string-wise extent. Run the following code to format it:
- Entities are associated with events by group, not individual mentions for simplicity. The following method assumes that the canonical mention is the longest one:
def get_canonical_mention(mentions):
extents = enumerate([m['Text'] form in mentions])
longest_name = sorted(extents, key=lambda x: len(x[1]))
return [mentions[longest_name[-1][0]]]
- Set a global confidence threshold:
thr = 0.5
- In the following code, we are representing nodes as (id, type, tag, score, mention_type) tuples:
trigger_nodes = [
("tr%d" % i, t['Type'], t['Text'], t['Score'], "trigger")
for i, e in enumerate(result['Events'])
for t in e['Triggers'][:1]
if t['GroupScore'] > thr
]
entity_nodes = [
("en%d" % i, m['Type'], m['Text'], m['Score'], "entity")
for i, e in enumerate(result['Entities'])
for m in get_canonical_mention(e['Mentions'])
if m['GroupScore'] > thr
]
- In the following code, we are representing edges as (trigger_id, node_id, role, score) tuples:
argument_edges = [
("tr%d" % i, "en%d" % a['EntityIndex'], a['Role'], a['Score'])
for i, e in enumerate(result['Events'])
for a in e['Arguments']
if a['Score'] > thr
- To create a compact graph, once the nodes and edges have been defined, we can create and visualize the graph by using the following code block:
G = nx.Graph()
- Iterate over the triggers and entity mentions, as follows:
for mention_id, tag, extent, score, mtype in trigger_nodes + entity_nodes:
label = extent if mtype.startswith("entity") else tag
G.add_node(mention_id, label=label, size=score*10, color=color_map[tag], tag=tag, group=mtype)
- The following code iterates over the argument role assignments:
for event_id, entity_id, role, score in argument_edges:
G.add_edges_from(
[(event_id, entity_id)],
label=role,
weight=score*100,
color="grey"
)
- The following code drops mentions that don't participate in events:
G.remove_nodes_from(list(nx.isolates(G)))
nt = Network("600px", "800px", notebook=True, heading="")
nt.from_nx(G)
nt.show("compact_nx.html")
The following is the output in graph format:
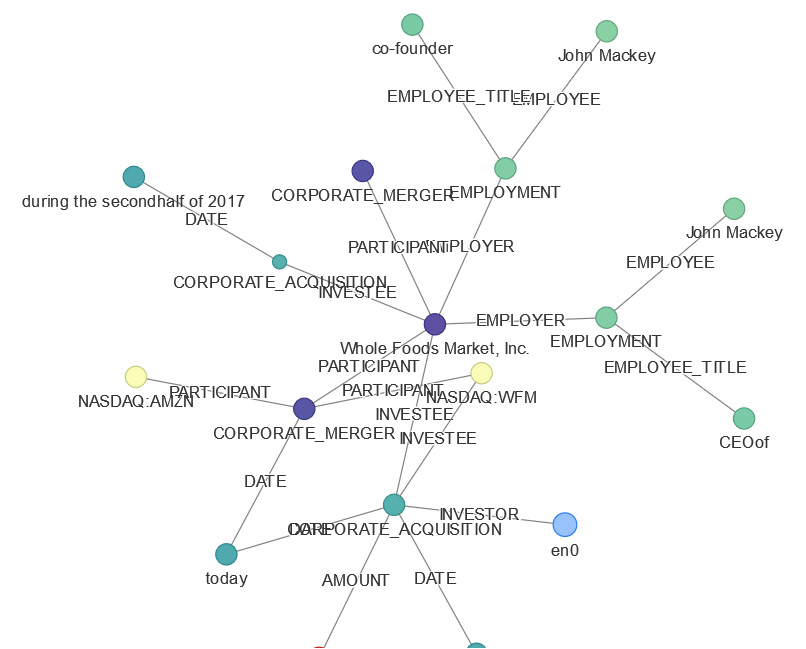
Figure 9.16 – Comprehend events knowledge graph representation
In the preceding output, if we traverse this graph, we can see the relationships between the entity, known as Whole Foods, which is a participant in the corporate merger, and its employer. This is John Macey, whose title is CEO.
A more complete graph
The preceding graph is compact and only relays essential event type and argument role information. We can use a slightly more complicated set of functions to graph all of the information returned by the API.
This convenient function in events_graph.py. It plots a complete graph of the document, showing all events, triggers, and entities, as well as their groups:
import events_graph as evg
evg.plot(result, node_types=['event', 'trigger', 'entity_group', 'entity'], thr=0.5)
The following is the output in graph format:
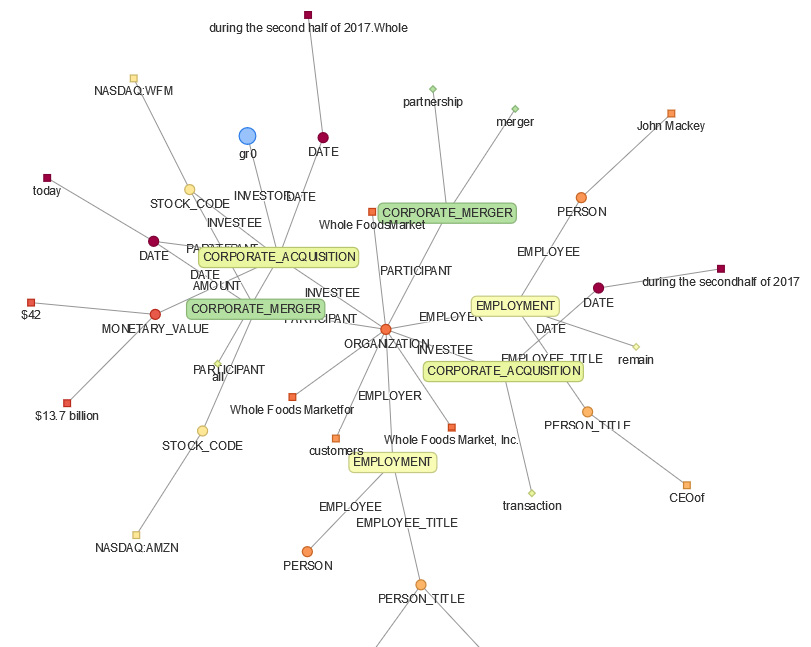
Figure 9.17 – Comprehend Events knowledge graph visualization
Note
You can use Amazon Neptune for large-scale knowledge graph analysis with Amazon Comprehend Events.
Here, we have extracted the metadata and analyzed it in a tabular manner and showed how we can present it in a graph. You can use Amazon Neptune for large-scale knowledge graph analysis with Amazon Comprehend Events, as we covered in Figure 9.1.
To deep dive into how you can do this using Amazon Neptune, please refer to the Further reading section for the relevant blog, which will walk you through how you can build a knowledge graph in Amazon Neptune using Amazon Comprehend Events.
Note
Entities extracted with Comprehend Events are going to be different than Comprehend detect entity API as events are specific to the financial event's entity and relationship extraction.
You can also extract metadata from Amazon Comprehend for Word or PDF documents using either a detect entity, a custom entity, or even Comprehend Events in the case of financial documents and enrich the document labeling process using SageMaker Ground Truth. SageMaker Ground Truth is a service that is primarily used for labeling data.
Summary
In this chapter, we learned why metadata extraction is really important before looking at the use case for LiveRight, our fictitious bank, which had acquisitions that made a press release statement. Financial analysts wanted to quickly evaluate the events and entities concerning this press release and wanted to make market predictions. We looked at an architecture to help you accomplish this. In the architecture shown in Figure 1.1, we spoke about how you can use AWS AI services such as Amazon Textract to extract text from the sample press release documents. Then, we saved all the text with utf-8 encoding in the Amazon S3 bucket for Amazon Comprehend entity or metadata extractions jobs.
We used an Amazon Comprehend Events job to extract entities and relationships between the entity. We have provided a walkthrough video link of the Comprehend Events feature in the Further reading section if you wish to learn more. We also provided two ways to configure Comprehend Events job; that is, use either the AWS console or AWS Python boto3 APIs. Finally, we talked about how you can visualize this relationship between extracted metadata using either a graph API such as displayCy, Networkx, or pyvis, or using Amazon Neptune's graph database. We also suggested that this metadata can be further used as an input to data labeling using Amazon SageMaker Ground Truth.
In the next chapter, we will talk about how you can perform content monetization for your cool websites.
Further reading
To learn more about the topics that were covered in this chapter, take a look at the following resources:
- Building a knowledge graph in Amazon Neptune using Amazon Comprehend Events, by Brian O'Keefe, Graham Horwood, and Navtanay Sinha (https://aws.amazon.com/blogs/database/building-a-knowledge-graph-in-amazon-neptune-using-amazon-comprehend-events/).
- Announcing the launch of Amazon Comprehend Events, by Graham Horwood, Sameer Karnik, and Ben Snively (https://aws.amazon.com/blogs/machine-learning/announcing-the-launch-of-amazon-comprehend-events/).
- Fintech Snacks 2 – Extracting Market-Moving Events with Amazon Comprehend Events, by Mona Mona and Evan Peck (https://www.youtube.com/watch?v=QvmVT_8y7-Y).