
Chapter 17: Visualizing Insights from Handwritten Content
In the previous chapters, we talked about and learned how to build Intelligent Document Processing (IDP) pipelines using Amazon Textract, Amazon Comprehend, and Amazon A2I. The advantage of setting up such pipelines is that you introduce automation into your operational processes and unlock insights that were previously not so evident. Speaking of insights, what are they exactly and why is everyone so interested in mining text, and of what use can they be?
To answer this, let's summon Doc Brown and Marty McFly's time-traveling car, the DeLorean from the movie Back to the Future, and travel back to Chapter 1, NLP in the Business Context and Introduction to AWS AI Services, to re-read the Understanding why NLP is becoming mainstream section. Remember now? Maybe this will help: according to Webster's dictionary (https://www.merriam-webster.com/), the word "insight" is defined as "the act or result of apprehending the inner nature of things or of seeing intuitively." You got it – it is all about uncovering useful information from seemingly vague or even mundane data. Simply put, it means to "see with clarity."
This chapter is all about how to visualize insights from text – that is, handwritten text – and make use of it to drive decision-making. According to Wikipedia, the earliest known handwritten script was Cuneiform (https://en.wikipedia.org/wiki/Cuneiform), which was prevalent almost 5,500 years ago. Equally old in spoken and written form is the native language of one of the authors, the Tamil language. That said, let's now head back to our favorite fictional organization, LiveRight Holdings, to solve a new challenge they seem to be having.
You have been given the task of running the Founder's Day for the firm, which is touted to be a spectacular gala, considering how popular LiveRight has become. To keep up with LiveRight's culture of benefiting the community, you will have to work with several local vendors to source what you need, such as furniture, food, and other items, for the event. You have been told that the management needs aggregated reports of all expenditure, so you decide to use your existing Document Processing pipeline to process their receipts. However, to your chagrin, you discover that the local vendors only provide handwritten receipts. You remember from a previous solution you built that Amazon Textract supports handwritten content, so you start thinking about how best to design for the situation.
In this chapter, we will cover the following topics:
- Extracting text from handwritten images
- Visualizing insights using Amazon QuickSight
Technical requirements
For this chapter, you will need access to an AWS account, which you can do at https://aws.amazon.com/console/. Please refer to the Signing up for an AWS account sub-section within the Setting up your AWS environment section of Chapter 2, Introducing Amazon Textract, for detailed instructions on how you can signup for an AWS account and sign into the AWS Management Console.
The Python code and sample datasets for the solution discussed in this chapter can be found at https://github.com/PacktPublishing/Natural-Language-Processing-with-AWS-AI-Services/tree/main/Chapter%2017.
Check out the following video to see the Code in Action at https://bit.ly/3vLX5j0.
Extracting text from handwritten images
At this point, you are ready to start designing and building the approach. You realize that what will you build for this use case will become an extension of the existing Document Processing solution, so it will have long-term usage within the organization. So, you need to design for future scalability. With this in mind, you decide to use Amazon S3 (https://aws.amazon.com/s3/) for object storage, Amazon Textract (https://aws.amazon.com/textract/) for handwriting detection, and Amazon QuickSight (https://aws.amazon.com/quicksight/), a serverless ML-powered business intelligence service, for visualizing the insights from the handwritten content. We will be using an Amazon SageMaker Jupyter notebook for text extraction, followed by the AWS Management Console to set up the QuickSight visualizations. Let's get started.
Creating the SageMaker Jupyter notebook
If you have not done so in the previous chapters, you will have to create an Amazon SageMaker Jupyter notebook and set up Identity and Access Management (IAM) permissions for that Notebook Role to access the AWS services we will use in this notebook. After that, you will need to clone this book's GitHub repository (https://github.com/PacktPublishing/Natural-Language-Processing-with-AWS-AI-Services), create an Amazon S3 bucket (https://aws.amazon.com/s3/), and provide the bucket name in the notebook to start execution.
Note
Please ensure you have completed the tasks mentioned in the Technical requirements section.
Follow these steps to complete these tasks before we execute the cells from our notebook:
- Follow the instructions documented in the Creating an Amazon SageMaker Jupyter notebook instance sub-section in the Setting up your AWS environment section of Chapter 2, Introducing Amazon Textract, to create your Jupyter notebook instance.
IAM Role Permissions While Creating Amazon SageMaker Jupyter Notebooks
Accept the default for the IAM Role at notebook creation time to allow access to an S3 bucket.
- Once you have created the notebook instance and its status is InService, click on Open Jupyter from the Actions menu heading to get the notebook instance.
- This will take you to the home folder of your notebook instance.
- Click on New and select Terminal.
- If you've not done so already, in the terminal window, type cd SageMaker, followed by git clone https://github.com/PacktPublishing/Natural-Language-Processing-with-AWS-AI-Services.
- Now, exit the terminal window and go back to the home folder; you will see a folder called Natural-Language-Processing-with-AWS-AI-Services. Click this folder to bring up the chapter folders and click on Chapter 17.
- Open this folder by clicking on it. You should see a notebook called chapter17-deriving-insights-from-handwritten-content-forGitHub.ipynb. Open this notebook by clicking on it. We will need this notebook in the upcoming sections. For now, leave this window open.
Next, we'll cover some additional IAM prerequisites.
Additional IAM prerequisites
We have to enable additional policies for our SageMaker notebook role. Please refer to the Changing IAM permissions and trust relationships for the Amazon SageMaker notebook execution role sub-section in the Setting up your AWS environment section of Chapter 2, Introducing Amazon Textract, for detailed instructions for executing the following steps:
- Please attach all the TextractFullAccess policies to your Amazon SageMaker Notebook IAM Role if you haven't done so already.
- Add an iam:PassRole permission as an inline policy to your SageMaker Notebook Execution Role:
{ "Version": "2012-10-17", "Statement": [ {
"Action": [
"iam:PassRole"
],
"Effect": "Allow",
"Resource": "<your sagemaker notebook execution role ARN">
}
]
}
Now that we have set up our Notebook and set up an IAM Role to run the walkthrough notebook, in the next section, we will create an Amazon S3 bucket.
Creating an Amazon S3 bucket
Follow the instructions documented in the Creating an Amazon S3 bucket, a folder, and uploading objects sub-section in the Setting up your AWS environment section of Chapter 2, Introducing Amazon Textract, to create your Amazon S3 bucket. If you created an S3 bucket in the previous sections, please reuse that bucket. For this chapter, you just need to create the S3 bucket; we will create the folders and upload the necessary objects directly from the notebook. Let's get started:
- Once you have the bucket's name, please type it in STEP 0 – CELL 1 of the notebook:
bucket = "<enter-S3-bucket-name>"
- Execute STEP 0 – CELL 1 of the notebook by clicking the Run button at the top menu of the notebook UI. Alternatively, you can press Shift + Enter to execute the cell. This will import the libraries we need, initialize their variables, and get our kernel ready for the next set of steps.
Now that we have created the S3 bucket and imported the libraries we need, let's extract the contents using Amazon Textract.
Extracting text using Amazon Textract
We will now continue executing the rest of the cells in the notebook to update the QuickSight manifest file with our bucket and prefix entries. The manifest file provides metadata for the QuickSight dataset to correctly import the content for visualization. Please see the documentation (https://docs.aws.amazon.com/quicksight/latest/user/create-a-data-set-s3.html) for more details. Let's get started:
- Execute STEP 1 – CELL 1 in the notebook to format the manifest file with the bucket and prefix names.
- Now, execute STEP 1 – CELL 2 to upload the formatted manifest file to the S3 bucket:
s3 = boto3.client('s3')
s3.upload_file(outfile,bucket,prefix+'/'+outfile)
- We will get the following output. Take a copy of the S3 location that is printed here as we will need it when we set up QuickSight:
Manifest file uploaded to: s3://<your-bucket-name>/chapter17/qsmani-formatted.json
- Now, execute STEP 2 – CELL 1 to install the Amazon Textract Response Parser (TRP) (https://github.com/aws-samples/amazon-textract-response-parser/blob/master/src-python/README.md), a helper library that provides you with an easy way to parse the JSON response from Textract:
!python -m pip install amazon-textract-response-parser
- Execute STEP 2 – CELL 2 to import the parser's Document class, which we need to initialize the boto3 handle for Textract.
- STEP 2 – CELL 3 does a few things, so let's examine it in parts. First, it searches the current directory for the presence of files ending with a .jpg extension. These are our input image files of the receipts. The following is one of these receipts:

Figure 17.1 – A sample handwritten receipt
- When they're found, the files are read one at a time and converted into bytearrays:
for docs in os.listdir('.'):
if docs.endswith('jpg'):
with open(docs, 'rb') as img:
img_test = img.read()
bytes_test = bytearray(img_test)
- Next, it calls the AnalyzeDocument Textract API and passes bytearray as an input, specifically looking for tables and forms from the input image. The Textract response is then parsed by the Textract Response Parser library and the results are stored in a variable. Then, we must loop through the results to get to the table and initialize a variable denoting the CSV file we will write to:
response = textract.analyze_document(Document={'Bytes': bytes_test}, FeatureTypes=['TABLES','FORMS'])
text = Document(response)
for page in text.pages:
for table in page.tables:
csvout = docs.replace('jpg','csv')
with open(csvout, 'w', newline='') as csvf:
- Finally, the individual cell values are written to the CSV file, along with the column headings by stripping spaces, if any, as well as the $ symbol, denoting the currency. Finally, the newly created CSV files are uploaded to the S3 bucket. This is repeated for each image file that's found in the input folder:
tab = csv.writer(csvf, delimiter=',')
for r, row in enumerate(table.rows):
csvrow = []
for c, cell in enumerate(row.cells):
if cell.text:
csvrow.append(cell.text.replace('$','').rstrip())
tab.writerow(csvrow)
s3.upload_file(csvout,bucket,prefix+'/dashboard/'+csvout)
- Execute STEP 2 – CELL 3 to complete the tasks outlined in the preceding steps. We will get the following output. Please make a note of the S3 location of the CSV files. The manifest file we formatted earlier contains these locations to allow QuickSight to upload these CSV files:
Extracted text from hw-receipt2.jpg
CSV file for document hw-receipt2.jpg uploaded to: s3://<s3-bucket-name>/chapter17/dashboard/hw-receipt2.csv
Extracted text from hw-receipt1.jpg
CSV file for document hw-receipt1.jpg uploaded to: s3://<s3-bucket-name>/chapter17/dashboard/hw-receipt1.csv
Note
You can also use Amazon A2I in this solution to set up a human loop to review the Textract outputs, as well as to make changes to the content as required, before creating the CSV files. For more details, please refer to Chapter 13, Improving the Accuracy of Document Processing Workflows, onward.
This concludes the steps from the notebook. Now, we will log into the AWS Management Console to set up QuickSight for visualization.
Visualizing insights using Amazon QuickSight
First, we need to enable QuickSight for your AWS account before we can import the data and run the visualizations. Please execute the following steps to proceed:
- Log into AWS Management Console (refer to the Technical requirements section if you don't have access to the AWS Management Console) and type QuickSight in the services search bar at the top center of the page. Click QuickSight from the results to be navigated to the QuickSight registration page.
- Enter your email address and click Continue:

Figure 17.2 – Registering for QuickSight
- Once you've logged in, click Datasets on the left pane and click the New dataset button at the top right:

Figure 17.3 – New dataset
- Click on S3 on the Datasets page:

Figure 17.4 – S3
- In the popup that appears, for Data source name, type handwritten-receipts. In the Upload a manifest file input area, copy and paste the S3 location that was printed in the Jupyter notebook in STEP 1 – CELL 2. Then, click on Connect:

Figure 17.5 – Specifying the S3 manifest file
- Once the dataset has been imported, click the Visualize button at the bottom right of the popup to open the QuickSight console. In the console, you should see a small popup that displays the import status. Verify that the import was successful. If you see errors at this stage, verify the contents of the CSV file to ensure there are no issues. These should be available in the S3 bucket in the Chapter17/dashboard prefix:
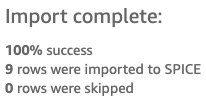
Figure 17.6 – Dataset import successful
- You should see the column names from the CSV file displayed to the left, under Fields list. You should see a center pane with space for a graph named AutoGraph. When you add fields from the list on the left, QuickSight automatically creates the appropriate graph based on your data.
- For our use case, we will create a pie chart and a donut chart to visualize the quantity of furniture that's been ordered and how much it cost us. Under the Visual types section on the left, click on the symbol for the pie chart and add fields from Fields list to the chart, as shown here:

Figure 17.7 – Visualizing furniture quantities across types
- Now, let's add a new visual to this dashboard. Click on Add at the top left and select Add visual:
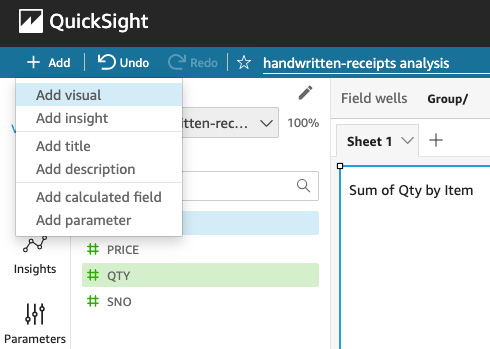
Figure 17.8 – Add visual
- Now, add a donut chart to display the total costs and cost by furniture type, as shown in the following screenshot. Begin by selecting the donut visual in the Visual types section on the left, select ITEM and PRICE, and then add them to the Group/Color and Value fields:
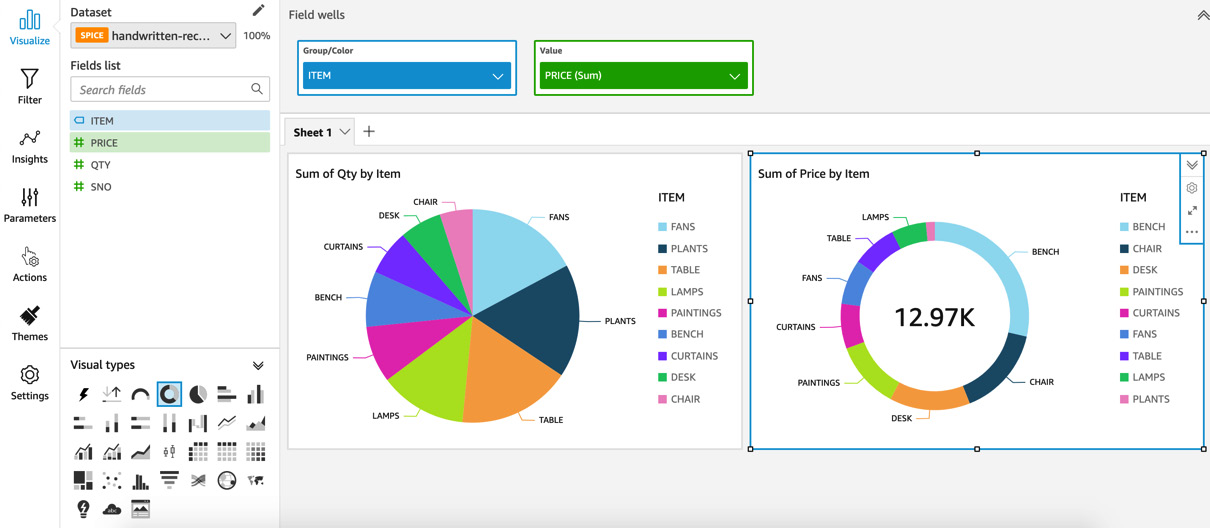
Figure 17.9 – Donut chart for visualizing the total costs and cost by furniture type
- Click on the Insights option on the middle left of the console to display the insights that QuickSight was able to gather from our data:
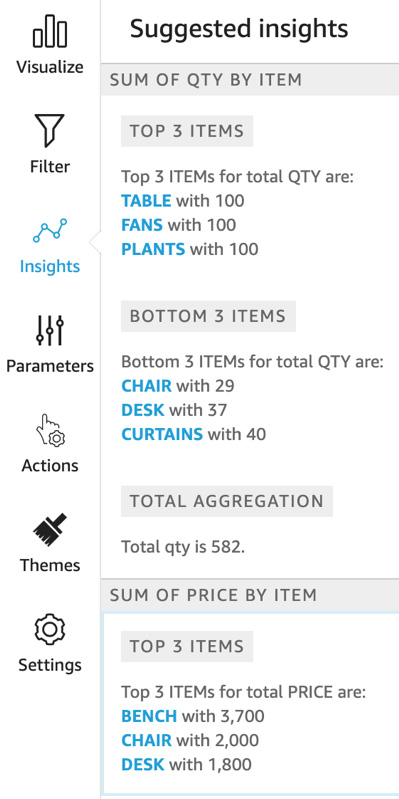
Figure 17.10 – QuickSight insights from our data
It is as simple as that. Feel free to try out the other visual types, as well as ML-powered forecasting and insights. For more details, please refer to the following documentation: https://docs.aws.amazon.com/quicksight/latest/user/making-data-driven-decisions-with-ml-in-quicksight.html. You can set up, share, publish, or export your dashboard for consumption by your management and other stakeholders. And that concludes the solution build for this use case.
Summary
We have just scratched the surface with what we can do with written text with this use case – the possibilities are truly endless! With just a few steps, by leveraging the advanced AI capabilities offered by services such as Amazon Textract, and the serverless scalable visualization offered by Amazon QuickSight, we were able to create powerful visuals from content scribbled on a piece of paper.
We began by creating the SageMaker Jupyter notebook instance we needed for this solution, cloned the GitHub repository for this chapter, created an S3 bucket, and executed the steps in the notebook to format the QuickSight S3 manifest file. Then, we used Amazon Textract and the Textract Response Parser library to read the contents of the handwritten receipts before creating CSV files that were uploaded to the S3 bucket. We concluded the notebook after executing these steps and then logged into the AWS Management Console and registered to use Amazon QuickSight.
In QuickSight, we imported the S3 dataset, which comprised our CSV files, and created two visuals and an insight. The first visual was a pie chart that showed the items that have been ordered against their quantities, while the second visual was a donut chart that showed the total cost of the two receipts, along with the cost per item. Finally, we displayed the insights that QuickSight had automatically generated, giving us a summary of what it was able to read from our content. We briefly discussed how we can export or share the dashboard and QuickSight's ML-based insights. And that concluded our solution build for this chapter.
Based on the myriad of use cases we have covered in this book so far, you know how to solve mainstream challenges in NLP for you and your customers, and we did all this without the need to tune a hyperparameter or train a model from the ground up. Granted, we trained a few custom Comprehend models, but that was without the overhead of a traditional ML workflow.
In the next chapter, we will conclude this book, so we thought we would leave you with some best practices, techniques, and guidelines to keep in your back pocket as you navigate your career as an NLP and AI expert. We will talk about document pre-processing, post-processing, and other items to consider during solution design. We are almost there!