Interpretation of Oscilloscope Displays
Numerous examples throughout the text include an oscilloscope display to reveal the operational characteristics of the actual circuit. All of these figures are actual plotted outputs from a digitizing oscilloscope. Although much of the display output is similar to more familiar analog oscilloscopes, Figure A11.1 and the following descriptions will assist the reader who is unfamiliar with this type of equipment.
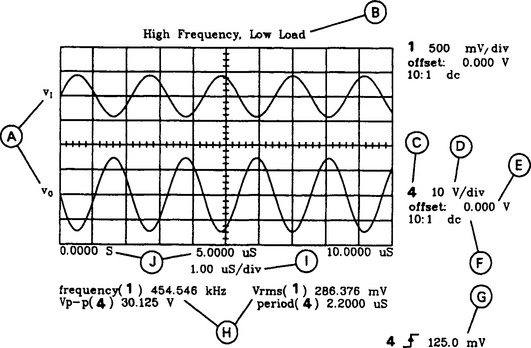
Each of the following headings describes the purpose of the corresponding item in Figure A11.1.
Item A. This is a reference to the schematic diagram. The annotations indicate where on the circuit each waveform was taken.
Item B. This annotation provides a brief description of the circuit conditions at the time of the measurements. Descriptions include such things as relative frequency, relative line voltage, or load conditions.
Item C. The oscilloscope is a four-channel device. That is, it is capable of displaying four different waveforms at the same time. The larger, bold numbers indicate which channel is associated with the subsequent parameter list.
Item D. This displays the vertical sensitivity of the indicated channel. It has the same meaning as the Volts/cm or Volts/Division parameter on an analog oscilloscope.
Item E. The offset specification indicates the amount of DC offset that has been set into the indicated channel. A positive offset has the effect of moving the waveform upward; a negative offset shifts the waveform downward. In either case, the amount of shift is established by the Volts/Division setting (Item D).
Item F. This ratio indicates the type of probe being used (e.g., 1:1 or 10:1). The attenuation effects of the probe are automatically accounted for in the display, so no mental arithmetic is required to obtain the correct answer. Additionally, the type of coupling (AC or DC) is displayed.
Item G. This portion of the display describes the trigger conditions. First, the larger, bold number indicates which channel served as the trigger source. Second, the arrow, pointing up or down on the rising or falling edge, respectively, indicates the slope of the trigger (i.e., positive or negative). Finally, the voltage value is the setting for the trigger level.
Item H. The lower portion of each display will vary depending on what characteristics of the displayed waveform are of interest. Each of the listed parameters will have a larger, bold number to indicate the channel reference. The remaining descriptive label and value are self-explanatory. Some example parameters include frequency, +width (positive pulse width), -width (negative pulse width), period, Vrms, Vavg, Vp-p, Vmin, Vmax, and so on.
Item I. This is the Time/Division setting for the horizontal sweep of the oscilloscope. It is interpreted in the same way as the Time/cm or Time/Division setting on an analog oscilloscope.
Item J. These labels simply indicate the relative time at various points across the screen (i.e., left, center, and right).
A few figures in the text (e.g., Figure 3.16) have some additional dashed lines superimposed on the oscilloscope display. These are used for measuring the time (horizontal) and voltage (vertical) between two points on the waveform. When the lines are visible, there are normally corresponding time and/or voltage parameters listed in the lower portion of the display (in the area indicated by item H in Figure A11.1). These additional parameters are each associated with a particular channel and include such measurements as these:
Vmarker1 indicates the voltage level represented by one of the horizontal dashed lines.
Vmarker2 is the voltage level of the second horizontal dashed line.
delta V is the difference in voltage between the levels of Vmarker2 and Vmarker1.
start marker is the time position (as indicated by item J in Figure A11.1) of one of the vertical dashed lines.
stop marker is the time position of the second vertical dashed line.
delta t is the difference in time between the setting of the stop marker and the start marker described.