
![]()
Measuring and Reporting on Your SharePoint Service Performance
Success is not permanent, and failure is not fatal.
—Mike Ditka
In this chapter, I cover how to take the pulse of your SharePoint service and measure its vitals against defined targets. To achieve this, I provide considerations for the types of metrics to measure that will indicate the overall health of your SharePoint environment and what thresholds to compare the measures against. To link the service metrics to a proactive service philosophy, I introduce the value and the process for conducting a root-cause analysis when the SharePoint service is trending negatively or an incident occurs that negatively affects availability.
After reading this chapter, you will know how to:
- Establish time targets
- Measure and report on performance and availability
- Plan your incident response
- Investigate an incident and perform a root-cause analysis
- Conduct retrospectives on incidents for proactive prevention
- Monitor and tune your service
Measuring and Reporting
You can capture a measurement on practically anything; however, you cannot measure everything. Some potential measures provide meaningful insights into the state of the service, while others are simply a piece of immaterial information. Some of your measures may be harder to quantify, while others are readily available. This is the challenge with determining what to measure and what to include in reports.
What people choose to measure is what they prioritize, whether this was what was measured and graded on in school or what contributes to one’s bonus at work. This is true for what I prioritize in SharePoint as well. The opposite is true too: when I do not have any measures then I might not know what to prioritize. If I do not have explicit measures to target or if the measures that I set are too vague or unclear, then this can lead to a situation where I feel as if I am constantly chasing incidents. To avoid this, you can use measurements to help focus attention on the priorities that matter the most.
On the other hand, measurements are not very useful if you do not do anything with them. Primarily, you need to know whether the measurement you capture is good or bad, and then you need to report this information so you can make decisions and respond to changing conditions. Reporting on the measurements is the second half to the equation, and the two go hand-in-hand. Essentially, measuring an aspect of the system captures the event, and reporting when it reaches a threshold raises potential issues to your attention.
If you have a measure and you want to report on it, you need to make it meaningful. You need a filter to only alert you to what needs your attention, and to filter out the rest. I like to establish thresholds, where if the measure is within a healthy threshold, a report or alert does not raise up to me and I can safely ignore it. This way, when a measure falls outside a healthy threshold, I will notice it and I can direct my attention to it. Throughout this chapter, I share some of the thresholds that I use in my measurements to filter out some of the noise in service monitoring and reporting.
I cannot stress this enough: one critical aspect of measuring and reporting for me is to filter out and ensure that the noise does not consume me. I do not want false positives or false alarms, and I do not want to be inundated with reports or alerts with such frequency that I begin to ignore them. I set thresholds so that only events that need to come to my attention do so. By minimizing any irrelevant noise, I stay focused on those measurements that affect the health of the SharePoint service.
You might base some measurements on processes or workflows, such as how long a service request sits in the queue or how long it takes to resolve an incident. I break out these measures into what I refer to as operational metrics, which involve processes in the service that are not completely system-automated. For those system-automated or system-contained processes, I refer to them as performance metrics that you can use to measure system performance levels.
One great aspect of the SharePoint platform is that it exposes many of the technology-related measurements that you might want to capture and report on. I come back to these measures later in the chapter in the section on performance metrics. In that section, I also discuss other tools to measure performance that you will find in the underlying infrastructure that supports SharePoint, and in particular, I focus on Performance Monitor in Windows Server 2012.
You can use all these ways to measure and report on different aspects of your SharePoint service to stabilize your SharePoint environment and maximize its availability. This is not just an academic exercise. Ultimately it lets you keep your finger on the pulse of your SharePoint service and it gives you early warning signs if its health is deteriorating. With those early warning signs, you can then respond with preventative or corrective actions, and this will help to keep your SharePoint service running stable.
Before I get too far into measuring and reporting, let me take a step back and look at your quintessential purpose to incorporating them into your SharePoint service measuring and reporting to maximize the service availability. At the end of the day, you want to maximize the availability of your SharePoint service, and for me, this is the main driver behind why I measure and report on different aspects of my SharePoint service. I come back to measuring and reporting later in this chapter, but first, let’s understand its purpose: let’s understand availability.
Understanding Your System’s Availability
In its simplest meaning as I use it in this book, availability relates to how available the system is for use. Is something preventing users from accessing their SharePoint site and interacting with it? If they have access, has their experience degraded below an acceptable level? If so, users are experiencing reduced system availability.
In the following sections, I give you suggestions on how to set targets for specific things that you can measure to understand what your availability is and how to monitor it. I like to think of these as early warning signs or early detection systems, something I put in place to see the overall availability of the service. It also allows me to respond quickly to events that interrupt service, such as when an event causes a measure to go outside the threshold for its healthy range. For me, I can only define availability in the context of thresholds.
You will face a trade-off when it comes to defining your availability targets. In an ideal and imaginary world, you would always be available and you could seamlessly handle any spikes in demand. In the real world, this aspiration might grow prohibitively expensive, and it could be an illusion you might never be able to achieve. The closer you get to 100% availability, the higher the price you will have to pay.
Even if you had an unlimited budget, could you even achieve 100% availability? I once heard this referred to as the fallacy of infinite availability. Some things are just beyond your control, such as the network beyond your data center. What if for political reasons or for censorship reasons, a foreign country decides to block the public Internet and instead the country runs its own private network? If its citizens were regular users of your system and who have then lost access to it, would you count this as a loss in availability?
Availability is complex. It may feel as if you have to achieve some minimal level of availability, because that is what the architecture diagrams look like on TechNet and that is how people talk at conferences, but it might be overkill for your situation and usage. I think that more availability is always better in the sense that it will meet the needs of end-users better, but it might not be better in the sense that if it costs more to achieve the higher availability than the value that the added availability produces, then it probably does not serve you well in the long run.
How available does your SharePoint service need to be? To answer this, you need to consider your tolerance for downtime and data loss. When you consider your tolerance for downtime, you might hear this referred to as the “nines” of availability. This refers to your percentage of availability and Table 6-1 lists common availability percentage levels along with their equivalent amounts of downtime per day, week, and year.
Table 6-1. Availability Percentage and Calculated Downtime Matrix
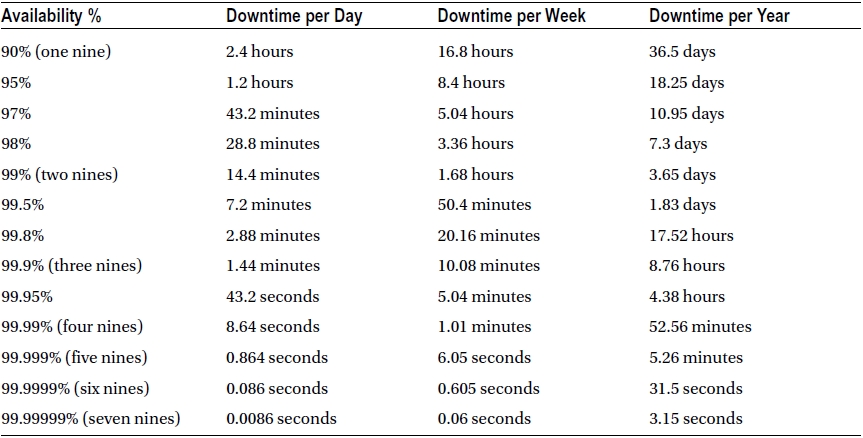
I like to break this down in several ways, rather than trying to define a single availability need. Primarily, I consider availability from two perspectives: normal operations and extenuating circumstances. I also like to divide availability requirements by service level or application. This gives me a tiered availability measure and it lets me adapt it to fit the situation.
During normal operations, you might face outages or reduced availability that relates to server or network failures, over utilized hardware, local area network issues, or similar problems. Your tolerance for these categories of downtime may be low, particularly during the peak hours of a workday. After hours, you may or may not have a greater tolerance, and as such, I often further divide the availability needs into peak versus non-peak times. I consult with some large retail customers whose availability needs are seasonal, where their tolerance for downtime significantly diminishes in the fall months. It is important to understand these different availability requirements so that you do not go overboard trying to achieve availability where you have no requirements driving you.
For extenuating circumstances, I consider these as larger scale incidents that affect availability, such as natural disasters, major acts of terrorism, or other catastrophes. I redefine the availability needs in light of these potential situations because often the availability requirements change or are different from those during normal operations. The organization may have more tolerance for downtime when there is a major outage that affects an entire region.
I live in Vancouver, Canada, on the West Coast of North America, which is along an area known as the Pacific Ring of Fire. We face a constant threat of natural disasters that we have to plan for here. I live near the Juan de Fuca Plate’s fault line, and although I hear most of our buildings can withstand earthquakes up to around a seven magnitude, if a major earthquake strikes, it will still cause a serious disruption. The Pacific Ocean to our west frequently experiences earthquakes on the ocean floor, and if one strikes with enough force, it will cause a tsunami. As if that was not enough, Vancouver is along the Cascade Mountain Range where to our north is Mount Garibaldi and to our south is Mount St. Helens – both are potentially active volcanoes.
My region may seem like a natural hazard zone, but other areas face other types of threats. When I consult with clients on the East Coast, they face different risks for natural disasters. Some of them have to plan for potential tornados, hurricanes, floods, ice storms, and the like. Every area seems to face risks for events that will interrupt availability. These events may also include political unrest, civil conflict, labor disputes, or a number of other causes beyond your control.
One solution you might consider for maintaining availability is to design geographic redundancy, where you replicate your data and services across multiple data centers located in different regions around the world. You might find a cloud provider that offers this type of hosting, or you might implement it yourself. However, just because you can does not mean that in every situation you must do this.
For example, if Vancouver has an incident that causes a wide scale loss of all connectivity and power, how much will I care if my timesheet application is unavailable while someone works to restore service? My tolerance for downtime is quite high for extenuating circumstances in my region. However, in my normal consulting operations, I need this timesheet application available at least occasionally throughout the month so that I can generate invoices. This is a simple example, but it illustrates how needs shift and how an organization’s downtime tolerance will vary depending on the situation. This is why you need to consider these different perspectives and your different service levels as you determine your availability requirements. Every situation is unique because every organization is unique.
I have done consulting work for a client whose deployment includes mobile data centers onboard Humvees, where they need to be available in a temporary location with a select cache of the data and with occasional connectivity to synchronize with a permanent or semi-permanent data center. My client wanted a constant and real-time connection between the permanent or semi-permanent data centers and the mobile data centers, but they only needed an occasional connection. As such, I would strive to maximize connectivity, but I met their availability requirements by ensuring at least occasional connectivity.
My point is that availability will vary, depending on the situation and other external factors. Your availability needs will also vary as you face those situations and as you weigh you tolerance for downtime against the cost to mitigate downtime. As you identify your availability needs and your tolerance levels, the next step is to establish thresholds. One useful threshold you can set is a time target, and because time is such a popular threshold to set for your targets, I discuss that in more depth in the next section.
Establishing Time Targets
There are different types of time targets you can use, depending on what you want to measure. Time targets are useful because time is a popular unit to measure and report on for different metrics. You could use response times, the duration an incident affects service, or the amount of processing within a period. You can apply time to measure and report on metrics in several ways.
Sometimes you might know exactly what time targets you want to set. For example, you might know that for the inner-farm network communication among the different SharePoint and SQL Server instances, your minimum supported latency time is eight milliseconds. You might set an optimum latency threshold target somewhere between one and two milliseconds, and if latency begins to trend beyond this time then your monitoring system will alert you.
Other times, you might find the time targets are much less prescriptive. Maybe you do not know how long something will take or what time targets you should strive to meet. What do you do then? I discussed some of these types of time targets in Chapter 2 when I looked at priority levels for service request tickets. As I indicated there, sometimes you have to set an initial time objective, and then adapt it as you learn more about how long things take. This is the equivalent of licking your finger and holding it up to judge the wind: it is not exact, but it will give you an indication and a place to start. It might be close enough that it works for you, or you might need to make adjustments later.
I usually start out with a time target that feels reasonable and achievable. At the same time, I do not want to treat them in the same fashion that corporate budgets can often feel like. That is, I avoid any measures that give an impression of arbitrary targets or any measures based on a blanket annual percentage increase. I try to ensure that the numbers are meaningful and that they directly relate to a service driver. I adapt the measure as needed to set appropriate expectations and to fit changes to their underlying driver.
Some questions I may ask myself to determine the target for a measure include the following:
- What is the ideal time to strive to reach?
- What is an acceptable or minimal time I can meet?
- What influences the amount of time something will take?
- Are there any exceptions to the time measure or targets?
With this information, I can begin to envision a range or a bearing to set the initial target. I may set a tentative target to review and revise later when I know more about the measure, but I do set a target to get started. You can apply time to many aspects of your service that you want to monitor, and you can combine it with other measures. In the following sections, I look at specific aspects you can measure, first for overall operational measures and then for system specific performance metrics.
Measuring and Reporting on Operational Metrics
In this category, I measure and report on operational aspects that support the SharePoint service. These aspects typically measure activities that involve human input, such as a person’s response time to a task. I also include other big picture system measures, such as the total amount of unplanned system downtime. The primary output for these measures report on the discipline and effectiveness of an operations team and their activities.
You might include different metrics that report on service requests, which can give you a good indicator for how well your users are receiving the SharePoint service you provide and how well your team is responding to user needs. Metrics that I find useful in this category include the following list:
- The current number of open service request tickets for the team or individual team member, grouped by priority or severity.
- A weekly count of the number of new service request tickets opened to report the historical trend.
- A weekly measure of the average time service request tickets remain open for the team and by team member, grouped by priority or severity.
- A weekly count of the number of service request tickets resolved within and outside the SLA objective for the team and by team member, grouped by priority or severity.
Reporting on unplanned system downtime and service request metrics provides valuable indicators for the health of a service and the maturity level of an operations team. For those tasks that surround responses to events or support requests, I like to categorize these as run activities when I measure them. I think of the other tasks that are more proactive in nature as investment activities, or those measures that invest in and will contribute to some aspect of the service in the future. Metrics I find useful in this investment category include the following list:
- A quarterly measure of the total number of training and readiness hours completed for the team and by team member.
- A quarterly measure of the number of usage audits and proactive health checks performed.
- The number of end-users who attend an internal training workshop during a period or the total number trained to date.
You may find other measures relevant for your organization as well. These are only a few examples that I find are the most useful. One point to keep in mind is that whatever measures you use and report on will become the priorities for your operations team. People focus their attention on what the team measures and reports. As such, this can be an effective approach to introduce change or to motivate new priorities across a team.
As you identify the operational areas that you want to measure, your next challenge becomes how to capture the actual measures and report on them. For some metrics, you may have a system that already monitors this information. For example, your service request ticketing system likely stores the tickets in a database that tracks whether or not a ticket is open, the priority or severity of the ticket, and whose support queue the ticket is in. The system likely also records timestamps for events such as when a user opens the ticket and when a support resource closes it.
Other measures may not be as readily available in a database. For example, if you do not have a learning management system, you may not have a database to query training data. One solution you might consider is to create a status report process for your team. You can use SharePoint 2013 and InfoPath forms to collect the status report data. Questions in the status report can relate to measures you want to capture, such as the number of training hours that a team member attends or the amount of proactive work they perform in a period. This can provide you with a data source for the data that you want to report on and monitor.
If you do gather operational data within SharePoint, you can build reports using the built-in web parts such as the Key Performance Indicator (KPI) web part. You can also query external systems by creating an external list through a Business Connectivity Services (BCS) model, and you can report on those metrics within SharePoint as well. You can create a scorecard or a dashboard within a SharePoint 2013 site that reports on the state and efficiency of the service operations team. You can also configure workflows and alerts within the SharePoint site to notify the appropriate people, such as to other managers or escalation engineers, when metrics begin to trend outside their target thresholds.
Monitoring an operations team helps you to identify whether any areas are heading off track or need attention. This provides a view into how effectively the team provides the SharePoint service and how proactively the team invests and prepares for future operations. To complement this information and provide the rest of the picture, I also capture the more transactional system-level performance metrics, which I discuss in the next section.
Measuring and Reporting on Performance Metrics
You can capture farm and system performance using built-in tools, such as the Windows Server 2012 Performance Monitor or the SQL Server 2012 Profiler. With these tools, you can capture performance levels and resource utilization levels of the servers at specified intervals. This gives you performance data for the different resource aspects that enable a SharePoint service to run.
There are many performance counters you can use to monitor performance, and which ones you choose will depend on the application load and the resource characteristics that you want to monitor. For example, when you want to measure CPU utilization, select the CPU counters. When you want to measure an application specific counter, such as the unhandled exception counter for ASP.NET applications, you can select one from a category that relates to your needs. Figure 6-1 provides an example of Performance Monitor graphing sample CPU and RAM counters.
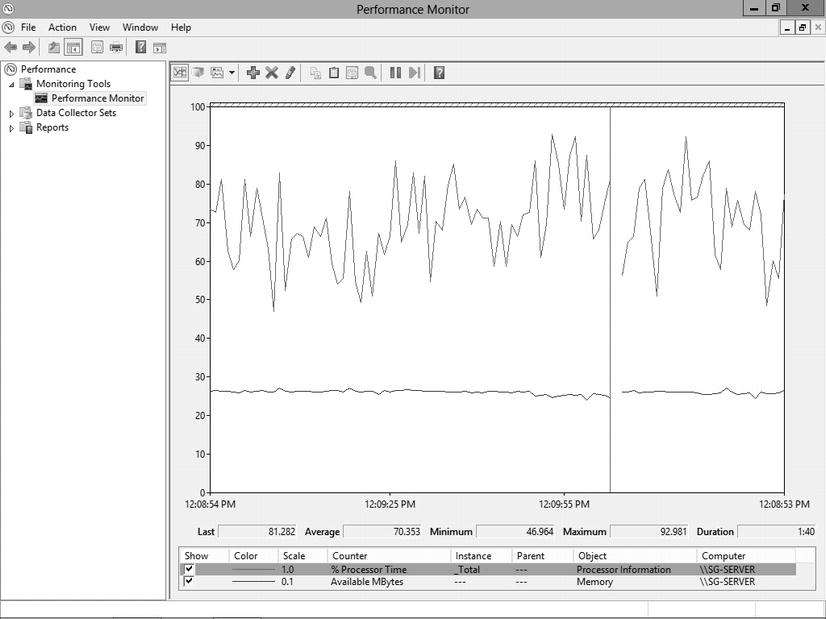
Figure 6-1. The Performance Monitor tool with sample graphs of CPU and RAM counters
In addition to connecting to a server using Performance Monitor, you can also use System Center 2012 Operations Manager or another type of operations management and monitoring software. If you use Operations Manager, you also need the System Center Management Pack for SharePoint Server 2013. This type of software can provide you with an end-to-end view of the performance across the servers and applications that make up your SharePoint service. If you are running your SharePoint farm using virtual servers, you might also have additional performance monitoring and analysis tools as part of your virtual machine management software.
![]() Note For more information on Microsoft System Center 2012 Operations Manager, please see the following TechNet site: http://technet.microsoft.com/hh205987
Note For more information on Microsoft System Center 2012 Operations Manager, please see the following TechNet site: http://technet.microsoft.com/hh205987
For our purposes, I am going to focus primarily on the monitoring and diagnostic tools that come with Windows Server 2012 or are typically available without additional licensing requirements. My goal here is to share techniques that you can use to assess the performance and health of your environment and to make those techniques relevant to everyone, and so I chose to focus on those tools that are available for the least common denominator. If you have other tools, you are welcome to adapt this guidance to fit your environment and your toolset.
![]() Note When you are using Performance Monitor to capture performance metrics on a server, you do not need to capture data constantly or even frequently. Capturing performance data can have a negative impact on your server’s performance because it is adding additional processing load. You can periodically capture performance data and still get valuable data to work with.
Note When you are using Performance Monitor to capture performance metrics on a server, you do not need to capture data constantly or even frequently. Capturing performance data can have a negative impact on your server’s performance because it is adding additional processing load. You can periodically capture performance data and still get valuable data to work with.
Table 6-2 lists the most common counters that I use in Performance Monitor to get a general state of health for a server. These counters capture the core resource areas, and these can help to quickly identify any bottlenecks or over-utilized components. As you can see, I focus on disk, memory, CPU, network, and some ASP.NET specific measures. Along with these counters, I also include their thresholds that I target as indicators to signal potentially over-utilized resources or bottlenecks. Once a measure goes beyond its threshold for any sustained period, I typically treat this as an indicator of a potential issue to investigate.
Table 6-2. Example Performance Counters with Sample Thresholds to Monitor
| Performance Counter Object | Target Threshold |
|---|---|
| Processor\% Processor Time\_Total | < 75% |
| SystemProcessor Queue Length(N/A) | < # of CPUs x 2 |
| MemoryAvailable Mbytes(N/A) | < 80% |
| MemoryPages/sec(N/A) | < 100 |
| PhysicalDisk\% Disk TimeDataDrive | < # of Disks x 2 |
| ASP.NET ApplicationsRequest/sec\_Total | Trends with sharp declines can indicate a problem |
| ASP.NETWorker Processes Restarts | Any number above zero can indicate problems exist |
| .NET CLR Memory\% Time in GC | < 25% |
| Logical DiskAvg. Disk Sec/Read | < 20 ms |
| Logical DiskAvg. Disk Sec/Write | < 20 ms |
| Logical DiskAverage Disk sec/Read | 1-4 ms for logs (ideally 1 ms on a cached array) |
| 4-20 ms (ideally below 10 ms) | |
| Logical DiskAverage Disk sec/Write | 1-4 ms for logs (ideally 1 ms on a cached array) |
| 4-20 ms (ideally below 10 ms) | |
| Logical DiskCurrent Disk Queue Length | < 20 |
| Logical DiskAverage Disk Reads/sec & | < 85% of disk capacity |
| Logical DiskAverage Disk Write/sec |
Another important performance measure is connectivity, or how much latency your users will experience when they try to load a SharePoint page from their location. You may have tools to monitor your network with a rich set of features that can analyze network latency for you, and this is probably the ideal. However, if you do not, you can still do manual tests and manually time a page’s load time. This may be as simple as using ping, where you open the command prompt and ping the servers from different areas of your network and then measure the response.
There are other web load testing tools that offer richer features than a ping from the command prompt, and depending on which tools you have access to, you might prefer one that offers scripting or automation capabilities. One tool I use is Visual Studio 2012 with the Web Performance and Load testing capabilities. I find this tool useful for latency tests as well as for simulating a load on the servers. Using this tool, I can stress test the SharePoint service by simulating a heavy user load from multiple network locations and then monitor how the servers respond. It also provides useful reporting capabilities on the characteristics of the load test.
![]() Note For more information on web performance and load testing in Visual Studio 2012, please see the following MSDN site: http://msdn.microsoft.com/dd293540
Note For more information on web performance and load testing in Visual Studio 2012, please see the following MSDN site: http://msdn.microsoft.com/dd293540
One valuable monitoring tool built in to SharePoint is the SharePoint Health Analyzer. This tool runs predefined rules at regularly scheduled intervals to evaluate the security, performance, configuration, and availability of the SharePoint farm. When the Health Analyzer detects a problem, it reports it in Central Administration and it provides guidance on how to correct the issue. You can even have a developer create your own custom rules for the Health Analyzer to evaluate and notify you when problems arise in those areas that your custom rules evaluate. Figure 6-2 shows a screenshot of the Site Collection Health Check Results report after analyzing the health of the site.
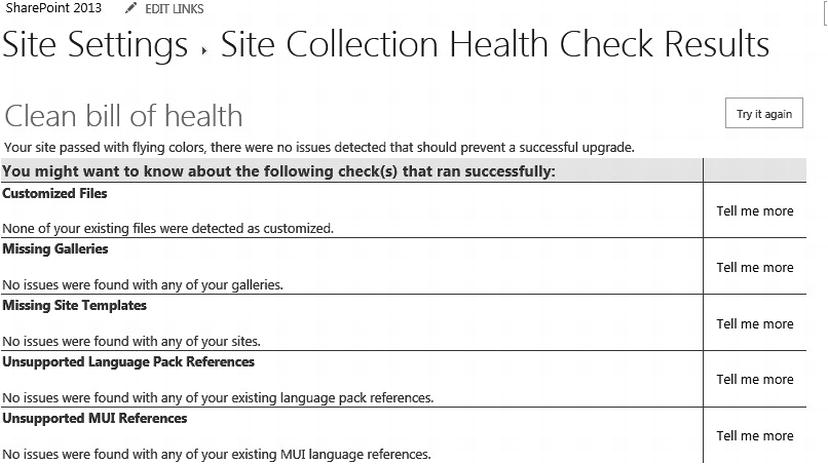
Figure 6-2. SharePoint Site Collection Health Check Results
![]() Note To learn more about creating a custom SharePoint Health Analyzer rule, please see a following blog post I wrote where I provide a sample: https://stevegoodyear.wordpress.com/2011/04/09
Note To learn more about creating a custom SharePoint Health Analyzer rule, please see a following blog post I wrote where I provide a sample: https://stevegoodyear.wordpress.com/2011/04/09
All these measures give you insight into how healthy your servers are, and by extension, how healthy your SharePoint service is. They can provide you with early warning signs to signal where problems are developing, and this allows you to proactively resolve an issue before it escalates. These measures can also provide historical information where you can trace growth or different events over time.
Unfortunately, even with extensive performance monitoring, you still might not catch a potential issue until it occurs. If an incident does arise, having a good performance monitoring process in place will help you identify it and respond to it quickly. Planning for an incident will help prepare you for an efficient response. In the next section, I build on the uses for the data I discussed capturing in this section and I look at how you can use this information to help you respond to an incident.
Planning Your Incident Response
At some point, things will go wrong, even with system health measurements and reports in place. How well you get through it will depend on how much you plan and prepare to respond to an incident. You do not necessarily need to plan every possible scenario, and you might not even create a detailed plan for your response, but having some sort idea for how you want to respond will help.
You might group types of incidents into general categories, such as regional disasters or server hardware failures. One option might be to associate these categories with the service levels and service request priorities that I discussed in Chapter 2. This way you can plan your response based on the tier of service and criticality of the incident. It is good to have this type of information available and to consider the criticality of different incidents for different service levels. Otherwise, every incident will feel like a high-pressured catastrophe, even the ones that are not.
At the very least, I find it useful to plan and make the following information available before an incident occurs:
- How and when do you communicate the incident to affected end-users?
- What other groups do you need to notify?
- How do you communicate the resolution progress or status updates?
- At what point do you escalate the incident and to whom?
- How do you identify what servers and services the incident affects?
- Who has service account and password information for the service?
- What is the latest backup available and how do you initiate a restore?
When this type of information is readily available, you will reduce your stress level when a serious incident occurs. When systems are down or you are in the middle of a major catastrophe, you need all the help you can get to take some of the pressure off and begin a response. You also need a systematic process to help keep everyone from over reacting.
In the heat of the moment, it can be difficult to stay objective and to assess the issue. People feel pressure to resolve the issue and return to normal operations, so much so that they often want to rush into a resolution. One trap with this is they can begin to chase symptoms, and multiple people can start making changes without anyone keeping track or coordinating the response. Chasing symptoms is not effective, and having multiple teammates searching the web and applying every idea that they find in random forums is dangerous and amateurish. Investigate and gather the facts of the incident first, and then take a step back to determine your resolution plan, especially when you are in a code red situation.
If you have captured measurements for some of the areas I noted earlier in this chapter, you can check this information for any clues. For example, if you are investigating a non-responsive server, you might check your performance reports and discover that the CPU utilization continued to increase until the server exhausted all available CPU resources. You might then correlate this with service schedules on the server and discover that an overlap of your backup job conflicted with the search crawl job, which consumed all available resources and left the server unresponsive.
Proactive measures and reports are incredibly valuable in reactive situations. This is why I designed the chapter this way where I included proactive and reactive topics together. As you plan your incident response, think about how you want to design your proactive measurements and reporting to help give you those types of clues when you need them. Every little bit of insight into an incident and what might be causing it will help you as you respond to an incident.
At this point, as you consider your incident response plan, picture the process you will adopt for a disciplined and systematic response. This can help you get through the situation without having excessive stress and panic blind you, and more importantly, it can help you avoid freezing like a deer caught in the headlights of an oncoming vehicle trying to decide what to do. The more rational and methodical you can remain as you work through an incident, the clearer your mind can work and the more open you are to potential solutions. You might consider some practices such as gathering a standard list of information you require and deciding on the types of notes that you want to take as you respond to an incident.
For any incident, I generally keep notes in Microsoft OneNote where I begin a detailed log of our response, capturing any information and assumptions as we progress. This, of course, helps to keep track of our progress, but it also helps me to stay objective and focused, rather than jumping around chasing symptoms. Gathering notes is a systematic process and it enforces a certain amount of discipline. The following lists the type of information I like to capture in my notes:
- Servers involved or affected by the incident
- Symptoms of the incident
- Any suspicions or assumptions on underlying causes
- Causes I rule out
- Any thoughts of things to investigate or verify
- People who get involved and when
- Every change I make
- Links to any sources I reference, such as blogs, message boards, or preferably, documentation
As I progress in a response and with my notes, I keep what I like to think of as a rolling resolution plan. While I collect intelligence and note ideas of potential solutions in my notes, I start thinking about an approach to test as a possible resolution. With details of the incident, I make a hypothesis for a potential resolution, note a resolution plan, and then attempt the resolution while noting the results. I call it a rolling resolution plan, because I continue this cycle until I reach an actual resolution to the incident.
I am generally a calm person, and I have been through a few high-pressure incidents now, so as a result I usually feel a level of confidence that I will get through the issue and find a resolution. I just stay focused on the process and trust that it will eventually lead to a resolution. One of my primary techniques is to use information to manage the pressure and avoid senses of panic. When I have preplanned and gathered good information, such as answers to some of the questions I noted earlier, then this helps me to remain levelheaded and focused on working through the incident. When I find myself deployed to respond to an incident where the team there did not preplan and gather this type of information, then I begin to gather it right away.
My initial response to an incident is to assess the situation. I do not look for blame, but other people involved may already be on the offense trying to divert blame. It is critical to keep everyone focused and to gather facts about the situation. When people get defensive or trend toward looking for blame, I stress that this is not the time to look at how things went wrong. In those moments, I only want to look at what is wrong and how I can resolve it. I can return later to investigate the cause during the root-cause analysis, which I discuss in the next section.
Approaching a Root-Cause Analysis
A root-cause analysis can transform your SharePoint service, just in the nature of going through the process and uncovering the root-cause of incidents. It is a thorough investigation into the underlying causes and everything involved in an incident. The process identifies all the contributing factors that led to the incident. It can also capture any of the symptoms or warning signs that failed to detect an issue as it developed.
The point of a root-cause analysis is not to find fault or to assign blame – it is not a witch-hunt. The point of it is to understand what went wrong so that you can prevent the issue from reoccurring in the future. You also go through the process to ensure that you identify and treat the actual problem rather than attack surface-level symptoms with hacks and patches. As you confirm a resolution to the underlying problem, you can also rest assured that you have not simply implemented a temporary fix and left the problem to reoccur at some point in the future.
Personally, I enjoy conducting root-cause analyses, because they feel like I am an investigator solving a mystery. I let my imagination turn it into a mystery to add excitement, because the process might be a little tedious in parts with reviewing logs and retracing events. These are all clues, pieces of the puzzle that will reveal more of the root-cause and all of its contributing factors. Investigating all those tedious areas will reveal the clues you need to solve the mystery.
It can be time consuming to gather all the information and extrapolate what went wrong, so it would not be practical to perform a root-cause analysis for every issue. I generally invest the time for an outage or a recurring issue, since taking a closer look at these issues will often provide the biggest return for improving the service. For the other types of issues or service requests, they are often more routine or less serious, so they do not warrant my investment of time for a closer investigation.
Similar to my process that I described in the previous section on planning your incident response, I ponder questions and take detailed notes as I work through a root-cause analysis. Some of the details I note do not provide any insights, but I capture as much as I can because some will end up offering clues that will eventually lead me to uncover the root cause of the issue. In my notes, I also like to capture all my assumptions and any questions that come to mind, because this helps me keep track and can lead to additional questions that I want to answer.
I start with trying to understand what went wrong, and part of acquiring this understanding is to build a timeline of the sequence of events. As I build this timeline and uncover additional events to add to the timeline, the picture builds with what happened leading up to the incident. Each event I can add to the timeline can lead me to more pieces of the puzzle, which eventually will lead me to a clear picture of the incident, and this will ultimately uncover its root-cause.
Some questions I try to answer or and use to build a timeline of events leading up to the incident include the following:
- What were the exact times when specific events occurred?
- What are all the scheduled tasks that run in the farm?
- What areas of the service did the incident affect?
- What were the specific servers or server issues involved?
- What were the symptoms of the incident?
- What errors do the Windows Event, System, and Application logs report?
- What errors or exceptions does the SharePoint 2013 ULS log report?
- What errors does the SQL Server Error Log report?
As I gather this type of data, I continue to build out the timeline of the incident and identify clues about its underlying cause. Logs can provide a great deal of information about where a problem originated, or at least when it first surfaced. They can also reveal patterns such as the occurrence frequency or what other errors occur as the timeline leads up to the incident. Logs give a historical record of events, but sometimes, depending on the problem you are troubleshooting, you need to augment them with a real-time view of events as you interact with an application. To address this, I use additional diagnostic and monitoring tools.
One tool available in SharePoint 2013 exposes a real-time view of logs and other request details as you load a page. This tool is the SharePoint Developer Dashboard, an instrumentation framework that provides diagnostic information for page components and the page execution lifecycle to assist developers and administrators troubleshoot issues. An administrator can easily overlook this resource and forget they have it in their toolbox, due mostly to its name. It certainly helps developers and the idea grew out of practices that developers use to debug their applications, but it also provides a wealth of insights for an administrator troubleshooting a page or the entire application.
I first mentioned the Developer Dashboard in Chapter 3, where I described some of the logs and tracing information available. Since it is short, I have repeated the PowerShell script again here that you can use to enable the Developer Dashboard. Run the following PowerShell script to add a button to your SharePoint pages, and then you can click the button and pop up a new window containing the Developer Dashboard.
$content = [Microsoft.SharePoint.Administration.SPWebService]::ContentService
$content.DeveloperDashboardSettings.DisplayLevel = [Microsoft.SharePoint.Administration.SPDeveloperDashboardLevel]::On
$content.DeveloperDashboardSettings.Update()
The Developer Dashboard is great, particularly for tracing SharePoint and ASP.NET events. I have a range of other tools I use to build on the information that the Developer Dashboard provides. Other diagnostic tools that I use include the following list.
- Microsoft Message Analyzer (Network Monitor): I use this tool to monitor server connectivity, the request/response communication between servers, and the data transferred on the network to identify any network or server communication issues.
- Windows Server 2012 Performance Monitor : I use this tool to monitor each of the servers in a SharePoint farm to understand how the servers utilize their resources and identify where bottlenecks exist.
- SQL Server 2012 Activity Monitor : I use this tool to monitor queries and processes executing on SQL Server to obtain information about how they may affect performance or availability.
- SQL Server 2012 Profiler : I use this tool to capture traces of queries and processes to analyze later.
- Internet Explorer Developer Tools : I use this tool to troubleshoot page components and to troubleshoot network or page request issues.
![]() Note For more information on Windows Server 2012 Performance Monitor, please see the following TechNet article: http://technet.microsoft.com/cc749249
Note For more information on Windows Server 2012 Performance Monitor, please see the following TechNet article: http://technet.microsoft.com/cc749249
With all of these tools and by working through this process of discovery, the information you gather should eventually provide enough clues to identify the root-cause of the incident. It reveals a ton of information about the farm and you may find this process is a useful exercise even if you have not experienced an incident. You might consider this type of analysis activity as a type of preventative health check for your SharePoint service, and I discuss this idea more in the “Consultant Comrade” section later in the chapter.
After I identify the root-cause and complete my investigation, I then prepare a Root-Cause Analysis Report. I use this to document the incident, what led to the incident, and the underlying issue or contributing factors. Most importantly though, I want to answer a single question: what corrective actions and changes will I implement to prevent the problem from reoccurring?
A Sample Root-Cause Analysis Report
In this section, I share an actual root-cause analysis from the wild. I performed this root-cause analysis several years ago in response to an outage. Although the incident itself was not major, it illustrates how useful the information can be that you get as an output from the process, even for a straightforward incident such as in this sample.
My team did not investigate every incident or every service request. Generally, I would only perform a root-cause analysis for major incidents that tier-one or tier-two support resources escalate to me. However, I would perform a root-cause analysis for every unplanned outage, whether or not there was an escalation to my team. This sample is the output report from my investigation of an unplanned outage, with the same headings and the same level of detail as the original report.
SharePoint Outage: Root-Cause Analysis
When did the Incident occur?
- Date & time of issue: September 26, 20XX 7:00 PM PST
- Locations(s) affected: Asia-Pacific Region
- Service request ticket number: N/A
- Time service was restored: September 26, 20XX 7:00 PM PST
What was the Incident?
- Issue description: AP-SPSQL exhausted all available disk space, resulting in SQL Server unable to grow any transaction logs. Therefore, SQL was not able to save data for the affected SharePoint sites.
- Business impact: Lost ability to save new data to SharePoint sites on AP-SharePoint that use AP-SPSQL as their database server (some of the SharePoint sites on this server use the HQ-ITSQL cluster as the database server for their content databases).
Why did the Incident occur?
- Root-cause: Database backup maintenance plans have failed since Nov 23, 20XX 12:00 AM PST due to insufficient disk space on drive E:, and as such the jobs were unable to back up and truncate any transaction logs. Disk space on drive F: (the drive that stores the log files) ran out of available space as the SQL transaction log grew until it exhausted all the drive’s space.
- Other contributing factors: N/A
How was the Incident resolved?
- Action taken to resolve the issue: Steve Goodyear performed a shrink database operation to shrink the largest databases to free up enough space to immediately restore full service. Following that, he performed a full backup of system and user databases to an available network share, he backed up and shrunk all the transaction logs, and he reallocated logs to available disks.
- Recommended changes moving forward: Steve Goodyear will engage the SQL DBA team to review SQL Server stability and ensure System Center monitoring of backups and disk space correctly sends alerts as a server reaches a threshold. Additionally, he recommends renewing the farm consolidation initiative to consolidate all these affected sites onto the more stable HQ-SharePoint farm and retire the AP-SharePoint farm.
Conducting a Retrospective on Incidents
After you conduct a root-cause analysis and produce a report based on the findings of your investigations, your next biggest learning opportunity comes from conducting a retrospective. A retrospective looks back on the events and considers what you might do differently next time or what processes you want to change.
Similar to the root-cause analysis, I like to conduct retrospectives without focusing on assigning blame. This is an opportunity to learn, and the goal is to learn to improve in the future. Assume that everyone is trying to do their best given the circumstances they face, and try to identify parts of the process that broke down rather than simply pointing blame at any individuals. For instance, perhaps the process broke down with assigning resources to the team without providing adequate training or direction, or perhaps the process lacked an adequate assessment of skills to match the right resource with the right role. Look past any individual resources and try to find something in the process that will improve the outcome next time.
Retrospective meetings held in person are the best approach to conducting a retrospective. When the team gathers to discuss the issues and brainstorm ways to improve, they work through it together. Mass e-mail chains just do not have the same effect, at least not in my experience. Video conferencing can help, but the idea is for the team to meet in person and work through the retrospective together.
A meeting needs to be timely, meaning you should schedule it close to the incident so that it is still on everyone’s mind, but not so close that the team has not had a chance to give it some thought. At the very least, I usually like to give a team a few days to read through and digest the root-cause analysis report before I conduct a retrospective. This also helps relieve any emotional connections or defensive feelings to the incident.
You need to set everyone’s expectations for the retrospective meeting, especially for the first retrospective you conduct. The team needs reassurance that it is not a witch-hunt, and that your goals are to improve processes in the future, which should help to make their jobs easier. Ahead of the meeting, possibly even in the meeting invite e-mail, establish the learning and improvement objective for the retrospective and ask all the participants to think about the incident to prepare for the retrospective.
One option you might consider is to create an anonymous survey before meeting for the retrospective to collect thoughts and concerns from the team. You can ask questions to everyone about what part of the process they feel broke down, reminding them to focus on the actual process and not on any individuals. This information can help spark discussions when you conduct the retrospective.
Some other questions I use to help spark discussion when I facilitate and conduct a retrospective include the following list. I like to work with the team to brainstorm answers for each of these questions, because they can provide valuable insights into what areas the team can improve for the future.
- What went well that we want to continue in the future?
- What areas were problematic or challenged that could have gone better?
- What caught us off guard or that we did not plan for having to address?
- What were frustrating experiences or moments?
- What were satisfying experiences or moments?
- How extensively did we define the roles and responsibilities?
- How clear were the project objectives and timelines?
- What could we have done differently to experience a better or more positive outcome?
Our meeting objective and ideal outcome from the retrospective meeting is to generate a prioritized list of action items that the team can use to implement change. These learning artifacts will help the team improve in the future and they will give the retrospective participants a feeling of accomplishment when they come out of the meeting with them.
As I indicated, a retrospective is not the place to shame or criticize any individual’s performance. This is about identifying those processes that are less than ideal and then looking at how you can improve them in the future. When a team member’s performance is inadequate, their supervisor is the appropriate channel to manage and discipline them, whether through a performance review or a one-on-one meeting. Another option might be to conduct a private meeting between the supervisor, the team member, and the project manager to review and discuss issues that are specific to the individual’s performance. You just need to keep it out of the retrospective meeting, because that is the place to go after processes, not individuals.
Most of my focus centered on responding to an incident, where something has gone wrong. You might also conduct regular retrospectives even if your team has not experienced a major incident or had a serious break down in its processes. You might conduct a monthly or quarterly team retrospective meeting, and use this as an opportunity to uncover risks or any potential issues before they escalate into an incident that derails the project or the ongoing operations.
Conducting regular retrospective meetings can also contribute to a culture of continuous improvement. It helps to build and strengthen teams as everyone regularly comes together to discuss ways to improve their shared processes. Team members grow encouraged to invest themselves into improving the team and its processes as they engage in retrospectives. It also reinforces the notion that you measure success by the success the team achieves, not simply by individual achievements, which is another reason you focus on processes and not on individuals during retrospectives.
With ongoing retrospectives, you can fine-tune your team’s processes regularly as the team grows and evolves. In the next section, I discuss other aspects that you can monitor and tune over time to maintain a healthy SharePoint service.
Monitoring and Tuning the Service over Time
In the sample root-cause analysis report I shared in an earlier section, you might notice that one of the changes I implemented to prevent the issue from reoccurring was setting an alert in the monitoring tool to notify the database team if the available disk space ran too low. Setting alarms for different thresholds is one way to apply the concepts from this chapter, and I recommend you do this. This will alert you as problems arise, often while they are still developing and before there is an interruption to the service.
Depending on the type of infrastructure management and monitoring software you use, you might be able to specify thresholds and create alarms within the tool you use. This provides you with an enterprise view into the system and a consistent way to manage notifications. If you do not have tools of this sort in your environment, you can look to achieve a similar goal of automatically notifying you when a condition deteriorates by using the tools you do have available. For example, SQL Server 2012 Alerts can monitor events and performance conditions for the database and the operating system, and when something matches a rule for an alert you define, the system can send an e-mail or pager notification to you.
This strategy allows you to set the criteria for when you want the system to notify you, allowing you to forget about it until a notification comes up. As a result, you do not have to check routine aspects of the system, those things you probably do not have time to check regularly anyways, but if something does come up then it will not fall through the cracks or end up getting missed. When you choose your thresholds for alerts, just choose ones that are relevant and that truly demand your attention so when they come up you can respond. For all other types where you are merely interested, choose a different monitoring strategy so it does not create noise and drown out your more important alerts.
For some monitoring of the service, including a web part that aggregates the information on a SharePoint page will do. By using a web part like this, then you will have the information available on demand, so whenever you are curious you can simply load the web part page. You can report on a lot of useful information here without creating an excessive amount of alerts or notifications when there is no urgency for your attention. When you design a combination of these two approaches, you get the best of both worlds.
Some aspects that I often want to monitor and set alarms for include the following list.
- I use a network utility to periodically ping the servers and trigger an alarm if a server is unreachable or unresponsive.
- I use a disk utility to monitor the amount of available disk space and trigger an alarm if a server runs below a predefined level.
- I use a backup utility to verify that backups complete successfully and trigger an alarm for any backup errors or failures.
- I use a database utility to run the SQL Server DBCC CheckDB command to verify the logical and physical integrity of each database and trigger an alarm for any corruptions.
So far, I looked at what you can monitor and respond to, but I also run other jobs to automatically tune different aspects of the service. To optimize the disk storage, I like to schedule the Windows Server 2012 Defragment and Optimize Drives utility to run periodically. I schedule this job during non-peak hours for every server in my SharePoint farm to keep all the disks optimized and defragmented.
![]() Note Modern versions of Windows Server offer the capability to schedule disk defragmentation, but if you have an earlier version without scheduling capabilities, then you can create your own schedule. For example, you can create a scheduled task to execute the following command to run the defrag utility on all disks: Defrag/C
Note Modern versions of Windows Server offer the capability to schedule disk defragmentation, but if you have an earlier version without scheduling capabilities, then you can create your own schedule. For example, you can create a scheduled task to execute the following command to run the defrag utility on all disks: Defrag/C
Another tuning job that I like to run regularly is to defragment the database indexes. In SQL Server 2012, I create a scheduled job to defragment and then rebuild the statistics for indexes in each database. Like the disk defragmentation, this helps to keep data organized in an optimized manner. It is like washing your dishes and then putting them back in the cupboard so they are easy to find when you are preparing your next meal. It keeps the database page files optimized on the disk so that SQL Server can quickly locate and access each one.
One aspect of the farm that I monitor is the size of content databases. I personally like many smaller content databases rather than fewer large databases. Smaller databases are easier to tune, quicker to backup and restore, and they reduce the surface of risk and exposure in the event of a database corruption. When I create new web applications, I typically create a few content databases so that SharePoint will use a round-robin process to create site collections in alternating content databases. This spreads out the data and is generally effective, but sometimes a content database can end up with a few site collections that are growing very large. In those cases, I prefer to break up the site collections and move them into multiple content databases manually.
![]() Note For more information on moving site collections to new content databases, please see the following TechNet article: http://technet.microsoft.com/cc825328
Note For more information on moving site collections to new content databases, please see the following TechNet article: http://technet.microsoft.com/cc825328
For most collaborative applications, I generally target a content database size of around 25-50GB. This is not a hard rule, but this is the range that I find I am the most comfortable with. I often make exceptions though, particularly for those content databases that archive content, such as archival or records repositories. For those, I have targeted sizes as large as 400-500GB. It depends on the application and your data needs. By default, I use the smaller size as a guide and make exceptions where they make sense.
This leads me to another database-related task to regularly perform: validate the backups. By this, I mean actually go through the process and attempt a restore to another test environment for each database in your farm. Ideally, I would like to do this once each quarter or at least semi-annually, but because it is a manual task it is easy to get lost in the pile when I get busy. It is important to go through and verify the process as well as the integrity of the backup as part of your routine preventative maintenance. Trust me, you will appreciate discovering issues at this point rather than when you are trying to recover from a disaster.
Patching is another routine manual task you need to plan and schedule. I include this as part of monitoring and tuning because you have to monitor the patch levels and when you apply a new patch, you are effectively tuning the farm. Whatever your change management process is, I hope at the very least it includes testing and applying regular security and other update patches to the environment.
![]() Note Please see Chapter 11 where I discuss other considerations to help you prepare for patching and apply service packs. Also see Chapter 16 where I discuss custom developed component testing and release processes that you can also apply to your process for testing patches and security updates.
Note Please see Chapter 11 where I discuss other considerations to help you prepare for patching and apply service packs. Also see Chapter 16 where I discuss custom developed component testing and release processes that you can also apply to your process for testing patches and security updates.
Finally, I also include archiving sites as part of the ongoing monitoring and turning activities. This can be a manual process, but it works best if you automate it. Content can grow so large that it will overwhelm you if you try to manually manage the process. In SharePoint 2013, you have the option to assign site policies to sites, and in the site policy, you can specify rules for deleting a site. For example, you can first configure the policy to set the site to a closed state after a given duration and then to delete the site after an additional given duration of time. With little effort, this policy configuration can address the rudimentary needs of those more basic sites that you want to simply dispose of after a given duration.
A basic site policy can be useful, but sometimes you might want to add more sophistication to your process. Perhaps you do not want to simply delete everything after some predetermined time elapses, and you need some automated way to inspect the content or assign tasks for people to review it. In these cases with more advanced requirements, site policies can still meet your needs by adding custom workflows in place of the simple delete option.
Rather than simply delete the site, you can assign a custom workflow to execute. The actions you develop within this workflow can include logic to check additional rules or to take additional actions with processing the content, such as moving certain pieces of content to the records repository and assigning tasks for users to review the remaining content before you delete it. You can even create a workflow action that will move the content to a designated archival area. In an archival area, you can store the content on cheaper disks and you can allocate fewer system resources for processing it.
![]() Note To learn more about site policies in SharePoint 2013, please see the following TechNet article: http://technet.microsoft.com/jj219569
Note To learn more about site policies in SharePoint 2013, please see the following TechNet article: http://technet.microsoft.com/jj219569
Consultant Comrade
Being a consultant, you have no doubt already caught on that clients often bring consultants in when things are not going well. I sometimes find myself on the first day arriving on site to discover and solve their problems. Sometimes I feel like I am The Wolf from the movie Pulp Fiction, where he says, “I’m Winston Wolfe; I solve problems.” Like him, I often engage with clients who need my help to clean up a mess they find themselves in, and like him, I solve problems – SharePoint problems.
My approach is one of the main reasons behind why I can be so effective at solving these problems, and I shared my methodical approach with you in this chapter. This approach works whether you are an IT administrator responding to an isolated SharePoint incident, or you are a consultant engaging with a client whose SharePoint environment has unraveled and has become problematic. The process identifies any underlying issues and any contributing causes, whether there is one or many, and it guides you to develop a resolution plan based on what you uncover.
You can use this process to investigate and audit a SharePoint deployment that has grown problematic over time. For example, if your client chose a chain of shortcuts and applied a series of hacks, and this eventually left them feeling stuck or painted in a corner, you can use the process in this chapter to get a complete picture of the situation. I find this can be a common scenario, as clients do the best they can with the limited information and experience they have. Now that they are aware of the long-term effects from some of their decisions and they are ready to get back on track, you can help them correct the sins of their SharePoint past.
I like to structure this type of engagement as a type of audit and analysis of my client’s current state. My main output and deliverable from the first phase of this engagement produces a root-cause analysis report, one similar to the sample I shared earlier in the chapter. I work through the process and analyze as many aspects of their SharePoint environment as I can, looking beyond the symptoms of what causes them pain, and instead looking down to identify the underlying issues and contributing causes. Once I identify the problems, I then move to document a resolution plan.
The final part to the report identifies all the changes I need to work through with my client to resolve the issues. Depending on the situation, this can be quite an extensive list. Therefore, I like to prioritize this list and address the more immediate needs first. There often will not be a quick fix, but there are usually immediate actions you can take to relieve some of the pressure. These will get your client on the road to recovery, and the rest will come as you get to them.
One example I relate this process with involves my chiropractor and my treatments with him. Years ago, I found myself travelling somewhere every week, and between the different hotel beds and the awkward seats on airplanes, my back developed some discomfort and what felt like a constant kink between my shoulder blades. To get my back healthy and comfortable again, I needed regular chiropractic treatments with adjustments to gradually get my back on track, but he relieved some of the pressure right away on my first treatment – although hearing the crack as he adjusted my back was not as pleasant as how I felt immediately afterward.
As you identify your client’s symptoms and their underlying causes for discomfort with their SharePoint environment, work with them to develop a resolution plan. Maybe they can take on many of the resolution action items on their own, but they will often need your help. You will want to write the resolution plan with as much detail as you can so that it will provide your client with direction on what they can do, and this is mostly so they head down the correct path and take the proper steps.
You do not need to hold back and horde information in hopes of forcing their dependence on you. This strategy simply does not work because you cannot solve all their problems on your own, and without the right information and direction, your client might make things worse. I encourage you toward a full disclosure and to offer your clients clear direction on what needs to be done, whether or not they engage you to do the work. This helps them budget and prioritize the resolution, and you will continue to be the expert that steered the ship back on course.
I find there is a lot of opportunity to engage with your clients in this process. It is not that everyone is doing it wrong or that SharePoint causes discomfort, not at all. Instead, this type of consulting engagement uncovers opportunities. Not everything has to be in a disaster zone, and usually it is not. Even if your client holds their environment together with duct tape, it is still working to some degree – SharePoint is surprisingly resilient. Your clients might want this type of engagement as part of a continuous improvement process to identify opportunities to improve, or they may simply want it to validate that everything is still on track and no issues have crept up. Whatever the motive, you can probably find some benefit that you can deliver your clients with this type of engagement.
Take a moment and consider your different clients and how this process can help them. Also, take a moment to consider how these types of engagements can benefit your consulting practice as well. You can find benefits in the follow-on resolution work, or in any number of other opportunities that you uncover through the process. Too often I find consulting firms just jump right to the big upgrade project as a magic bullet to start over and to try to simply pave over any problems, but you and your clients do not have to wait for the next version to help you merely mask problems. Better yet, if you go through this process and actually resolve the problems first, your upgrade will typically go smoothly and you can be confident that you are not simply delaying these problems.
Inside Story: Notes from the Field
I am quite passionate about conducting a root-cause analysis, as you can probably tell. Perhaps I just like the feeling of the investigation and solving the mystery about what went wrong, or perhaps I like the impact the process has on the stability and availability of the SharePoint service. It brings a level of discipline that seeks to resolve underlying issues rather than patch symptoms, and I like that. I like it most of all because as I treat the root-cause, I prevent other symptoms from coming up and I generally reduce the amount of reactive support that the service demands.
Just through the nature of incorporating a root-cause analysis in a team’s culture raises the bar. For me, it seems to transform how I operate and provide the service, because it focuses heavily on taking proactive actions: the corrective actions and changes I plan to implement to prevent the problem from reoccurring in the future. I find that this proactive nature also has a transforming effect on the SharePoint service itself – namely, the service becomes more stable as the operations team spends less time putting out fires.
In the root-cause analysis example I gave earlier in this chapter, this was one in a series of analyzing the root-cause of outages in our SharePoint farms. Usually, I would uncover issues beyond just what directly related to an incident, as I often find an incident is just the outcome from a series of operational process failures, whether they relate to monitoring or hardware planning or something else. In the case of the root-cause analysis sample in this chapter, I uncovered the monitoring process failures.
Several years ago, I used to work for Pepsi, a beverage company. One of our principles that we adopted was to always fix it right the first time, and we adopted this as part of an initiative to improve our customer service. We dispatched service technicians to repair equipment such as vending machines and soda fountain machines, and when we analyzed the data through business intelligence analytics, we found that technicians often repeated visits to a customer shortly after the initial visit, sometimes to re-address the same problem but more often to address a new problem. We found that by putting too much emphasis on resolving the reported issue as a measurement, we missed an opportunity to ensure no other problems were developing at a particular location.
With our focus on fixing it right the first time, we put an emphasis on looking beyond the reported problem and using the incident as an opportunity to be proactive and perform any preventative maintenance. Of course, we wanted to restore sales of cold soft drinks that day, but we also wanted to minimize the potential for another outage. It took an upfront time investment for our technicians to assess the equipment for any other potential issues and take proactive measures, but this paid off by saving more time later when we did not have to re-dispatch a technician to that same location. It also paid off in the increased availability of the equipment to sell cold soft drinks and the extra customer service we delivered.
This philosophy stuck with me. After I moved on from Pepsi, I continued to incorporate this philosophy into my other software development processes and into my IT operations processes. A few years later, when I joined Electronic Arts, a video game software company, I applied the principle to service outages as I began to fine-tune my root-cause analysis process. This little bit of background information also gets to the heart of what a root-cause analysis is for me: fixing it right the first time.
I always thought about writing a script that could assess common issues in a SharePoint farm, and for some aspects I did. I never got time to write an extensive health analyzing utility, so lucky for me the product team eventually built one into the product. I mentioned it earlier in the chapter, the SharePoint Health Analyzer, which automatically checks different aspects of the farm and draws your attention to potential problems. It also allows you to extend the rules by adding your own custom rules. I bring this up again here to mention that if I find myself responsible for a global multi-farm SharePoint deployment again, I would consider what long-term corrective actions I could create as custom rules to automatically test in my farms and to warn me if the problem is reoccurring. Automatic tests of these custom rules can be your insurance for the future, and you can delegate them for SharePoint to monitor for you. Fix it right the first time, and then automate a way to warn you if it is reoccurring.
GUEST Q & A: CHRIS IZQUIERDO, DEVFACTO
As I discussed governance with Chris Izquierdo, a SharePoint consulting and technology leader, he stressed two key aspects that are a part of his governance philosophy: you need a way to measure governance and you need a way to automate governance. When he addresses governance, he looks to establish a consistent framework that includes automated measures that he can report against a defined service, such as one covered by an SLA.
In his experience, governance plan documents with hundreds of pages of policies can often simply end up collecting dust on someone’s desk – a client pays for the document’s production without later realizing any of the benefits. For Chris, these governance plan policies are easily prescribed and somewhat standard, but they are not practical unless you apply them to the SharePoint service with some automated way to enforce them.
His advice is “what gets measured gets managed.” He finds that success comes from having a way to automatically measure and report on a service level’s effectiveness.
Chris Izquierdo is the CEO of DevFacto Technologies Inc., a SharePoint consulting firm based in Edmonton, Alberta, Canada. He has worked with SharePoint since 2001, starting as a developer and eventually moving into architecture and management. Over the last five years, he has concentrated on growing DevFacto to 70+ SharePoint consultants in Edmonton, Calgary, and Regina. To learn more about Chris, please see his company website: www.devfacto.com.
Wrapping Up
Throughout this chapter, I discussed techniques for monitoring and reporting on the health of your SharePoint service. I shared some sample metrics that I use to measure and what targets I typically set as thresholds to warn me about any potential problems or degrading levels of service. I then considered how you might use that information to proactively respond and tune your environment to avoid issues. From there, I looked at how you can respond to an incident if one occurs, and how to conduct a root-cause analysis to identify why it occurred. Finally, I discussed how to conduct a retrospective to learn from what went wrong and how you can avoid having it reoccur in the future.
Defining what your SharePoint service is will provide your team and your internal customers with a shared understanding about what the service provides, and it gives us something to set targets against and measure. This second part of the book covered broad topics such as how to define the service and the team that provides the service. With this information, you can set expectations about what needs your service will address and how it will operate. However, eventually new needs will arise, and when they do you need to expand your SharePoint service.
In the next part, chapters focus on topics related to expanding your SharePoint service for things such as adding new capabilities, handling demand for new features, and upgrading to new versions. I start in the next chapter with how to plan for an expanding service by creating a roadmap. A SharePoint roadmap will set the course for where you plan to take your SharePoint service, and when. This can help you manage expectations and pace the demand so that you can approach expanding your service in a methodical and appropriate manner.