Dummy variables are used when we are hoping to convert a categorical feature into a quantitative one. Remember that we have two types of categorical features: nominal and ordinal. Ordinal features have natural order among them, while nominal data does not.
Encoding qualitative (nominal) data using separate columns is called making dummy variables and it works by turning each unique category of a nominal column into its own column that is either true or false.
For example, if we had a column for someone's college major and we wished to plug that information into a linear or logistic regression, we couldn't because they only take in numbers! So, for each row, we had new columns that represent the single nominal column. In this case, we have four unique majors: computer science, engineering, business, and literature. We end up with three new columns (we omit computer science as it is not necessary):
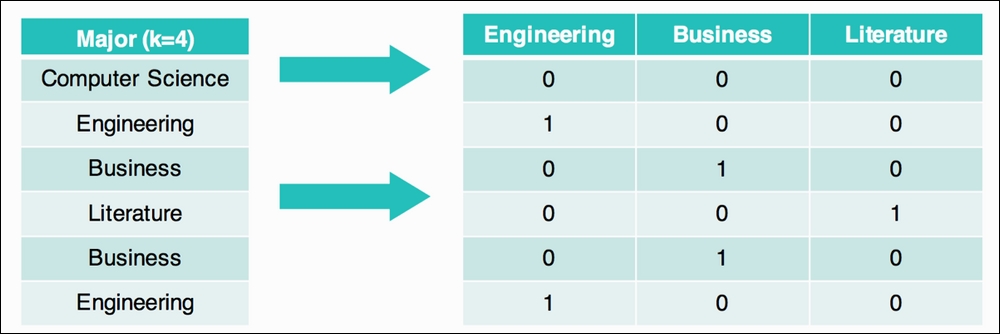
Note that the first row has a 0 in all of the columns, which means that this person did not major in engineering, did not major in business, and did not major in literature. The second person has a single 1 in the Engineering column as that is the major they studied.
In our bikes example, let's define a new column, called when_is_it, which is going to be one of the following four options:
MorningAfternoonRush_hourOff_hours
To do this, our approach will be to make a new column that is simply the hour of the day, use that column to determine when in the day it is, and explore whether or not we think that column might help us predict the above_daily column:
bikes['hour'] = bikes['datetime'].apply(lambda x:int(x[11]+x[12]))
# make a column that is just the hour of the day
bikes['hour'].head()
0 1 2 3
Great, now let's define a function that turns these hours into strings. For this example, let's define the hours between 5 and 11 as morning, between 11 a.m. and 4 p.m. as being afternoon, 4 and 6 as being rush hour, and everything else as being off hours:
# this function takes in an integer hour
# and outputs one of our four options
def when_is_it(hour):
    if hour >= 5 and hour < 11:
        return "morning"
    elif hour >= 11 and hour < 16:
        return "afternoon"
    elif hour >= 16 and hour < 18:
        return "rush_hour"
    else:
        return "off_hours"
Let's apply this function to our new hour column and make our brand new column, when_is_it:
bikes['when_is_it'] = bikes['hour'].apply(when_is_it)
bikes[['when_is_it', 'above_average']].head()
Following is the table:
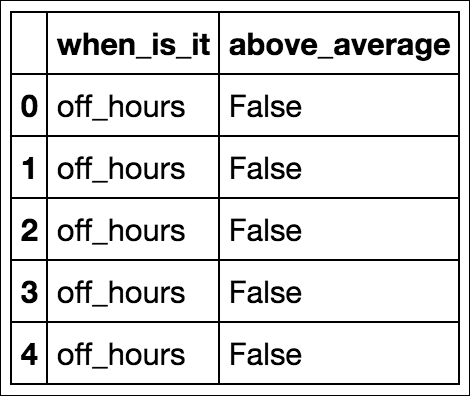
Let's try to use only this new column to determine whether or not the hourly bike rental count will be above average. Before we do, let's do the basics of exploratory data analysis and make a graph to see if we can visualize a difference between the four times of the day. Our graph will be a bar chart with one bar per time of the day. Each bar will represent the percentage of times that this time of the day had a greater than normal bike rental:
bikes.groupby('when_is_it').above_average.mean().plot(kind='bar') Following is the output:
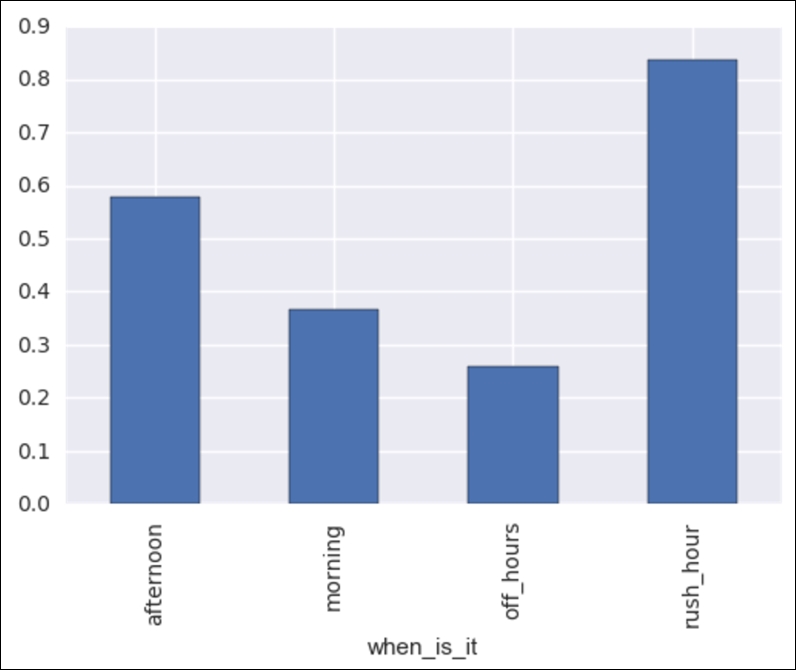
We can see that there is a pretty big difference! For example, when it is off hours, the chance of having more than average bike rentals is about 25%, whereas during rush hour, the chance of being above average is over 80%! Okay, this is exciting, but let's use some built-in pandas tools to extract dummy columns, as follows:
when_dummies = pd.get_dummies(bikes['when_is_it'], prefix='when__')
when_dummies.head()
Following is the output:
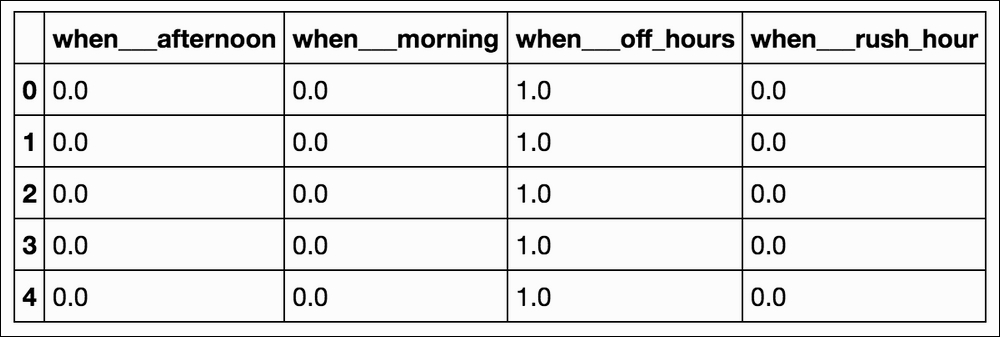
when_dummies = when_dummies.iloc[:, 1:]
# remove the first column
when_dummies.head()
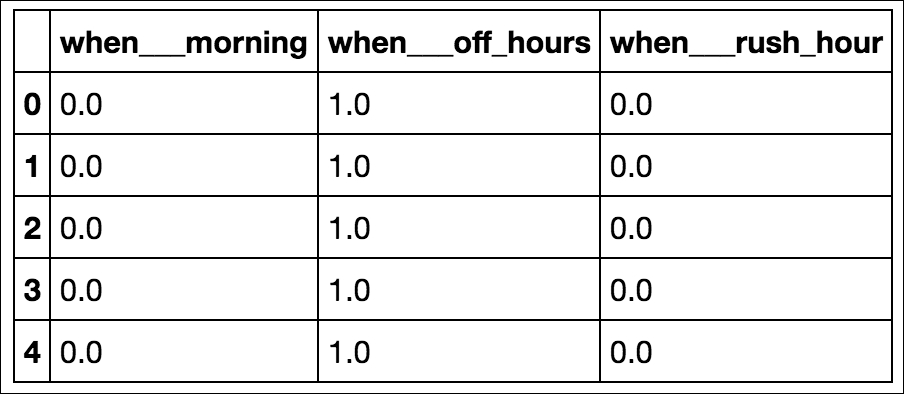
Great! Now we have a DataFrame full of numbers that we can plug in to our logistic regression:
X = when_dummies
# our new X is our dummy variables
y = bikes.above_average

logreg = LogisticRegression()
# instantiate our model

logreg.fit(X_train, y_train)
# fit our model to our training set

logreg.score(X_test, y_test)
# score it on our test set to get a better sense of out of sample performance

# 0.685157
This is even better than just using the temperature! What if we tacked temperature and humidity onto that? So, now we are using the temperature, humidity, and our time of day dummy variables to predict whether or not we will have higher than average bike rentals:
new_bike = pd.concat([bikes[['temp', 'humidity']], when_dummies], axis=1) # combine temperature, humidity, and the dummy variables X = new_bike # our new X is our dummy variables y = bikes.above_average X_train, X_test, y_train, y_test = train_test_split(X, y) logreg = LogisticRegression() # instantiate our model logreg.fit(X_train, y_train) # fit our model to our training set logreg.score(X_test, y_test) # score it on our test set to get a better sense of out of sample performance # 0.75165
Wow. Okay, let's quit while we're ahead.
