Before you can present any analysis or insight, you need data. Your sources could be in many places and in many formats. Nonetheless, you need to access them, look at them, select them, and quite possibly restructure them or clean them up to some extent. You may also need to join many separate data sources before you shape the data into a coherent model that you can use as the foundation for your dashboards and reports. The amazing thing is that you can do all of this using Power BI Desktop without needing any other tools or utilities.
Discovering, loading, cleaning, and modifying source data is one of the areas where Power BI Desktop really shines. It allows you to accomplish the following:
Although I have outlined these four steps as if they are completely separate and sequential, the reality is that they often blend into a single process. Indeed, there could be many occasions when you will examine the data after it has been loaded into Power BI Desktop—or clean datasets before you load them. The core objective will, however, always remain the same: find some data and then load it into Power BI Desktop where you can tweak, clean, and shape it.
This process could be described simplistically as “First, catch your data.” In the world of data warehousing, the specialists call it ETL
, which is short for
Extract, Transform, and Load
. Despite the reassuring confidence that the acronym brings, this process is rarely a smooth, logical progression through a clear-cut series of steps. The reality is often far messier than that. You may often find yourself importing some data, cleaning it, importing some more data from another source, combining the second dataset with the first one, removing some rows and columns, and then repeating many of these operations several times over.
In this and the following few chapters I will try to show you how the process can work in practice using Power BI Desktop. I hope that this will make the various steps that comprise an ETL process clearer. All I am asking is that you remain aware that the range of options that Power BI Desktop includes make it a multifaceted and tremendously capable tool. The science is to know which options to use. The art is to know when to use them.
The Power BI Desktop Query Editor
This chapter extends the data load process that you saw briefly in Chapter 1. In the previous chapter, you loaded data directly into Power BI Desktop—or more precisely, into the Power BI Desktop data model. In this chapter, you extend this approach with an additional step. You will, for some data sources, see how to load data into the Power BI Desktop Query Editor before adding it to the data model. This “detour” is the part of the process that allows you to cleanse and transform the data before it is added to the data model. Of course, if your data is perfect, then you can add it straight into the data model and start building reports. Indeed, if you are connecting to cleansed and structured corporate data, you may want to jump straight to Chapter 10 and learn how to create a data model. However, if your data needs any adjustment at all, then the Power BI Desktop Query Editor will likely soon become a trusted tool. Consequently, it is probably worth reading Chapters 2 through 9 that describe how to load data from a range of possible sources and then shape, modify, and structure your data so that it becomes a clear source of new and valuable insights.
As the first part of your journey through the data mashup process, this chapter will show you how to find and load data from a variety of file-based sources. These kinds of data are typically those that you can either locate on a shared network drive, download from the Internet, receive as an e-mail attachment, or copy to your computer’s local drive. The files that are used in the examples in this chapter are available on the Apress web site. If you have followed the download instructions in Appendix A, then these files will be in the C:PowerBIDesktopSamplesCH02 folder.
Data Sources
In the first chapter, you saw how quickly and easily you can load data into Power BI Desktop and create stunning dashboards. It is now time to take a wider look at the types of file-based data that Power BI Desktop can ingest and manipulate.
As the sheer wealth of possible data sources can seem overwhelming at first, Power BI Desktop groups potential data sources into the following categories
:
- File: Includes Excel files, CSV (comma-separated values) files, text files, JSON files, and XML files. Power BI Desktop can even load entire folders full of files.
- Database: A comprehensive collection of relational databases that are currently in the workplace and in the cloud, including (among others) MS Access, SQL Server, and Oracle. The full list of those available when this book went to press is given in the following chapter.
- Azure: This option lets you see an immense range of data types that is hosted in the Microsoft Cloud. This covers data formats from SQL Server through to big data sources. You can see how a few of these are used with Power BI Desktop in Chapter 5.
- Online services: These sources range from SharePoint lists to SalesForce, Dynamics 365 to Facebook—and many, many others. Some of these are examined in Chapter 5.
- Other: A considerable and ever-growing range of data sources, from Facebook to Microsoft Exchange. Some of these will be touched on in the course of the four chapters that cover accessing data in Power BI Desktop.
The list of possible data sources is changing all the time and you need to be aware that you have to look at the version of Power BI Desktop that you are using if you want an exhaustive list of the all available data sources that you can use. Indeed, I expect that several more will have been added by the time that you read this book.
You can also list the contents of folders on any available local disk, network share, or even in the cloud and then leverage this to import several files at once. Similarly (if you have the necessary permissions), you can list the databases and data available on the database servers you connect to. This way, Power BI Desktop can provide not only the data, but also the metadata—or data about data—that can help you to take a quick look at potential sources of data and only choose those that you really need.
Unfortunately, the sheer range of data sources from which Power BI Desktop can read data is such that we do not have space in a few chapters to examine the minutiae of every one. Consequently, we will take a rapid tour of some of the most frequently used data sources in this and the next few chapters. Fortunately, most of the data sources that Power BI Desktop can read are used in a similar way. This is because the Power BI Desktop interface does a wonderful job of making the arcane connection details as unobtrusive as possible. So even if you are faced with a data source that is not described in these chapters, you will nonetheless see a variety of techniques that can be applied to virtually any of the data sources that Power BI Desktop can connect to.
Note
The list of data sources that Power BI Desktop can access is growing all the time. Consequently, when you read this book you will probably find even more sources than those described in this and the next three chapters.
File Sources
Sending files across networks and over the Internet or via e-mail has become second nature to most of us. As long as the files that you have obtained conform to some of the widely recognized standards currently in use (of which you will learn more later), you should have little difficulty loading them into Power BI Desktop.
The file sources that Power BI Desktop can currently read and from which it can load data are given in Table 2-1.
Table 2-1.
File Sources
File Source | Comments |
|---|---|
Excel | Allows you to read Microsoft Excel files (versions 97 to 2016) and load worksheets, named ranges, and tables. |
CSV | Lets you load text files that conform to the CSV (comma-separated values) format. |
XML | Allows you to load data from XML files. |
Text | Lets you load text files using a variety of separators. |
folder | Lets you load the information about all the files in a folder. |
SharePoint folder | Allows you to list the files in a SharePoint folder. |
Access database | Lets you connect to a Microsoft Access file on your network and load queries and tables. |
JSON | Allows you to load data from JSON files. |
Note
I realize that Power BI Desktop
considers MS Access to be a database and not a “file” data type. While I completely agree with this classification, I prefer nonetheless to treat Access as if it were a file-based data source, given that all the data resides in a single file that can be copied and e-mailed, and not in a database on a distant server. For this reason, we will look at MS Access in this chapter, and not the next one that deals with corporate data sources.
Loading Data
It is time to start looking at the heavy-lifting aspect of Power BI Desktop and how you can use it to load data from a variety of different sources. I will begin on the bunny slopes with a simple example of “scraping” data
from a web page. Then, given the plethora of available data sources, and to give the process a clearer structure, we will load data from several of the ubiquitous file-based data sources that are found in most workplaces. These data sources are the basis of the data that you will learn to tweak and “mash up” in Chapters 6 through 8. This data could also become the basis of many of the dashboards that you will create in Chapters 14 to 22. These sources are as follows:
- CSV
- Text
- XML
- Excel
- Access
- JSON
You will see how to load multiple text or CSV files at once. To conclude the chapter, you will see how to store only the details about the files in a folder rather than the files themselves.
CSV Files
The scenario is as follows: you have been given a CSV file
containing a list of data. You now want to load this into Power BI Desktop so that you can look at the data and consider what needs to be done (if anything) to make it useable.
First, you need an idea of the data that you want to load. If you open the source file C:PowerBIDesktopSamplesCH02Countries.csv with a text editor, such as Notepad, you can view its contents. This is what you can see in Figure 2-1.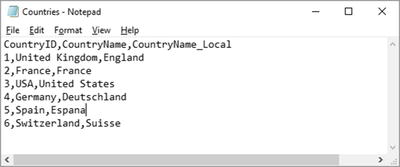
Figure 2-1.
The contents of the Countries.csv file
The following steps explain what you have to do to load the contents of this file into Power BI Desktop:
- 1.Open Power BI Desktop and close the splash screen.
- 2.In the Power BI Desktop Home ribbon, click the Get Data button (and not the small triangle that displays menu options).
- 3.Click File on the left. You will see something like Figure 2-2 (the Get Data dialog).
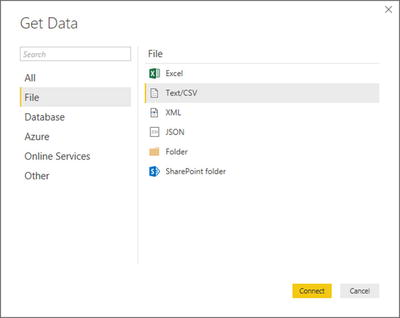 Figure 2-2.The contents of the Countries.csv file
 - 4.Click Text/CSV on the right of the dialog.
- 5.Click Connect. The Open dialog will appear.
- 6.Navigate to the folder containing the file that you want to load and select it (C:PowerBIDesktopSamplesCH02Countries.csv, in this example).
- 7.Click Open. A dialog will display the initial contents of the file, as shown in Figure 2-3.
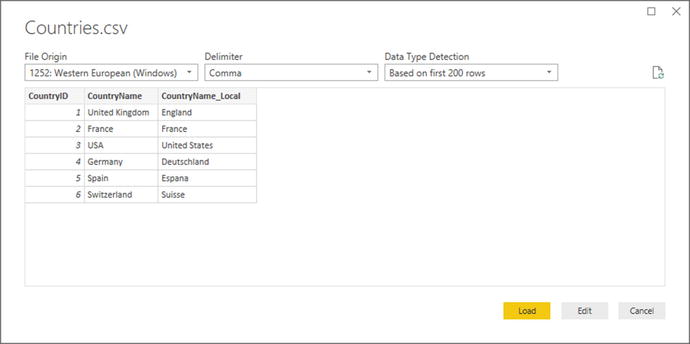 Figure 2-3.The Power BI Desktop file dialog
 - 8.Click the Edit button. The Power BI Desktop Query window appears; it contains a sample of the contents of the CSV file—or possibly the entire file if it is not too large. You can see this in Figure 2-4.
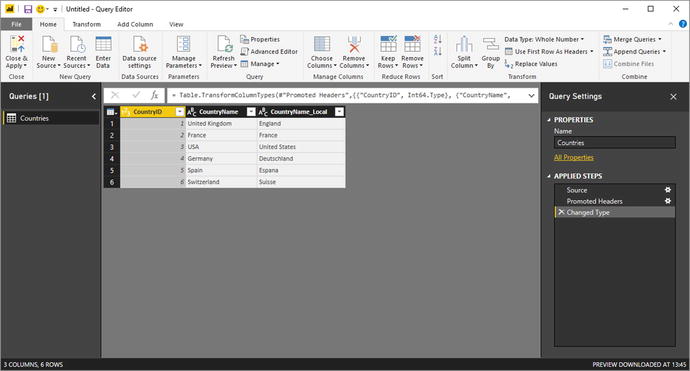 Figure 2-4.The Power BI Desktop Query window with the contents of a CSV file loaded
 - 9.Click the Close & Apply button in the Power BI Desktop Query window (you can see this at the top left in Figure 2-4). The Power BI Desktop Query Editor will close and return the focus to the Power BI Desktop window, where you can see that the Countries dataset appears in the Fields list on the right of the screen, as shown in Figure 2-5.
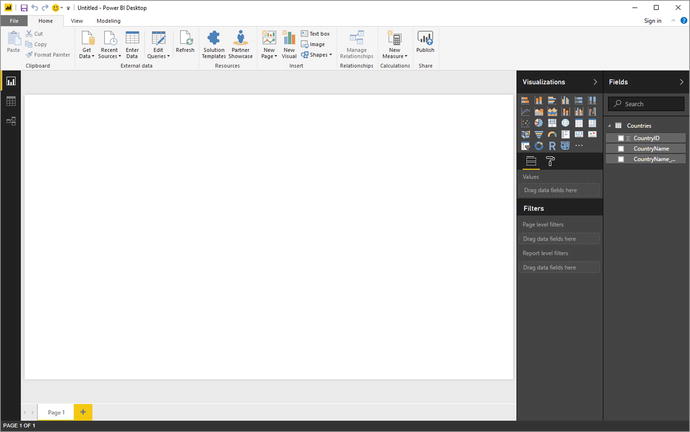 Figure 2-5.The Power BI Desktop Query window with a file loaded
And that, for the moment, is that. You have loaded the file into Power BI Desktop in a matter of a few clicks and it is ready for use in dashboards and reports. If necessary, you can expand the Countries dataset and then see the fields that this dataset contains—just as they were in the dialog shown in Figure 2-3.
In later chapters, you will learn how to shape this data. For the moment, however, let’s continue looking at some other file-based data sources.
What Is a CSV File?
Before we move on to other file types, there are a few comments I need to make about CSV files. There is a technical specification of what a “true” CSV file is, but I won’t bore you with that. What’s more, many programs that generate CSV files do not always follow the definition exactly. What matters is that Power BI Desktop can handle text files that
- Have a .csv extension (it uses this by default to apply the right kind of processing).
- Use a comma to separate the elements in a row. This, too, is a default that can be overridden by selecting a delimiter from those in the dialog shown in Figure 2-3.
- End with a line feed, carriage return, or line feed/carriage return.
- Can, optionally, contain double quotes to encapsulate fields. These will be stripped out as part of the data load process. If there are double quotes, they do not have to appear for every field, nor even for every record in a field that can have occasionally inconsistent double quotes.
- Can contain “irregular” records; that is, rows that do not have every element found in a standard record. However, the first row (whether or not it contains titles) must cover every element found in all the remaining records in the list. Put simply, any other record can be shorter than the first one but cannot be longer.
- Do not contain anything other than the data itself. If the file contains header rows or footer rows that are not part of the data, then Power BI Desktop cannot load the dataset without further work. There are workarounds to this all-too-frequent problem; one is given in Chapter 6.
Note
Another way of accessing CSV files is to click Get Data ➤ File and select Text/CSV in the Get Data dialog.
Text Files
If you followed the process for loading a CSV file in the previous section, then you will find that loading a text file is virtually identical. This is not surprising. Both are text files and both should contain a single list of data. The following are the core differences:
- A text file can have something other than a comma to separate the elements in a list. You can specify the delimiter when defining the load step.
- A text file should normally have the extension .txt (though this, too, can be overridden).
- A text file must be perfectly formed; that is, every record (row) must have the same number of elements as every other record.
- A text file, too, must not contain anything other than the dataset if you want a flawless data load the first time.
- If a text file encounters difficulties, it should import the data as a single column that you can then try and split up into multiple columns, as described in Chapter 8.
Here, then, is how to load
a text file into Power BI Desktop:
- 1.In the Power BI Desktop ribbon, click Get Data ➤ Text/CSV. The Open dialog will be displayed.
- 2.Navigate to the folder containing the file and select the file(C:PowerBIDesktopSamplesCH02CountryList.txt, in this example).
- 3.Click Open. A dialog will display the initial contents of the file. You can, of course, double-click the file name rather than click Open. The dialog should look like the one in Figure 2-6.
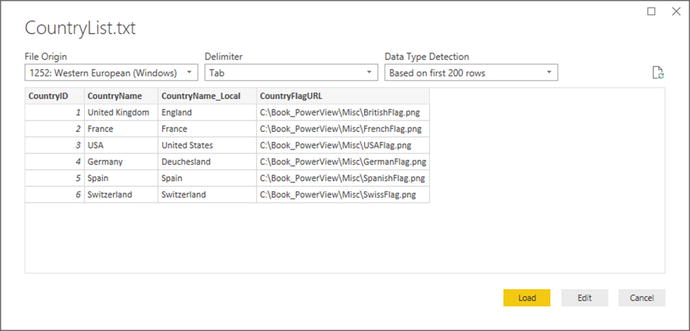 Figure 2-6.The contents of a text file ready for loading into Power BI Desktop
 - 4.Click the Cancel button (because after a quick look at the contents of the file, you have decided that you do not really need it).
Note
As text-based files (which include CSV files) are such a frequent source of data, you will nearly always see the Text/CSV option directly accessible in the popup menu that you access by clicking the small triangle in the Get Data button in the Home ribbon. If this option is not visible, you can instead select Get Data ➤ File and select Text/CSV, as you did previously.
Where Power BI Desktop is really clever is that it can make a very educated guess as to how the text file is structured; that is, it can nearly always guess the field separator (the character that isolates each element in a list from the other elements). And so not only will it break the list into columns, but it will also avoid importing the column separator. If it does not guess correctly, then don’t despair. You will learn how to correct this in Chapter 8.
Looking at the contents of a file and then deciding not to use it is part and parcel of the data discovery process
that you will find yourself using when you work with Power BI Desktop. The point of this exercise is to show you how easy it is to glance inside potential data sources and then decide whether to import them into the data model or not. Moreover, it can be easier to see the first few rows of large text or CSV files directly in the Load dialog of Power BI Desktop than it is to open the whole file in a text editor.
Tip
At the risk of stating the obvious, you can press Enter to accept a default choice in a dialog and press Esc to cancel out of the dialog.
Text and CSV Options
You can see in Figure 2-6 that there are few options available that you can tweak when loading text or CSV files. Most of the time Power BI Desktop will guess the correct settings for you. However, there could be times when you will need to adjust these parameters slightly. The potential options that you can modify are
- File Origin
- Delimiter
- Data Type Detection
File Origin
This option defines the character encoding in which the file is stored. Different character sets can handle differing ranges of characters, such as accents. Normally this information is correctly interpreted by Power BI Desktop, and you should only need to select a different character set (file origin) on very rare occasions.
Delimiter
Power BI Desktop will try and guess the special character that is used in a text or CSV file to separate the “columns” of data. Should you wish to override the chosen delimiter, you have the choice of:
- Colon
- Comma
- Equals sign
- Semicolon
- Space
- Tab character
You can also decide to enter a custom delimiter such as the pipe (|) character, or even specify that every field has a fixed width.
Data Type Detection
Power BI Desktop will make an educated guess at the data encoding that is used in a text or CSV file. By default, to save time, it will only read the first 200 records. However, you can choose from any of the following three options:
- Read the first 200 rows
- Read the entire file
- No data type detection
Note
Be warned that reading a large file in its entirety can take quite a while. However, without accurate data type detection, you risk seeing some weird characters in the data that you load.
XML Files
XML, or Extensible Markup Language, is a standard means of sending data between IT systems. Consequently, you likely will load an XML file one day. Although an XML file is just text, it is text that has been formatted in a very specific way, as you can see if you ever open an XML file in a text editor such as Notepad. Do the following to load an XML file:
- 1.In the Power BI Desktop ribbon, click the small triangle on the Get Data button, and then click More in the menu that appears. Next, in the Get Data dialog, select File and XML.
- 2.Click Connect. The Open dialog will appear.
- 3.Navigate to the folder containing the file and select the file(C:PowerBIDesktopSamplesCH02ColoursTable.xml, in this example).
- 4.Click Open. The Navigator dialog will open.
- 5.Click the Colours dataset in the left-hand pane of the Navigator dialog. The contents of this part of the XML file will be displayed on the right of the Navigator dialog, as shown in Figure 2-7.
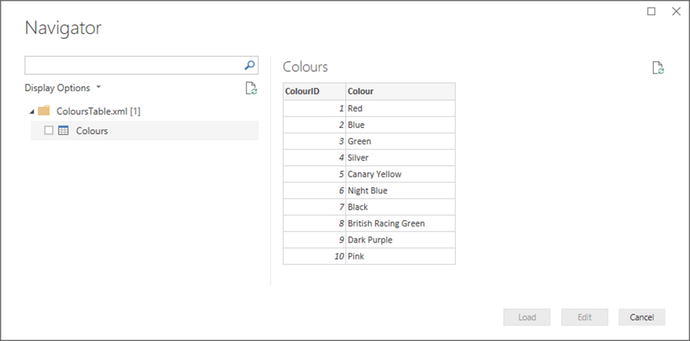 Figure 2-7.The Navigator dialog before loading an XML file
 - 6.Click the check box to the left of the Colors dataset on the left. The Load and Edit buttons will be enabled.
- 7.Click the Edit button. The Power BI Desktop Data window will display the contents of the XML file.
- 8.Click the Close and Apply button in the Power BI Desktop Data window. You will see that the Colors dataset appears in the Fields list on the right of the screen.
The actual internal format of an XML file can get extremely complex. Sometimes an XML file will contain only one dataset; sometimes it will contain many separate datasets. On other occasions, it will contain one dataset whose records contain nested levels of data that you need to handle by expanding a hierarchy of elements. You will see how the Navigator dialog handles nested hierarchies of data in the following chapter in the context of database sources.
Note
Certain types of data source allow you to load multiple sets of data simultaneously. XML files
(unlike CSV and text files) can contain multiple independent datasets. You can load several datasets simultaneously by selecting the check box to the left of each dataset that you want to load from the XML file.
Excel Files
You are probably already a major Excel user
and have many, many spreadsheets full of data that you want to rationalize and use for analysis and presentation in Power BI Desktop. So, let’s see how to load the contents of an Excel file.
- 1.In the Power BI Desktop ribbon, click the small triangle at the bottom of the Get Data button and then click Excel. The Open dialog will appear.
- 2.Navigate to the directory containing the file that you want to look at(C:PowerBIDesktopSamplesCH02, in this example).
- 3.Select the source file (InvoicesAndInvoiceLines.xlsx, in this example) and click OK. The Navigator dialog will appear, showing the worksheets, tables, and ranges in the workbook file, as shown in Figure 2-8.
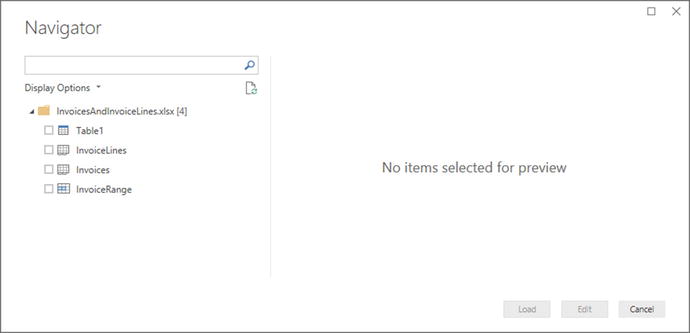 Figure 2-8.The Navigator dialog before loading data from an Excel workbook
 - 4.Click one of the datasets listed on the left of the Navigator dialog. The top few rows of the selected spreadsheet will appear on the right of the dialog to show you what the data in the chosen dataset looks like.
- 5.Click the check boxes to the left of the Invoices and InvoiceLines datasets on the left.
- 6.Click Load. The selected worksheets will be loaded into the Power BI Desktop data model and will appear in the Fields list in the Report window.
As you can see from this simple example, having Power BI Desktop
read Excel data is really not difficult. You could have edited this data in Power BI Desktop Query Editor before loading it, but as the data seemed clean and ready to use, I preferred to load it straight into Power BI Desktop (or rather the Power BI Desktop data model). As well, you saw that Power BI Desktop can load multiple datasets at the same time from a single data source. However, you might still be wondering about a couple of things that you saw during this process, so here are some anticipatory comments:
The Navigator dialog displays
Each of these elements is represented by a different icon in the Navigator dialog. Sometimes these can, in effect, be duplicate references to the same data, so you should really use the most precise data source that you can. For instance, I advise using a named table or a range name rather than a worksheet source, as the latter could easily end up containing “noise” data (that is, data from outside the rows and columns that interest you), which would make the load process more complex than it really needs to be. Indeed, unless a worksheet is prepared and structured, ready for loading into Power BI Desktop, you could end up with superfluous data in your data model.
Note
Power BI Desktop will list and use data connections to external data sources (such as SQL Server, Oracle, or SQL Server Analysis Services) in a source Excel workbook if the data connection is active and has returned data to the workbook. Once a link to Power BI Desktop has been established, you can delete the data table itself in the source Excel workbook—and still load the data over the data connection in the source workbook into Power BI Desktop.
Power BI Desktop will not take into account any data filters on an Excel data table, but will load all the data that is in the source table. Consequently, you will have to reapply any filters (of which you’ll learn more in chapter 6) in Power BI Desktop if you want to subset the source data.
Importing Excel and Power View Items
Power BI Desktop is not the first incarnation of Power BI; the data model that it uses has been around for some years now. So, you may already be an accomplished Power View expert using Power View for Excel—or you may have advanced data models that you have built using Power Pivot in Excel that you want to transfer into Power BI Desktop.
Fortunately, the team at Microsoft has thought of this, and the result is that you can transfer all your effort from Excel (Power View dashboards, Power Pivot data models, and DAX metrics) into Power BI Desktop with remarkable ease. Here is how:
- 1.Open a new, blank Power BI Desktop file.
- 2.In the File menu, select Import ➤ Excel Workbook Contents, as shown in Figure 2-9.
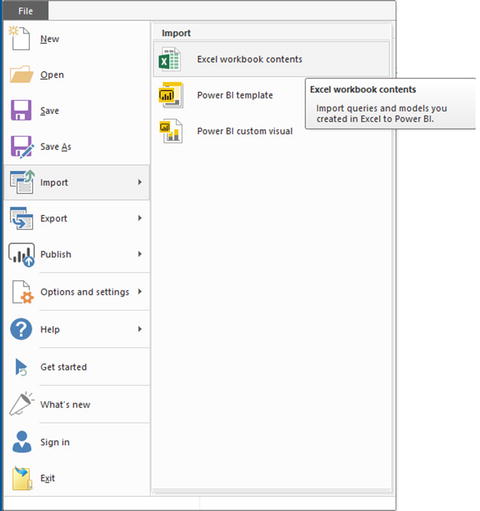 Figure 2-9.Importing existing Power View or Power Pivot items from Excel
 - 3.The Windows Open dialog appears, from which you can select an existing Excel file containing Power View or Power Pivot items. In this example, you can use the file CarSalesForPowerBI.xlsx from the sample files for this chapter.
- 4.Click Open.
- 5.Power BI Desktop will import any compatible items and display the import screen (as shown in Figure 2-10) during the import process.
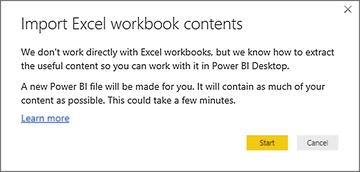 Figure 2-10.Importing Power View and Power Pivot elements from Excel
 - 6.Click Start. Power BI Desktop will begin to load and convert data and elements from Excel. Indeed, you could see further specific questions. Then the import will continue, showing the progress dialog that you see in Figure 2-11.
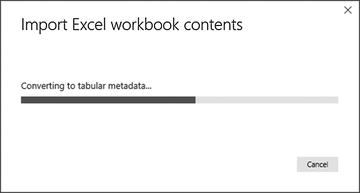 Figure 2-11.The import progress dialog
 - 7.Once the import process has successfully finished, Power BI Desktop will display the summary dialog that you see in Figure 2-12.
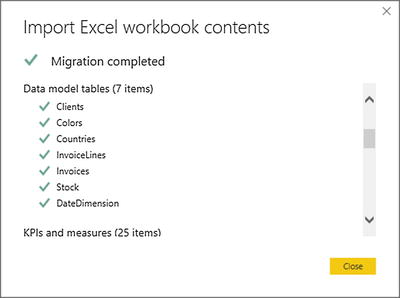 Figure 2-12.The import summary dialog
 - 8.Click Close. The items become a Power BI Desktop report.
As this book went to press
, there were a few aspects of some Power View visualizations that were not imported perfectly into the Power BI Desktop data model. However, as this technology is currently developing at a rapid pace, you could well find that these minor limitations have been resolved by the time that you read this book. In any case, I advise you to consult the Power BI web site for up-to-date details on any remaining limitations concerning the conversion of Excel objects to Power BI Desktop reports.
Microsoft Access Databases
Another well-used data repository that proliferates in many corporations today is Microsoft Access. It is a powerful desktop relational database and can contain hundreds of tables, each containing millions of records. So we need to see how to load data from this particular source. Moreover, Power BI Desktop can be particularly useful when handling Access data because it allows you to see the contents of Access databases without even having to install Access itself.
- 1.In the Power BI Desktop ribbon, click Get Data ➤ More ➤ Database and select Access Database in the Get Data dialog.
- 2.Click Connect and navigate to the MS Access database containing the data that you want to load (C:PowerBIDesktopSamplesCH02ClientsDatabase.accdb, in this example).
- 3.Select the Access file and click OK. The Navigator dialog appears; it lists all the tables and queries in the Access database.
- 4.Check the check box for the ClientList dataset. This displays the contents of the table, as you can see in Figure 2-13.
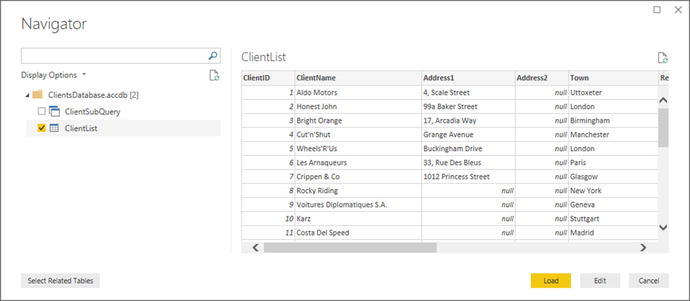 Figure 2-13.The Navigator dialog before loading data from an Access database
 - 5.Click Load. The Power BI Desktop window opens and displays the table in the Fields list in the Report window.
If you look closely at the left of the Navigator dialog in Figure 2-13, you can see that it displays two different icons for Access objects:
- A table for Access data tables
- Two small windows for Access queries
This can help you to understand the type of data that you are looking at inside the Access database.
Note
Power BI Desktop cannot see linked tables in Access, only imported tables or tables that are actually in the Access database. It can, however, read queries overlaid upon native, linked, or imported data.
JSON Files
More and more data is now being exchanged in a relatively new format called JSON. This stands for JavaScript Object Notation, and it is considered an efficient and lightweight way of transferring potentially large amounts of data.
Now, while Power BI Desktop can connect to JSON data files, these are not always instantly comprehensible. So be warned that, while this section will teach you how to connect to JSON data using Power BI Desktop, you will have to wait for Chapter 8 to see how this connection can be tweaked to convert it into meaningful information.
To connect to a JSON file
:
- 1.In the Power BI Desktop ribbon, click Get Data ➤ File and select JSON in the list of file sources on the right of the Get Data dialog. The dialog should look something like the one shown in Figure 2-14.
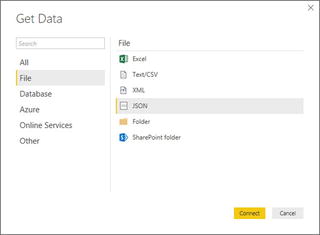 Figure 2-14.Establishing a JSON connection
 - 2.Click Connect and navigate to the folder containing the JSON file that you want to load (C:PowerBIDesktopSamplesCH02Colors.json, in this example). You can see this in Figure 2-15.
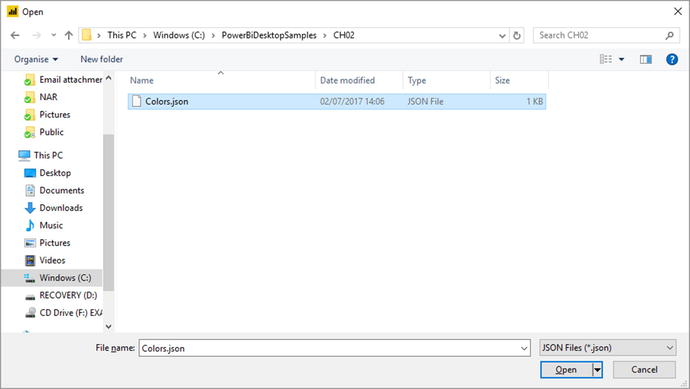 Figure 2-15.Opening a JSON file
 - 3.Click Open. The dialog will close and you will return to the Power BI Desktop window.
- 4.Click the Apply Changes button at the top of the Power BI Desktop window.
You will not yet see the data in Power BI Desktop. However, you will have established a connection to the JSON file that you can later convert into the underlying data. You will learn the next steps that are required to load JSON data in Chapter 8.
Loading Multiple Files from a Directory
On many occasions you could find yourself faced with a set of identical files that have to be loaded to make up a complete dataset. They could be a file for each day’s data, for instance, exported from an older system. As no one wants to load 365 files individually, the Power BI Desktop development team has come up with an answer to this kind of challenge. Provided that you gather all the source files into a single directory, you can load all the files at once.
Note
This approach requires that all the files in the source folder share an identical format. If this is not the case, you will probably not succeed in loading the data.
- 1.Open a new Power BI Desktop file.
- 2.Click Get Data ➤ File, and select Folder from the options on the right of the dialog. The Get Data dialog should look like the one shown in Figure 2-16.
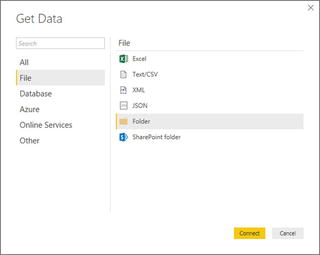 Figure 2-16.The Get Data dialog used to select multiple files from a folder
 - 3.Click Connect. The Folder dialog will appear.
- 4.Click the Browse button and navigate to the folder containing several identically structured text files (C:PowerBIDesktopSamplesCH02MultipleIdenticalFiles, in this example). The Folder dialog will look like the one shown in Figure 2-17.
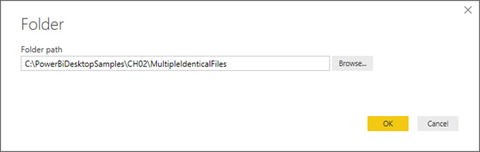 Figure 2-17.Selecting a folder
 - 5.Click OK. The contents of the folder will be displayed as you can see in Figure 2-18.
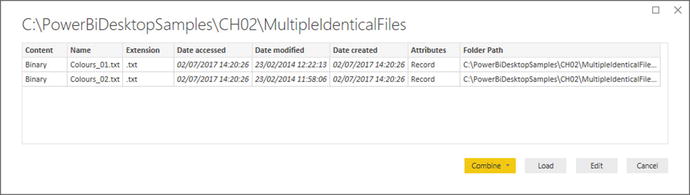 Figure 2-18.The contents of the selected folder
 - 6.Click Combine ➤ Combine and Load. The Combine Files dialog will appear.
- 7.Select one of the source files to serve as a model for the structure of all the files to load. The dialog should look like the one shown in Figure 2-19.
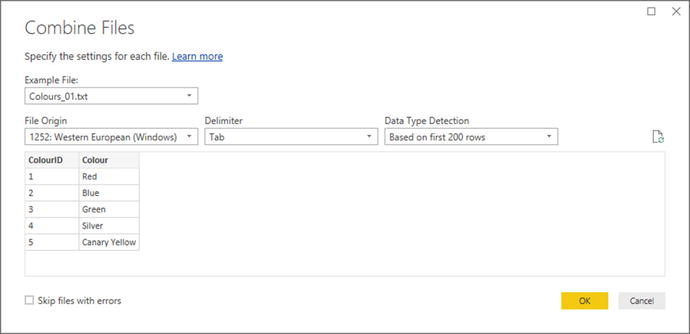 Figure 2-19.The Combine Files dialog
 - 8.Click OK. The data from all the files in the folder will be loaded into Power BI Desktop.
If you carry out this operation, you will see that an extra column will be added to the Fields list containing the name of the source file for each record.
Note
This technique presumes that all the files in the source folder will share an identical format. If you choose, you can check the Skip Files With Errors check box in step 7. This will exclude any files that do not share the same format as the file that you specified as being the example file.
The Combine Files
dialog gives you a few options that are similar to those that you saw previously when loading text/CSV files. They include
- Specifying the delimiter (separator) for fields in the dataset
- Specifying how much, if any, of the model file is used to detect the file structure
- Defining the character set (the encoding) for the source files
Loading the Contents of a Folder
Rather than loading all the files in a folder, you can choose to connect to a folder and load only the essential information about the available files. You can use this connection to load the files themselves later, should you want to. To do this:
- 1.Open a new Power BI Desktop file.
- 2.Click Get Data ➤ File, and select Folder from the options on the right of the dialog.
- 3.Click Connect. The Folder dialog will appear.
- 4.Navigate to the folder containing several identically structured text files (C:PowerBIDesktopSamplesCH02MultipleIdenticalFiles, in this example).
- 5.Click OK. The contents of the folder will be displayed.
- 6.Click Load. A series of predefined fields will appear in the Fields list, as shown in Figure 2-20.
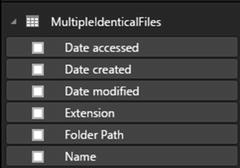 Figure 2-20.Data for folder contents in Power BI Desktop
You can now use this information either to display the contents of the folder in Power BI Desktop or (and this is where things get more fun) to select the files in the folder and load any or all of them. You will be seeing this technique in Chapter 8.
The Navigator Dialog
The more you work with Power BI Desktop, the more you will use the Navigator dialog. So it seems appropriate to explain at this early juncture some of the tricks and techniques that you can apply to make your life easier when delving into data sources.
Let’s start by taking a closer look at the available options. These are highlighted in Figure 2-21.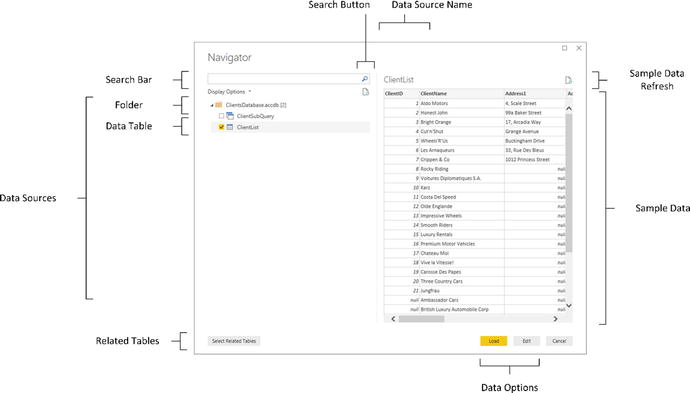
Figure 2-21.
The Navigator dialog
The Navigator dialog is essentially in two parts:
- On the left: The hierarchy of available data sources. These can consist of a single dataset or multiple datasets, possibly organized into one or many folders.
- On the right: A preview of the data in the selected element.
Searching for Datasets
There will, inevitably, be cases where the data source that you are connecting to will contain hundreds of datasets. This is especially true for databases. Fortunately, Power BI Desktop lets you filter the datasets that are displayed extremely easily.
- 1.In the Navigator dialog, click inside the Search box.
- 2.Enter a part of a dataset name that you want to isolate.
- 3.Click the magnifying glass icon at the right of the Search box. The list of datasets will be filtered to show only datasets containing the text that you entered. You can see this in Figure 2-22.
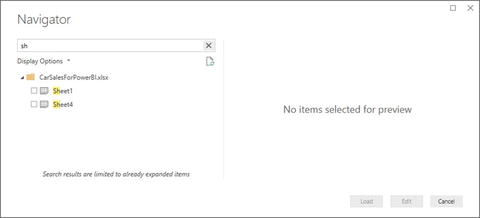 Figure 2-22.Dataset search in the Navigator dialog
Once you have previewed and selected the datasets that you want to use, simply click the cross at the right of the Search box. Navigator will clear the filter and display all the datasets in the data source.
Display Options
Clicking Display Options
will show a popup menu with two options:
- Only selected items
- Enable data previews
Only Selected Items
Selecting this option will prevent any datasets that you have not selected from appearing in the data source pane.
Enable Data Previews
Selecting this option
will show a small subset of the data available in the selected dataset. You could choose to disable data previews if the connection to the source data is slow.
Refresh
If you need to, you can refresh
either or both of the following:
- The source data
- The data preview
Source Data Refresh
Clicking the preview button under the search bar will refresh the source data in the source data pane.
Data Preview Refresh
Clicking the preview button on the top right of the Navigator dialog will refresh the preview data visible on the right.
Select Related Tables
Clicking the Select Related Tables button is only valid for database sources, such as Microsoft Access or Oracle, for instance. If the source database has been designed correctly to include joins between tables, then this option will automatically select all tables that are linked to any tables that you have already selected.
Adding Your Own Data
All the data you need may not be always available. You might find yourself needing to add a list of products, a group of people, or, indeed, any kind of data to the datasets that you have loaded into Power BI Desktop.
The development team at Microsoft has recognized this need, and offers a simple solution: you can create your own tables of data to complete the collection of datasets in a Power BI in-memory data model. Then you can enter any extra data that you need, on the fly.
- 1.In the Power BI Desktop Home ribbon, click Enter Data. The Create Table dialog will appear.
- 2.Click the asterisk to the right of Column1 to add a column.
- 3.Enter the data that you need. The dialog will look like the one shown in Figure 2-23.
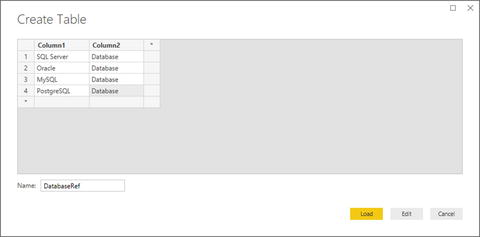 Figure 2-23.The Create Table dialog
 - 4.Enter a name for the table in the Name field at the bottom of the dialog.
- 5.Click Load to load the data into the Power BI in-memory data model.
Editing facilities in the Create Table dialog are extremely simplistic. You can delete, cut, copy, and paste data and columns, but that is about all that you can do. However, this option can, nonetheless, be extremely useful when you need to add some last-minute data to a model.
Note
This is an extremely simple process that is designed for small amounts of data. If you need more than just a handful of rows and columns, you could be better served by creating the data in Excel and then loading it into Power BI Desktop.
Conclusion
In this chapter, you have seen how this powerful addition to the Microsoft business intelligence toolset, Power BI Desktop, can help you find and load data from a variety of File-based data sources. These sources can be Access, Excel, CSV, XML, JSON, or text files—or they could come from entire folders of identically structured text/CSV files.
I am sure that you can see a pattern emerging in the course of this chapter. Indeed, this pattern will continue as you progress to loading tables from relational databases in Chapter 3. The process is nearly always
- 1.Know the type of source data that you want to look at.
- 2.Find the file that lets you access the data.
- 3.Examine the data and select the elements that you want to load.
You have seen that Power BI Desktop will let you see a sample of the contents of the data sources that it can read without needing any other application. This makes it a superb tool for peeking into data sources and deciding if a file actually contains the data that you need. Indeed, Power BI Desktop’s Navigator can help you filter multiple datasets in XML files or Access databases, preview each dataset, and only select the ones that you want to load. Of course, it can also load dozens of datasets at once if they all are stored in the same source.
However, file-based data sources are only a small part of the picture. Power BI Desktop can also load data from a wide range of relational databases and data warehouses. We will take a look at some of these in the next chapter.