Power BI Desktop is built from the ground up to enable you, the user, to sift through mounds of facts and figures so that you can deliver meaningful insights. Consequently, what matters is being able to delve into data and highlight the information it contains quickly and accurately. This way, you can always explore a new idea or simply follow your intuitions without needing either to apply complex processes or to struggle with an impenetrable interface. After all, Power BI Desktop is there to help you come up with new analyses that could give your business an edge on the competition.
Power BI Desktop provides two main approaches to assist you in focusing on the key elements of your data:
- Filters: Restrict the data displayed in a report, page, or visual. This is the subject of the current chapter.
- Interactive data selection: Allows you to highlight key information instantly and visually for an audience. We will look at these aspects in the next chapter.
The people who developed Power BI Desktop recognize that your data is the key to delivering accurate analysis. This is why you can filter on any field or set of fields in the underlying data model to extract its real value. This approach is not only intuitive and easy, it is also extremely fast, which ensures that you almost never have to wait for results to be returned.
You can add filters before, after, or during the creation of a Power BI Desktop report. If you add filters before creating a table, then your table will only display the data that the filter allows through. If you add a filter to an existing report, then the data visualization will alter before your eyes to reflect the new filter. If you modify a filter when you have visualizations on a Power BI Desktop report, then (as you probably guessed by now) all the visualizations affected by the filter will also be updated to reflect the new filter criteria—instantaneously.
You can filter any type of data:
- Text
- Numeric values
- Dates
- Logical values
Each data type has its own ways of selecting elements and setting (where possible) ranges of values that can be included—or excluded. This chapter will explain the various techniques for isolating only the data that you want to display. You will then be able to create Power BI Desktop reports based only on the data that you want them to show.
We will see all how these approaches work in detail in the rest of this chapter. In any case—and as is so often the case with Power BI Desktop—it is easier to grasp these ideas by seeing them in practice than by talking about them, so let’s see how tiles, slicers, and highlighting work. This chapter uses the C:PowerBiDesktopSamplesCH20CarSalesDataForReports.pbix sample file as the basis for all the filters that you will learn to apply.
Filters
Subsetting data in Power BI Desktop is based on the correct application of filters. Consequently, the first thing that you need to know about filters is that they work at three levels. You have
- Report-level filters
- Page-level filters
- Visualization-level filters
The characteristics of these three kinds of filter are described in Table 20-1.
Table 20-1.
Power BI Desktop Filters
Filter Type | Application | Comments |
|---|---|---|
Report-level | Applies to every visualization in the current report. | Filters data for every visual in the current file. |
Page-level | Applies to every visualization in the active page. | Filters data for every visual in the current page. |
Visual-level | Only applies to the selected visualization. | Applies only to the selected visual (table, chart, etc.). |
Filters are always applied in exactly the same way. What matters is the extent that they affect the visuals in a Power BI Desktop presentation. In practice, this makes your life much easier because you only have to learn how to apply a filter once and then you can use it in the same way at different levels in separate files.
Let’s now look at how to use filters
, beginning at the lowest level of the filter hierarchy: visual-level filters.
Visual-Level Filters
Saying that there are three types of filter available in Power BI Desktop is a purely descriptive distinction. For Power BI Desktop, any filter is a filter, and all filters work in the same way. However, as there is a clear hierarchy in their application, I will begin with visual-level filters and then move on to their ascendants—page-level filters and report-level filters. Given the general similarity between the three, it is probably worth noting that it is important you ensure that you are creating or modifying the appropriate filter. As this is not always obvious, not least when you are starting out with Power BI Desktop, I will try to make it clear as we proceed how exactly you can distinguish at what level you are applying a filter, as the effects can have wide-ranging consequences for the message that you are trying to convey.
The Filters Well
The first thing to note is that all filters are applied in the Filters well. This is in the lower part of the Visualizations pane, and looks (for a selected sample visual) like Figure 20-1.
Figure 20-1.
The Filters well
As you can see in this figure, different filters have been applied at all the possible levels of the filter hierarchy. If you look closely, you can also see that each filter gives an indication of how (if at all) the filter is applied. Since no filtering has been applied here, each filter shows All as the current selection. This tells you that all data is allowed through for the filter. You will learn how to add and adjust filters in the following few pages.
Note
The Filters well only shows visual-level filters if a visual is selected.
Adding Filters
The Filters well automatically adds any fields that you use as the basis for a visualization. To see this, create the following visual:
- 1.Open the C:PowerBiDesktopSamplesCH20CarSalesDataForReports.pbix file.
- 2.Create a clustered bar chart using these fields:
- a.Make (from the Stock table)
- b.SalePrice (from the InvoiceLines table)
- a.
The Filters well will look like Figure 20-2.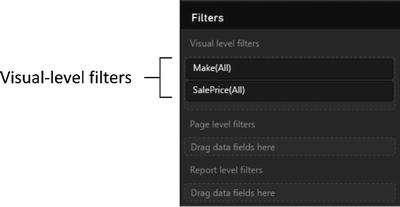
Figure 20-2.
Automatic creation of visual-level filters
Figure 20-2 shows that adding a data field to a visual automatically adds the same field to the Visual Level Filters well.
Applying Filters
To see the filter working, let’s limit the chart to displaying only a few makes of vehicle:
- 1.Select the clustered bar chart that you created previously.
- 2.In the Visualizations pane, hover the pointer over the Make filter in the Filters well. A downward-facing chevron will appear at the right of the field that is being used as a filter. This will be a visual-level filter.
- 3.Expand the Make filter by clicking the chevron. The Filters well will display all the makes that appear in the visual.
- 4.Select the following makes in the Filters well by selecting the check box to the left of each of the following elements:
- a.Jaguar
- b.Rolls-Royce
- c.Triumph
- a.
You will see that data is only displayed for the makes of car that were selected in the filter. The resulting chart should look like Figure 20-3.
Figure 20-3.
A simple filtered chart
You will have noticed that when the filter was first applied, every check box was empty, including the Select All check box. The default is (fairly logically) to set up a filter ready for tweaking, but not actually to filter any data until the user has decided what filters to apply. Once you start adding filter elements, they will be displayed in the Filters well just below the name of the field that is being used to filter data.
You modify filters the same way you apply them. All you have to do to remove a selected filter element is to click the check box with a check mark to clear it. Conversely, to add a supplementary filter element, just click a blank check box.
One final thing to note is that if you subsequently minimize the filter for a field (by clicking the upward-facing chevron that has replaced the downward-facing chevron to the right of the field name), you will now see not only the field name in the Filters well, but also a succinct description of the filter that has been applied. You can see an example of this in Figure 20-4.
Figure 20-4.
Filter description
Note
You can also add fields to the Filters well before adding data fields to the visual. Simply create a blank visual and then leave it selected while you add the filter fields to the Filters well.
The Select All Filter
The only subtlety concerning simple filters is that you also have the Select All check box. This acts as a global on/off switch to select, or deselect, all the available filter elements for a given filter field. The Select All filter field
has three states:
- Blank: No filters are selected for this field.
- Checked: All filters are selected for this field.
- Dotted: Some filters are selected for this field.
Checking or unchecking the Select All filter field will select or deselect all filter elements for this field, in effect rendering the filter inactive. The Select All filter field is particularly useful when you want not only to remove multiple filter selections in order to start over but also want to select all elements in order to deselect certain elements individually (and avoid manually selecting reams of elements).
Note
When selecting multiple elements in filter lists, you may be tempted to apply the classic Windows keyboard shortcuts that you may be in the habit of using in, for instance, Excel or other Windows applications. Unfortunately, Ctrl- or Shift-clicking to select a subset of elements does not work. Neither can you select and deselect a check box using the space bar. It is not possible to use the cursor keys to pass from one element to another in a filter list either.
Clearing Filters
Setting up a finely honed filter so that you are drilling through the noise in your data to the core information can take some practice. Fortunately, the virtually instantaneous application of filters means that you can see almost immediately if you are heading down the right path in your analysis. However, there are frequent occasions when you want to start over and remove any settings for a particular filter. This can be done in one of two ways. The first is a single step:
- 1.Click the small eraser icon to the right of the filter, as shown in Figure 20-5.
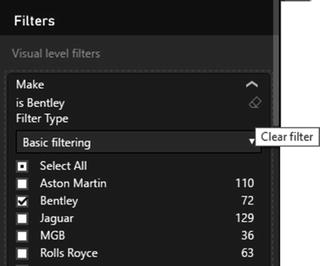 Figure 20-5.The Clear Filter icon
Alternatively, you can do the following, but only for basic filters:
- 1.Expand the filter in the Filters well by clicking the downward-facing chevron.
- 2.Click the Select All option to remove all filter selections.
- 3.Minimize the filter.
Once a filter has been cleared, the only way to get it back to its previous state is to press Ctrl+Z immediately. Otherwise, you will have to reapply the requisite criteria.
Filtering Different Data Types
So far, you have only seen how Power BI Desktop can filter text elements. Although text-based elements are a major part of many data filters, they are far from the only available type of data. There are also
- Numeric data
- Date and time data
- Logical (true/false) data
Filtering Numeric Data
You can filter on numeric elements just as you can filter on text-based elements in Power BI Desktop. However, when filtering on numbers you likely want to select ranges of numbers as precise figures.
Range Filter Mode
The first trick worth knowing is that, when filtering on numeric data, the default option is to use a threshold selector, which is the only filter for numeric filters. The threshold selector allows you to set the lower and/or upper limits of the range of numbers that you want to display in a Power BI Desktop report, page, or visual.
The following explains how to set the range of figures for which data is displayed:
- 1.Select the chart that you created previously.
- 2.Clear any existing filters.
- 3.In the Visualizations pane, hover the pointer over the SalePrice filter in the Filters well. A downward-facing chevron will appear at the right of the field that is being used as a filter.
- 4.Expand the SalesPrice filter by clicking the chevron. The Filters well will display two popups that will enable you to set thresholds.
- 5.Click the upper popup and select the “Is greater than or equal to” option.
- 6.In the box under the upper popup, enter the value 1000000 (without any thousands separators or currency units).
- 7.Ensure that the And radio button is selected under the popup.
- 8.Click the lower popup and select the “Is less than or equal to” option.
- 9.In the box under the lower popup, enter the value 8000000 (without any thousands separators or currency units).
- 10.Click Apply Filter. The chart will change to show only values in the range that you set in the filter.
That is it. You have set a range for all data in the Power BI Desktop report corresponding to the selected field. It should look like Figure 20-6. It is worth noting that in this figure I have widened the Filters well so that you can see the entire text that Power BI Desktop adds to a range filter to explain what the filter does. If you leave the Visualizations pane at its default width, you will only see an abbreviated version of the filter definition.
Figure 20-6.
A filter range
When selecting a range of numeric data, you do not have to set both upper and lower bounds. You may set either one or both.
Note
Should you want to select a precise number from those available in a dataset, you can switch a numeric filter’s filter type to basic filtering. This will show all the individual numbers in the selected field, as well as the number of times that each value occurs.
Numeric Filter Options
Numbers cannot be filtered exactly the same ways as text; the filtering options are slightly different. These filter options are described in Table 20-2.
Table 20-2.
Numeric Filter Options
Filter Option | Description |
|---|---|
Is Less Than | The selected field is less than the number you are searching for. |
Is Less Than Or Equal To | The selected field is less than or equal to the number you are searching for. |
Is Greater Than | The selected field is greater than the number you are searching for. |
Is Greater Than Or Equal To | The selected field is greater than or equal to the number you are searching for. |
Is | The selected field matches exactly the number you are searching for. |
Is Not | The selected field does not exactly match the number you are searching for. |
Is Blank | The selected field is blank. |
Is Not Blank
| The selected field is not blank. |
If you are using both threshold levels to define a range of values to include or exclude, or even specific values to include or exclude, then you need to apply one of the logical filter options. These are shown in Table 20-3.
Table 20-3.
Logical Filter Options
Filter Type | Description |
|---|---|
And | Applies both filter elements to reduce the amount of data allowed through the filter. |
Or | Applies either of the filter elements separately to increase the amount of data allowed through the filter. |
When applying a numeric filter, you must—not altogether surprisingly—enter a numeric value. If you enter text by mistake, you will see a yellow lozenge appear at the right of the box to alert you to the fact that you entered a text by mistake, and the Apply filter text will remain grayed out.
In this case, you have to delete the characters that you entered and enter a numeric value in the place of the text.
Filtering Date and Time Data
At its simplest, date and time data is merely a list of elements or a range of numeric data. Consequently, dragging a field from a date dimension into the Filters well allows you to select one or more elements (such as years or months) or to define a range (of weeks, for instance). Take the following steps to see this in action:
- 1.Select the chart that you created earlier using the Make and SalePrice fields.
- 2.Clear any existing filters.
- 3.Expand the DateDimension table in the Fields list.
- 4.Drag the FullYear field to the Visual Level Filters well. Since Power BI Desktop assumes that the years are numbers, it switches to advanced filtering.
- 5.Select Basic Filtering from the Filter Type popup list to revert to a list of years.
- 6.Click one or two years in the filter list. Figure 20-7 demonstrates this. The chart will be updated to show only data for the chosen years.
 Figure 20-7.A date filter
One of the reasons that I created a date dimension is to allow you to filter on date elements this simply. So you can now use any of the fields in the DateDimension table to restrict the data that is in a visualization. In my opinion, the following are very useful fields in this dimension:
- FullYear
- MonthAndYearAbbr
- QuarterAndYear
- YearAndWeek
However, you need to remember that you can combine multiple elements in a filter to get the correct result. So there is nothing to stop you from filtering on a specific year, and then adding the day of the week and calculating all the sales for the Saturdays in the year, for instance. By combining different filter elements from a properly constructed data dimension, you can look at how data varies over time incredibly easily.
This means that, when filtering by dates, you could need to apply multiple filters, where you can select elements from each of the different filters: Year, Quarter, and/or Month. Alternatively, if you will be filtering on successive elements in a date hierarchy (Year, followed by Month, for instance) you may find it more intuitive to drag the filter elements from the date hierarchy to the Filters well in the temporal order in which you will be using them (that is, Year followed by Month). This way, you can proceed in a logical manner, from top to bottom in the Filters well, to apply the date criteria that interest you.
Note
Whatever the data type, you cannot add hierarchies to a filter. Instead, you must expand the hierarchy in the Fields list, and drag each element of a hierarchy into the required filters well.
Date and Time Filters
If you are filtering on a Date or DateTime field, then you quickly notice that Power BI Desktop adapts the filter to help you select dates and times more easily. In essence, Power BI Desktop lets you select from four ways of filtering date and time data:
- Select one or more exact dates or times (basic filtering)
- Define a range of dates or times (advanced filtering)
- Specify a range of dates relative to the current day (relative date filtering)
- Select a top few dates (top N filtering)
Moreover, the filter well for a date adds:
- A calendar popup that lets you click a day of the month (and scroll through the months of the year, forward and backward)
- A time series scroll filter that lets you select times to every minute throughout the day
To see this in action, imagine that you want to see all sales for a range of dates:
- 1.Select the chart that you created previously.
- 2.Clear all filters from it, as described earlier.
- 3.Leaving the chart selected, expand the DateDimension table and drag the DateKey field into the Visual Level Filters well. You will see a list of all the dates in the DateDimension table in the filter.
- 4.Click Advanced Filtering.
- 5.From the “Show items when the value” popup list, select “is on or after.”
- 6.Click the calendar icon beneath the popup. The calendar popup is shown in Figure 20-8.
 Figure 20-8.The calendar popup
 - 7.Select a date from the calendar. This date will appear in the box under the calendar icon.
- 8.Click the And radio button.
- 9.In the second popup, select “is on or before.”
- 10.Click the calendar icon beneath the popup and select a date from the calendar. This date will appear in the box under the second popup.
- 11.Click Apply Filter. The Filters well will look like Figure 20-9.
 Figure 20-9.A date range filter
There are a couple of tricks that may save you time when you are selecting dates from the calendar popup (you may be familiar with these techniques in other desktop packages):
- When using the calendar popup, clicking the right-facing chevron to the right of the month and year displays the following month.
- When using the calendar popup, clicking the left-facing chevron to the left of the month and year displays the previous month.
- When using the calendar popup, clicking the month and year displays a Year popup, in which you can click the right-facing chevron to the right of the year to display the following year (or click the left-facing chevron to the left of the year to display the previous year), and then you can select the month from those displayed. You can see this in Figure 20-10.
 Figure 20-10.The calendar popup for months
 - If you have already clicked the month and year and are looking at the months for a year, you can click the year to see ranges of years. You can use the left- and right-facing chevrons to scroll through previous and successive ranges of years, then select the year that you want to filter on. You can see this in Figure 20-11.
 Figure 20-11.The calendar popup for years
 - When using the time popup, clicking inside any constituent part of the time (hour, minute, or second) and then clicking the up and down scroll triangles above and below the time field allows you to scroll rapidly through the available options.
- Clicking AM or PM to the right of the time box lets you switch from AM to PM.
If you do not want to select a date using the calendar popup, then you can enter a date directly in the date box of the advanced filter for a Date (or DateTime) field. Just remember that you must enter the date in the date format corresponding to the environment that you are using and that can be understood by Power BI Desktop.
Note
If you enter a date where the format does not correspond to the system format, or if the date is purely and simply invalid (the 30th of February, for instance), then Power BI Desktop will not let you apply the filter. To correct this, merely select a correct date using the calendar popup. Similarly, if you enter a nonexistent time, then Power BI Desktop will refuse to accept it and will revert to the previous (acceptable) time that was chosen.
Date Filter Options
Dates cannot be filtered in exactly the same ways as text or numbers. Consequently, the advanced filtering options for date filters are slightly different from those used when filtering other data types. They are described in Table 20-4.
Table 20-4.
Advanced Date Filter Options
Filter Option | Description |
|---|---|
Is | The selected field contains the date that you are searching for. |
Is Not | The selected field does not contain the date that you are searching for. |
Is After | The selected field contains dates after the date that you entered; that is, later dates that do not include the date you entered. |
Is On Or After | The selected field contains dates beginning with the date that you entered or later. |
Is Before | The selected field contains dates before the date that you entered; that is, earlier dates, not including the date you entered. |
Is On Or Before | The selected field contains dates on or before the date that you entered; that is, earlier dates, up to and including the date you entered. |
Is Blank | The selected field is blank. |
Is Not Blank | The selected field is not blank. |
Relative Date Filtering
Another way of finding data for a range of dates applies specifically to the current date. Power BI Desktop can help you find, for instance, sales in the past days, weeks, months, or even years. Here is how:
- 1.Select the chart that you created previously.
- 2.Clear all filters from it, as described earlier.
- 3.Leaving the chart selected, expand the DateDimension table and drag the DateKey field into the Visual Level Filters well.
- 4.In the Filter Type popup list, select Relative Date Filtering.
- 5.In the popup for “Show items when the value,” select “is in this.”
- 6.In the second popup for “Show items when the value,” select Year. The Filters well will look like the one in Figure 20-12.
 Figure 20-12.Applying a relative date filter
 - 7.Click Apply Filter to filter the data in the visual.
There are several options available for relative date filtering. These are described in Table 20-5.
Table 20-5.
Relative Date Filter Options
Filter Option | Filter Definition | Description |
|---|---|---|
Is In The Last | Relative positioning | Takes a range of dates before the current date. |
Is In This | Relative positioning | Specifies the current time period to be used. |
Is In The Next | Relative positioning | Takes a range of dates after the current date. |
Days | Time element | Sets days as the number of time periods. |
Weeks | Time element | Sets weeks (rolling seven-day periods) as the number of time periods. |
Calendar Weeks | Time element | Sets full calendar weeks as the number of time periods. |
Months | Time element | Sets months (rolling periods from date to date) as the number of time periods. |
Calendar Months | Time element | Sets full months as the number of time periods. |
Years
| Time element | Sets years (rolling periods from date to date) as the number of time periods. |
Calendar Years | Time element | Sets full years as the number of time periods. |
Note
Selecting “Is in the last” or “Is in the next” relative date filter options will display an additional field in the Filters well where you can enter the number of days, weeks, months, etc. to be used to filter the data.
Filtering True or False Data
There are other data types in the source data that you are likely to be handling. You might have Boolean (True or False) data, for instance. However, for Power BI Desktop, this is considered, for all intents and purposes, to be a text-based filter. On the other hand, there are data types that you cannot filter on and that do not ever appear in the Filters well. Binary data (such as images) is a case in point.
So if you filter on Boolean data, Power BI Desktop displays True and False in the expanded filter for this data type. The following explains how to see this:
- 1.Create a chart using the following fields:
- a.IsCreditWorthy (from the Clients table)
- b.SalePrice (from the InvoiceLines table)
- a.
- 2.Expand the IsCreditWorthy field in the Filters well.
- 3.Select True and Blank. The chart and Filters well will look like they do in Figure 20-13.
 Figure 20-13.Applying a Boolean filter
Advanced Text Filters
In many cases, when you are delving into your data, merely selecting a “simple” filter will be enough to highlight the information that interests both you and your audience. There will inevitably be cases when you need to filter your data more finely in order to return the kinds of results that sort the wheat from the chaff. This is where Power BI Desktop’s advanced filtering capabilities come to the fore. Advanced filtering lets you search inside field data with much greater precision, and it is of particular use when you need to include, or exclude, data based on parts of a field if it is text.
Applying an Advanced Text Filter
Let’s begin with a simple example of how to apply an advanced filter to a text field:
- 1.Click the visual that you want to filter. Once again, we will use the chart that you created earlier in this chapter using Make and SalePrice as the data fields.
- 2.Clear any existing filters.
- 3.Expand the Make field in the Filters well (unless it has already been done).
- 4.Select Advanced Filtering from the Filter Type popup. The body of the filter switches to show the advanced filter popups and boxes, and the text under the filter title now reads “Show items when the value.”
- 5.Select Contains from the popup.
- 6.Click inside the filter text box (under the box displaying Contains) and enter the text to filter on (aston in this example).
- 7.Click Apply Filter or press the Enter key. All objects in the Power BI Desktop report will only display data where the client contains the text aston. The result is shown in Figure 20-14; the advanced filter used to produce it is also shown.
 Figure 20-14.The results of applying an advanced filter
Here are several comments that it is important to make at this stage:
- Advanced filtering is not case sensitive. You can enter uppercase or lowercase characters in the filter box; the result is the same.
- Spaces and punctuation are important, as they are taken literally. For instance, if you enter A (with a space after the A), then you only find elements containing an A (uppercase or lowercase) followed by a space.
- Advanced filters, just like standard filters, are cumulative in their effect. So, if you have applied a filter and do not get the results you were expecting, be sure to check that no other filter at another level is active that might be narrowing the data returned beyond what you want.
- If your filter excludes all data from the result set, then any tables in the Power BI Desktop report displays This Table Contains No Rows.
- Similarly, if your filter excludes all data, charts will be empty.
In any case, if you end up displaying no data, or data that does not correspond to what you wanted to show, just clear the filter
and start over.
Clearing an Advanced Filter
Inevitably, you will also need to know how to remove an advanced filter. The process is the same as for a standard filter; all you have to do is click the Clear Filter icon at the top of the filter for this field (just under the chevron for the field in the field well). The filter elements are removed for this filter.
Reverting to Basic Filtering
If you decide that you no longer wish to define and use a complex filter, but you wish to revert to basic filtering, then all you have to do is select Basic Filtering from the Filter Type popup list for the selected filter. The Filters well will switch to basic filtering for the selected field.
Text Filter Options
When filtering on the text contained in a data field, you can apply the string you are filtering on to the underlying data in several ways. These are the same for both the upper and lower of the two advanced filter options for a text field. They are described in Table 20-6.
Table 20-6.
Advanced Text Filter Options
Filter Option | Description |
|---|---|
Contains | The selected field contains the search text anywhere in the field data. |
Does Not Contain | The selected field does not contain the search text anywhere in the field data. |
Starts With | The selected field begins with the search text, followed by any data. |
Does Not Start With | The selected field does not begin with the search text, followed by any data. |
Is | The selected field matches the search text exactly. |
Is Not | The selected field does not match the search text exactly. |
Is Blank | The selected field is blank. |
Is Not Blank | The selected field is not blank. |
You are not limited to setting a single advanced text filter. Just as was the case for numeric values, you can set two filters and apply either of them (by setting the logical operator to Or). Alternatively, you can set two complementary text filters by setting the logical operator to And.
Top N Filtering
One of the reasons to filter data is to extract meaning from the mass of available information. One easy way to deliver meaningful analysis to isolate the best-performing (or worst-performing) elements. Suppose, for instance, that you want to see the top three best-selling makes of car:
- 1.Click the visual that you want to filter. Once again, we will use the chart that you created earlier in this chapter using Make and SalePrice as the data fields.
- 2.In the Visualizations pane, expand the Make section of the Visual Level Filters well.
- 3.Select Top N from the Filter Type popup list.
- 4.Ensure that Top is selected from the available elements in the Show Items popup list.
- 5.Enter 3 in the field to the right of the Show Items popup list.
- 6.Drag the SalePrice field into the By Value field.
- 7.Click Apply Filter. You will see the chart and filter looking like they do in Figure 20-15.
 Figure 20-15.Applying a top N filter
What has happened here is that the SalePrice field has been aggregated for each make in the background. Then the highest three values have been used to filter the data.
Note
Filtering on the bottom N elements merely means selecting Bottom in the Show Items list.
Specific Visualization-Level Filters
So far in this chapter, we have looked at filters where the fields that were used to filter a visual were also visible in the actual visual—be it a chart, map, or table. Inevitably, there will be times when you will want to filter on a field that is not displayed in a visual. Although we touched on this earlier, it is worth explaining the concept in greater detail.
The following example explains how to apply a visualization-level filter:
- 1.Create a clustered bar chart of SalePrice by ClientName.
- 2.Display the Filters well (unless it is already visible).
- 3.Expand the Colors table and drag the Color field into the Filters well for the visual-level filters. The list of colors will be expanded automatically in the Filters well. The Color field will not be displayed in the visual, however.
- 4.Select a couple of colors, such as Night Blue and Silver. The result is shown in Figure 20-16.
 Figure 20-16.A visualization-level filter without using the data field
You will notice right away that the filters that you have applied only affect the selected visualization (the chart in this example). When you create complex reports that contain several visualizations, you will see that no other visualizations in the report have their underlying data modified in any way.
You can clear any filter at the visualization level by clicking the Clear icon at the top right of the filter name. Moreover, you can add multiple fields to the Filters well for a visual and you can add them in any order.
Note
Removing a field from the field well will not remove this field from the Filters well if the filter is active. This can be deceptive because the field is no longer displayed in the visual; however, its effects can still be seen.
Multiple Filters
So far, we have treated filters as if only one was ever going to be applied at a time. Believe me, when dealing with large and intricate datasets, it is unlikely that this will be the case. As a matter of course, Power BI Desktop will let you add multiple filters to a report. This entails some careful consideration of the following possible repercussions:
- All filters are active at once (unless you have cleared a filter) and their effect is cumulative. That is, data will only be returned if the data matches all the criteria set by all the active filters. So, for example, if you have requested data between a specified date range and above a certain sales figure, you will not get any data in which the sales figure is lower than the figure that you specified or with a sales date before or after the dates that you set.
- It is easy to forget that filters can be active. Remember that all active filters in the Filters well remain operational whether the Filters well itself is expanded or collapsed. If you are going to collapse filters to make better use of the available space on the screen, then it is worth getting into the habit of looking at the second line below any filter title that will give you a description of the current filter state. It will display something like Contains Rolls. Of course, the exact text varies according to the filter that you have applied.
Page-Level Filters
Now that you have seen what filters are and how you can apply them to visuals, it is time to extend the concept and see how filters can be applied to multiple visuals.
The good news is that all filters are configured in exactly the same way whatever the level at which they are applied. Consequently, applying filters at page level or report level is simply a question of choosing where in the Filters well to place a filter.
As an example, suppose that you want to filter all the visuals on a page to display data for a specific year:
- 1.In an open Power BI Desktop file (such as the one containing the chart that you can see in Figure 20-17), click the dashboard canvas outside any existing visuals.
- 2.Expand the DateDimension table.
- 3.Drag the FullYear field onto the field well into the Page Level Filters box. The advanced filtering options for this field will be displayed.
- 4.Select Basic Filtering as the filter type.
- 5.Select 2014 from the list of available years. All visuals on the current page will be filtered to display only data for this year.
Figure 20-17 shows you the Filters well for this operation. You can see that a page-level filter looks identical to a visual-level filter. The only difference (apart from the effect that it produces) is the position in the Filters well.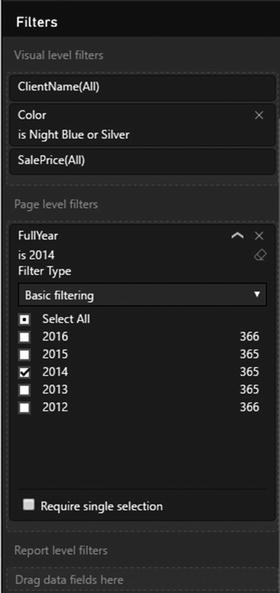
Figure 20-17.
Applying a page-level filter
You can add multiple page-level filters if you wish simply by dragging further fields into the field well and into the Page Level Filters box. The order in which the fields are added is unimportant. You will notice that the page-level filters remain visible whether you have selected a visual or not.
Report-Level Filters
The highest level of filtering is applied at report level. This means that any filter set here will apply to every page (or dashboard) in a report and consequently also to every visual in the file. Applying report-level filters is virtually identical to the application of page-level filters. So, let’s suppose that your entire report covers a single country. Here is how to set a filter that will apply to every page in the Power BI Desktop report:
- 1.Take the report that you created with SalePrice by ClientName, and then filtered by color at visual level and FullYear at page level.
- 2.Click the dashboard canvas outside any existing visuals.
- 3.Expand the Countries table .
- 4.Drag the CountryName field onto the field well into the Report Level Filters box. The advanced filtering options for this field will be displayed.
- 5.Ensure that Basic Filtering is the selected filter type for this filter.
- 6.Select United Kingdom from the list of available countries. All visuals in the current report (on every page) will be filtered to display only data for this year.
Figure 20-18 shows you the Filters well for this operation.
Figure 20-18.
Applying a report-level filter
You can add multiple report-level filters if you wish simply by dragging further fields into the field well and into the Report Level Filters well. Once again, the order in which the fields are added is irrelevant. You will notice that the report-level filters remain visible whether you have selected a visual or not.
Removing Filters
When working with filters, at times you may want to clear the decks and start over. The fastest way to do this is to delete a filter; once a filter is deleted, it no longer has any effect on the data in the Power BI Desktop report. This can be done as follows:
- 1.Click the Remove Filter icon to the right of the selected filter. This icon is shown in Figure 20-19.
 Figure 20-19.Removing a filter
The art here is to ensure that you have selected the correct filter to remove. The technique, however, is the same for all report- and page-level filters, as well as for visual-level filters that are not used to display data.
Once a filter has been removed, the only way to get it back is to click Undo (or press Ctrl+Z) immediately; otherwise, you will have to rebuild it from scratch. Interestingly, although you can add filters by dragging elements into the Filters well, you cannot drag them out of the Filters well to remove them.
However, you can remove visualization-level fields (that are not used as data for the visual) from the Filters well by clicking the cross at the right of the field name.
Note
Visual-level filters cannot be removed, only reset to empty.
Filter Field Reuse
Although it may seem counterintuitive, you can reuse the same field at the same filter level to assist you in certain cases.
As an example of this, imagine that you want to see all the mileage for vehicles between clearly defined thresholds. Take a look at the following example:
- 1.Take the report that you created with SalePrice by ClientName, and then filtered.
- 2.Remove all filters.
- 3.Expand the Stock table.
- 4.Drag the Mileage field into the field well and place it in the Page box.
- 5.Select “is greater than” from the first popup.
- 6.Enter 50000 in the box for the first threshold.
- 7.Select “is less than” from the second popup.
- 8.Enter 70000 in the box for the first threshold.
- 9.Click Apply Filter.
- 10.Drag the Mileage field into the field well and place it in the Page box under the filter that you just created.
- 11.Ensure that Basic Filtering is selected for this filter. A list of available mileage for vehicles in stock (as well as the number of cars for each mileage figure) will appear. You can see this in Figure 20-20.
 Figure 20-20.Combining multiple iterations of the same field in a filter
You can now use the more detailed filter to filter the visuals on the current page.
The interesting thing to note is that a hierarchy of filters is applied, even inside a filter box in the Filters well. Put simply, a filter that is placed above another filter will filter the available elements in the lower filter. This only applies, however, to reuse of the same filter.
Note
This example was set to filter at page level. It could equally well have been applied at report level.
Requiring Single Selection
Some filter choices will allow you to select multiple options from a list. You may want to force either yourself or an end user to select only one element from this list.
In such cases, all you have to do is check the Require Single Selection check box under the list. This will deselect any existing selected elements from the list both once this option is active and (possibly more importantly) when a new selection is made in the filter.
Note
Choosing the Require Single Selection option will also hide the Filter Type popup list. To switch to a different filter type, you will have to de-activate the Require Single Selection option by unchecking the check box.
Using the Filter Hierarchy
Given the multiple levels of filters that can be applied, a hierarchy
of filters is applied in Power BI Desktop:
- First, at the data level, any selections or choices you apply to the underlying data restrict the dataset that Power BI Desktop can use to visualize your information.
- Second, at the report level, any report-level filters that you apply affect all visualizations in the report using the (possibly limited) available source data.
- Third, at the page level, any page-level filters that you apply will affect all visualizations on the view, using the (possibly limited) available source data filtered by any report-level filters.
- Finally, for each visualization, any visualization-level filters that you apply will further limit the data that is allowed through the report- and page-level filters—but only for the selected visualization.
It is worth noting the following points:
- You have no way to apply a completely different selection to a visualization filter if it has been filtered out at a higher (report or page) level. Clicking Select All will only select from the subset of previously filtered elements.
- If you apply a filter at visualization level and then reapply the same filter at report or page level, but with different elements selected, you will still be excluding all nonselected elements from the filter at visualization level. I stress this because Power BI Desktop will remember the previously selected elements at visualization level, and leave them visible even if they cannot be used in a filter, because they have already been excluded from the visualization-level filter by being ruled out at view level. In my opinion, this adds a certain visual confusion, even if the hierarchical selection logic is applied.
Hopefully, this shows you that Power BI Desktop
is rigorous in applying its hierarchy of filters. Should you need to apply a filter at visualization level when the filter choice is excluded at report or page level, you have no choice but to remove the filter at the higher level and then reapply visualization-level filters to all necessary visualizations.
Filtering Tips
Power BI Desktop makes it incredibly easy to filter data and to exclude any data that you feel is not helpful in your data analysis. However, like many powerful tools, this ability to apply filters so quickly and easily can be something of a double-edged sword. So here are a few words of advice and caution when applying filters to your data.
Don’t Filter Too Soon
As an initial point, I would say that a key ground rule is “Don’t filter too soon.” By this, I mean that if you are examining data for trends, anomalies, and insights, you have to be careful not to exclude data that could contain the very insights that can be game changing.
The problem is that when you first delve into a haystack of data in search of needles of informational value, you have no idea what you could be looking for. So I can only suggest the following approaches:
- Begin with no filters at all and see what the data has to say in its most elemental form.
- Apply filters one at a time and remember to delete a filter before trying out another one.
- Try to think in terms of “layers” of filters. So, once you have defined an initial set of filters, add further filters one by one.
- Go slowly. The temptation is to reach a discovery in order to shout about it from the rooftops. This can lead to excessive filtering and unreliable data.
- Always remove any filters that are not absolutely necessary.
- Be careful if you hide the Filters well. It is too easy to forget that there are active filters if they are not visible in some way.
- Remember that you can have filters specific to a visualization that might not be immediately visible in the Filters well without scrolling. So always check if any visualization filters are active for each table and chart in a report.
Annotate, Annotate, Annotate
If you are presenting a key finding based on a dataset, then it can save a lot of embarrassment if you make it clear in every case what the data does and does not contain. For example, you could be so pleased with the revelatory sales trend that you have discovered that you forget to note an important exclusion in the underlying data. Now, no one is suggesting that you are doing anything other than making a point, but your audience needs to know what has been excluded and why—just in case it makes a difference. After all, you don’t want a workplace rival pointing this out to invalidate your findings in the middle of a vital meeting, do you?
Annotation techniques are described in Chapter 22 if you need to jump ahead to check this out now.
Avoid Complex Filters
Power BI Desktop filters are designed to be intuitive and easy to use. A consequence of this is that they can prove to be a little limited when you need to apply very complex filters—be they text, numeric, or date filters.
If you need to create a complex filter, it’s probably best not to create one in the report. Instead, consider trying to filter source data using Power BI Desktop Query. Should you need a more interactive way of switching between complex filter settings in a report, then use DAX to define columns that display a text as the result of a filter (as described in Chapter 11), then use the result of the filter as a selection. As a very simple example of this, consider the Mileage Range column that you defined in Chapter 11. In effect, this groups vehicle mileage into certain bandings. It follows that selecting one or more bandings in a filter will restrict the display to data that matches the predefined data ranges. With a little practice, you can extend this technique to create quite complex filters in DAX at the data level.
Conclusion
This chapter has shown you how to apply and fine-tune a series of techniques to enable you to select the data that will appear in your Power BI Desktop reports. The main thing to take away is that you can filter data at three levels: the overall report, each page, and each visualization on a page.
You have also seen a variety of selection techniques that allow you to subset data. These range from the avowedly simple selection of a few elements to the specification of a more complex spread of dates or values. Finally, it is worth remembering that you can filter data using any of the fields in the underlying dataset, whether the field is displayed in a visual in a report or not.