7
Cost Planning
The fashion of the world is to avoid cost, and you encounter it.
William Shakespeare
Major topics in this chapter are cost planning tools:
- Cost Planning Map
- Analogous Estimate
- Parametric Estimate
- Bottom-up Estimate
- Cost Baseline
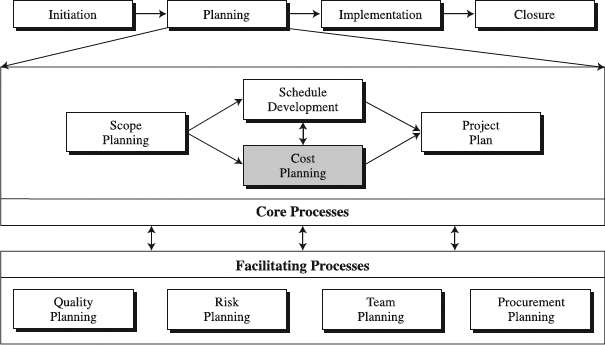
Figure 7.1 The role of cost planning tools in standardized project management process.
These tools will focus on developing an estimate of costs and the Cost Baseline (see Figure 7.1). Performing this task requires information about the scope of project activities, required resources, and a schedule of project activities. The Cost Baseline is integrated with the scope and schedule baselines to form a project performance baseline, the core of the project plan and a foundation for all other project planning from organizational to quality to risk to communications planning. In the course of the project implementation, the project performance baseline will become a corner stone of cost control and your ability to deliver the project on budget. This chapter's intent is to help practicing and prospective project managers accomplish the following:
- Learn how to use various cost planning tools.
- Choose cost planning tools that correspond to their project situation.
- Customize the tools of their choice.
These skills are of vital importance in project planning and building a standardized PM process.
Cost Planning Map
What Is a Cost Planning Map?
The Cost Planning Map (CPLM) is a tool for establishing a systematic approach to cost planning in projects (see Figure 7.2). To accomplish the approach, CPLM spells out steps and substeps a project team needs to go through in order to make choices necessary to develop basic definitions, terminology, estimate types, estimating tools, and the process for cost planning. When such choices are seamlessly integrated, CPLM can help establish a culture of cost consciousness that is proactive as well.
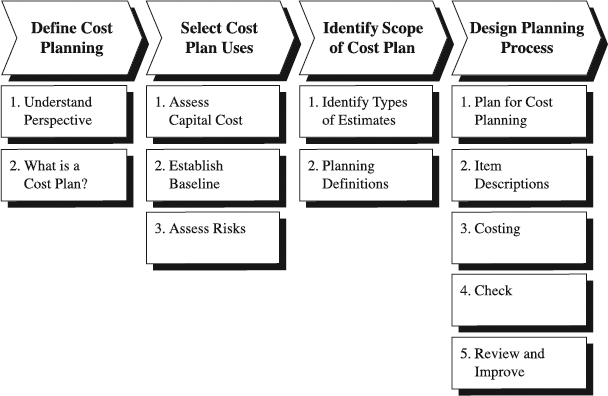
Figure 7.2 An example of the Cost Planning Map.
Deploying a Cost Planning Map
Project cost planning is an effort fraught with risks, which if not addressed may result in serious consequences. To tone down the risks and avoid the consequences, the deployment of a CPLM should boil down to a well-synchronized and integrated sequence of steps and substeps that are described in continuation.
Prepare Information Inputs. Two inputs have a significant impact on successfully deploying a CPLM:
- Financial policies
- Organizational policies of the organization performing cost planning
Financial policies dictate the design of the hardcore elements of the CPLM. For example, answers to questions such as which types of cost estimates will be used and with what purpose in the project process depend on the financial policies of the organization. Similarly, when performing resource planning, you must consider organizational policies regarding staffing and outsourcing, a key element of the costing substep in CPLM [11]. Clear understanding of the two policies is, thus, an important piece of designing the map.
Define Cost Planning. When configuring a CPLM, you should start with two simple questions: “Who is the cost planner?” and “What is a cost plan?” The former really asks about the perspective of the planner, for example, whether the planner is the owner of the project, or perhaps a contractor, and also whether the planner is experienced or just a novice. The approach to CPLM will greatly depend on the perspective, experience, and organizational culture in which the planner plans. Think, for example, of a company developing a new product. In developing a manufacturing cost estimate for the product, the company will have to consider its manufacturing process, plant, materials procurement strategy, design for manufacturability approach, and so forth. Each of these will contribute to risks and cost. If manufacturing were outsourced, the contractor is likely to have a different manufacturing process, plant, and materials procurement strategy, with no concern for manufacturability, all resulting in a different CPLM approach.
Regarding the second question, the project cost plan typically includes a cost estimate and a Cost Baseline (Time-phased Budget). Take, for example, the estimate. It is an assessment, based on specific facts and assumptions, of the final cost of a project [4]. This assessment and its results will heavily hinge on factors such as accuracy of scope, quality of available estimating data, stage of the project, time allowed for the estimate, estimator's perspective and experience, desired accuracy, available estimating tools, and so on. Consequently, by defining these factors, you will define the makeup of your CPLM. In summary, the relevance of asking the two questions is in getting answers that will help shape the CPLM for specific situation.
Select Cost Plan Uses. Once you have defined cost planning, you need to determine for what purposes you want to use the cost plan (see Step 2 in Figure 7.2). Three uses are available: to assess the capital cost, to establish a baseline, and to evaluate risks and productivity. As an assessment tool, a cost plan may serve multiple purposes—for instance, substantiating a request for capital appropriations or borrowing funds. In other situations, a cost plan can act as a basis for a proposal, bid, or contract document. Still in other situations, cost estimate, a part of the cost plan, is compared with other cost plans to validate their accuracy and increase the confidence level. Typically, this type of estimate is called an independent cost estimate [4], or in some companies' parlance, a shadow estimate.
The second capability of a cost plan, and also the second substep in this step, is to help establish two baselines—a schedule and a Cost Baseline. As we discuss later in this section, part of developing a cost estimate is identifying necessary resources such as hours of effort that are necessary to complete project activities. This is typically performed hand in hand with scheduling, so that the resource hours of effort may be turned into activity durations, thus setting a schedule baseline. By combining the scheduled activities with their budgets, you can develop a Cost Baseline, also known as a Time-phased Budget or cash flow curve. The Cost Baseline is described later in this chapter as a separate tool.
The third substep, evaluating risks, aims at establishing a reasonable amount of cost estimate to allow for changes that are likely to occur. This amount, called contingency, practically reflects project risks in the cost plan. The motivation for careful analysis of risks and subsequent identification of the contingency amount is usually driven by attempts to lower costs as much as possible. Risks, as we discuss in Chapter 9, may be related to any technical, schedule, and cost uncertainties in work packages. Once cost planning has been defined and the purpose of the cost plan selected, the stage is set for the next step to decide what will be in the cost plan.
Identify the Scope of the Cost Plan. Vital to this step is that you determine the types of cost estimates you want to use in your practice of project cost planning, as well as what exactly the estimates will include. There are many types available, but three of them are most often used across many industries, from software to construction to manufacturing: order-of-magnitude, budget, and definitive estimates [12–14]. As Figure 7.3 indicates, they differ in many attributes, from their purpose to accuracy to cost of preparation to information they require to type of the estimating tool they employ [15]. Each of the estimates can be used as a basis to develop the second element of a cost plan—Cost Baseline or Time-phased Budget. Naturally, the attributes (purpose, accuracy, etc.) of a so developed Cost Baseline would match those of the type of estimate they are developed from.
Cost estimates are typically expressed in currency units, such as dollars, enabling an easy comparison across and within projects [11]. In contrast, projects in some industries favor estimates in labor hours, lumping together labor hours of different types of expertise. This is an acceptable practice as long as it doesn't prevent comparison across and within projects. Also, the practice of providing estimates in multiple units of measure when management control requires so is acceptable.
Understanding what exactly an estimate and Cost Baseline mean calls for concrete definitions of their components and other cost planning terms. This is why we suggested that one substep should be developing cost planning definitions, such as those in the “Examples of Cost Estimating Definitions” box that follows. They will provide a shared language for all participants to communicate in the cost planning process that will be designed in the next step.
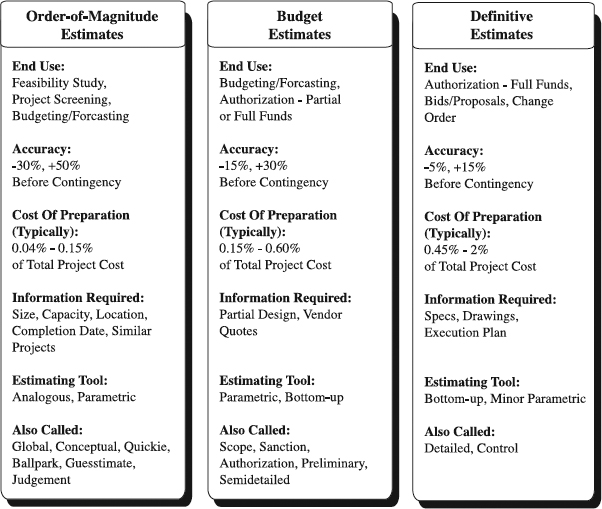
Figure 7.3 Types of cost estimates.
Examples of Cost Estimating Definitions
- Direct cost. An item of cost, or the aggregate of items, that may be identified specifically with the project. These include direct labor, materials, and equipment costs.
- Indirect cost. The cost of labor, services, or supplies not easily or readily allocable directly to a project. It is accrued and charged to overhead accounts, the sum of which is applied as burden [3].
- Most probable cost. This is the cost most likely to occur, which is made up of all the itemized known items and a contingency estimate that together invoke a 50 percent degree of confidence [4].
- Range of accuracy. This is a prediction of the least expected and highest expected cost relative to the most probable cost. Higher quality of estimate, better scope definition, lower project risks, fewer unknowns, and more accurate estimate pricing will lead to a better range of accuracy.
- Contingency. An allowance added to an estimate to cover future changes that are likely to occur for unknown causes or unforeseen conditions. Contingency can be determined through statistical analysis of past project costs or from experience in similar projects [9].
Design Cost Planning Process. This is the process that you will use to develop any of the estimates and related Cost Baselines discussed later in this chapter—analogous, parametric, and bottom-up. Of course, the process for each one of them will differ in terms of level of detail, but the principle steps will be the same. To enable this, you need to design a proper cost planning process, consisting of several substeps (see Figure 7.2). The beginning one is to preplan how you intend to perform cost planning. Although this may sound like an excessive dose of paperwork, in reality it can reduce the total effort for cost planning while minimizing rework [4]. Several specific items are the focus of the preplanning. First, thinking through who the end users of estimates are and with what purpose may help you select appropriate estimating format and forms (such as one in Figure 7.9) and identify necessary contributors and their roles, as well as the resources for the cost planning. Getting to know the due date for the estimate and details of the estimate review are crucial to scheduling cost planning work and submitting an estimate of the desired quality. Also, as part of the preplanning, you may have to figure out the cost of preparing the cost plan and inform the end users.
Developing item descriptions is the second substep, one that may have more impact on the estimate quality than any other factor (other than contingency unknowns). But what exactly are item descriptions? These are descriptions of scope items that we want to develop an estimate for (for example, see the item in Figure 7.9). Typically, a complete item description should include several elements. Begin with a quantity and applicable measurement unit, followed by a physical description of the item in as much detail as possible. Continue by stating item scope boundaries that clarify any ambiguities or assumptions, and document any diversions from conventions and standards. Add sources of estimating data (e.g., standard production rates or cost index published by a trade association).
Costing is the third substep, computing an estimate for an item. Within the core of costing is an estimating algorithm or formula that processes project information—for example, item description and a source of cost data for both direct and indirect cost—into costs. Typically, these formulas or algorithms are called cost estimating relationships (CERs). Each cost estimating tool relies on a different CER. For instance, when quantities to produce, unit production rates, and an hourly rate of labor are available, a bottom-up estimate may use the following CER to calculate labor cost:
![]()
Again, which CER for labor cost calculation is used will depend on the type of estimate being prepared.
Labor, materials, and equipment can be estimated by CERs using ratios, parameters, cost chunks, or multiplication methods, as illustrated later in this chapter. The estimated amounts should be documented and entered on the estimating form you have developed earlier. When costing for individual items is complete, direct costs for all items are often totaled separately from indirect costs, and possibly by categories of work. If requested, this is the time to translate the estimate into a cost baseline.
Tips for Cost Planning
- Know your customer. Ask questions to clarify their needs, item descriptions, and project scope, and assume nothing.
- Follow the cost planning process. Don't skip process steps. If the process doesn't work, change it.
- Go beyond a “number-cruncher” mentality. Understand the big picture and philosophy of the project and its customer.
- Document everything. Include assumptions, references, sources, scope exclusions and so on.
- Leave an audit trail. The audits enhance quality of the estimate and your level of confidence.
- Document changes. The estimate you have originally planned for is almost certain to change. Record the change. Maintain document revision control record.
- Get buy-in. Make experts from performing functional departments part of estimate preparation; after all, they have to live with it.
- Keep it in mind. Estimate accuracy depends on the amount of information, available time and resources, and estimate type.
Costing needs to be checked, the fourth substep. This involves validation of calculations, verification of estimating data sources, and peer reviews [4]. With checking done, you can move to the fifth substep—review and improve. Management needs to review the estimate because they are responsible for supervision of the estimate preparation and typically can smell major problems. Then, the estimate can be issued following the principles of sound document management. The cost planning process does not end here. Rather, it ends when the project is complete. At that time, all actual costs are collected, analyzed, and compared with the cost plan, and historical data is updated. The essence of the cost planning process is summarized in the box on page 231, “Tips for Cost Planning.”
Utilizing the Cost Planning Map
When to Use. While any project can find value in using it, organizations with large projects and organizations with a constant stream of small and medium projects may benefit most from CPLM. Consistency and discipline in cost planning that CPLM can generate is of vital importance to these users involved in the game of high financial stakes in their projects.
Time to Use. Building a CPLM is a significant time commitment. In organizations with large projects that are also complex and resource-intensive, heavy involvement of experts from various functions—technical, financial, accounting, for example—is typical, often resulting in hundreds of resource hours to construct a solid CPLM. Developing a CPLM in organizations with a constant stream of small and medium projects is less time-consuming for lower complexity and resource requirements in such projects, although it may easily take tens of resource hours.
Benefits. The value of a CPLM is in the clarity of the direction that it provides to project teams. Through a careful scripting and orchestrating of cost planning tasks, CPLM leaves no ambiguity as to what a certain cost estimate type and Cost Baseline are and how to develop them. This significantly reduces risks of poor cost planning and misusing the company's resources, increases cost consciousness, and leads behavior of cost planners in the right direction.
Advantages and Disadvantages. A major advantage of CPLM is its linear and clear structure, indicating visually steps to get to a good cost plan. The time-consuming nature of developing a CPLM and the high level of expertise required to build it are certainly its major disadvantages.
Cost Planning Map Check
Check to make sure that the cost planning map is appropriately structured. It should
- Be based on necessary information inputs.
- Include basic definitions, terminology, estimate types, and tools for estimating and cost baselining (time-phased budgeting).
- Include crucial steps and substeps in the cost planning process.
Variations. The CPLM described here is just one of many variations used in the industry. Some of them are more comprehensive, others less so. Sequencing of cost planning process steps may vary, as well as the number of estimates types and cost planning tools.
Customize CPLM. CPLM that we have described is a tool of general purpose, designed to match needs of a variety of organizations managing projects. You may find it more valuable to adapt the tool to your specific needs. Following are a few ideas about potential directions for such adaptation.
| Customization Action | Examples of Customization Actions |
| Define limits of use. | Use CPLM for all organization's projects, large and small. |
| Add a new feature. | Include more types of estimates, such as the detailed estimate and more estimating tools. |
| Leave out a feature. | Eliminate definitive estimates (for organizations with small projects). |
Summary
Presented in this section was the Cost Planning Map (CPLM), a tool for establishing a systematic approach to cost planning in projects. While any project can find value in using it, organizations with large projects and organizations with a constant stream of small and medium projects may benefit most from CPLM. The value of a CPLM is in a careful scripting and orchestrating of cost planning tasks that leaves no ambiguity as to what a certain cost estimate type and Cost Baseline are and how to develop them. This significantly reduces risks of poor cost planning and misusing of the company's resources. In sum, the key points in structuring the map are listed in the box that follows.
Analogous Estimate
What Is an Analogous Estimate?
An Analogous Estimate is the derivation of an estimate for a project that is being estimated—called the target project—based on the actual cost of a previous project or projects (analogous or source project) of similar size, complexity, and scope [16]. The estimators may use “gut feel,” historical data, or rules of thumb that are modified to account for any differences between the estimated project and analogous project(s). An example of the Analogous Estimate is illustrated in Figure 7.4, while basic features of the estimates are shown in Figure 7.5.
Developing an Analogous Estimate
In general, the process of developing an Analogous Estimate will follow steps that we have defined in the cost planning process, part of the Cost Planning Map. Specifics will vary to reflect the nature of the analogous estimating.
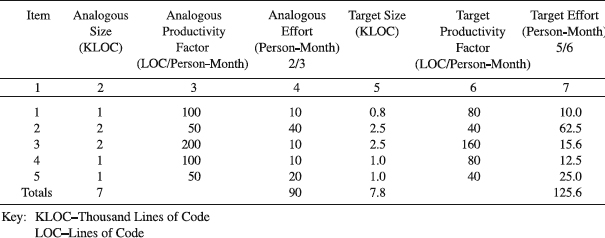
Figure 7.4 An example of the Analogous Estimate for a software project.
Collect Necessary Information. Quality information inputs are a prerequisite to the development of a quality analogous estimate. They include the following:
- Project scope
- Historical information about analogous projects
- Resource requirements
- Resource rates.
Identifying the target project and analyzing its scope ensures that the project being estimated is understood. For the estimate to develop, however, we need an analogous project, which will be extracted from a historical database of previous projects with similar features. Resource requirements and rates are necessary to express the estimate in appropriate units.
Prepare the Estimate. The starting step is figuring out the preplanning specifics such as who the end users of the estimate are, the purpose of the estimate, estimating format, list of contributors and their roles, and available resources for the estimating. What follows is studying the target project's scope, size, and complexity features. In our example in Figure 7.4, the scope of the target project is broken down into five major items (column 1), each one with the estimated size (column 5). Now we can go to the database of your previous projects with similar features to evaluate them. The most appropriate project (or projects) is selected as the analog. The mapping of analogous features to the target project is fairly straightforward because the two projects share a common set of features [13]. Our example has chosen one analogous project with the same five items. Analyzing actual data about the analogous project indicates size and productivity (columns 2 and 3, respectively), as well as the effort for the completion of each of its items in column 4, essentially an analogous CER (cost estimating relationship). Then we transfer the solution that achieved the goal in the analogous project to the target, adjusting it for analogical elements that are not in correspondence with the target project. Specifically, for item 1 in our example, the project team is less experienced and their productivity (column 6) is judged to be 0.8 (judgmental factor) of that for the analogous project team (column 3). Applying a CER that divides an item size value (column 5) by the productivity factor (column 6) yields an item estimate (column 7) expressed in resource hours. To turn them into monetary terms, we can multiple the hours by the resource rates.
Use Combinations of Estimating Tools
None of the available estimating tools– Bottom-up, Parametric, and Analogous Estimate–is better than the others from all aspects. Rather, all of them have advantages and disadvantages that are complementary. This is especially important in the world of software development, where practitioners are concerned over their inability to estimate accurately project cost [2]. Therefore, in practice, Boehm suggests, we should rely on combinations of the estimating tools, comparing their results, and where differences occur, repeating the exercise [5]. While this can exact more estimating resources resulting in a higher cost, benefits related to higher accuracy of the estimates are obvious.
A sum of the all estimated items is equal to the total project estimate. Crucial in this effort is the ability of the estimators to identify subtle differences in the source and target items and estimate the cost of a target item based on the source item that is really similar or analogous [16]. Checking, reviewing, and improving the estimate, as explained in the section about the Cost Planning Map, is the final step in developing an Analogous Estimate.
Utilizing an Analogous Estimate
When to Use. An Analogous Estimate is a tool of choice when there is a lack of detailed information about the project. Typically, this is the case early in the project life cycle. Because other estimating tools have disadvantages of their own as well, an Analogous Estimate can be used in combination with the bottom-up and parametric estimates (see details in box that follows, “Use Combinations of Estimating Tools”).
Time to Prepare. An Analogous Estimate operates on the assumption of a limited amount of information about the target project and a very summary type of information about the analogous project. Put together, these two facts mean that just a few hours may be enough for almost any project's analogous estimate. A smaller project would take less than that.
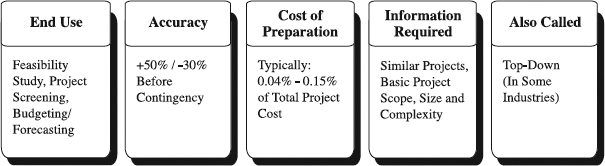
Figure 7.5 Basic features of Analogous Estimates.
Benefits. The value an Analogous Estimate brings to a user is in the little time it takes to develop, while operating with limited available information about the project.
Advantages and Disadvantages. The Analogous Estimate is based on representative past experience so that the developed estimate can be substantiated [17]. Also, it is generally less costly than other tools [11]. These same advantages lead to its major disadvantages in that the estimate is as good as is past experience and is generally less accurate than other estimates [17, 18].
Variations. In analogous estimating, an estimator may choose to estimate only the total target project without breaking it down into items as we have done. He or she may judge, for example, that the target project may take twice the resource hours as the analogous one. This judgmental factor of 2 would then be multiplied by the resources deployed in the analogous project to obtain the estimate for the new target project.
Customize the Analogous Estimate. The relatively simple nature and process of the estimate offer limited opportunities to customize it to better account for your project needs. Still, some customization is possible, as the following examples indicate.
Summary
This section's focus was on the Analogous Estimate for a project that is based on the actual cost of a previous project or projects of similar size, complexity, and scope. An Analogous Estimate is applied when there is a lack of detailed information about the project. Typically, this is the case early in the project life cycle. The value an Analogous Estimate brings to a user is in the little time it takes to develop, while operating with limited available information about the project. Below we summarize key points in developing the Analogous Estimate.
Analogous Estimate Check
Check to make sure you developed a proper Analogous Estimate. This should be based on the criteria:
- Scope, size, and productivity of the analogous project
- Actual cost of the analogous project
Derive a judgmental factor and apply it to obtain one of the following:
- Analogous Estimates for items of the project scope, which when summed up give a total project cost estimate
- Just one figure for the analogous total project cost estimate
Parametric Estimate
What Is a Parametric Estimate?
A Parametric Estimate uses mathematical models to relate cost to one or more physical or performance characteristics (parameters) of a project that is being estimated [3]. Typically, the models provide CER that relates cost of the project being estimated to its physical or performance parameters, such as production capacity, size, volume, weight, power requirements, and so forth. Determining the estimate for a new power plant may be as simple as multiplying two parameters—the number of kilowatts of a new power plant by the anticipated dollars per kilowatt. Or it may be very complex, for instance, involving 32 parameters (also called factors or cost drivers) into an equation to estimate the cost of a new software development project. Values of the parameters can be entered into the CER, and the results can be plotted on a graph (see Figure 7.6) or tabular format. Basic features of the parametric estimates are described in Figure 7.7.
Developing Parametric Estimates
Collect Necessary Inputs. To develop a proper Parametric Estimate, you may need to collect quality information inputs that include the following:
- Basic project scope
- Selected project parameters
- Historical information.
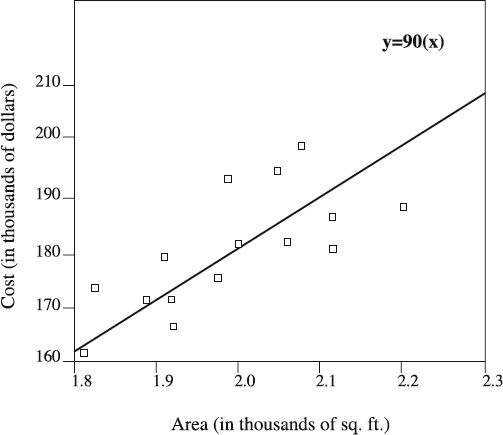
Figure 7.6 Typical CER in a Parametric Estimate model.
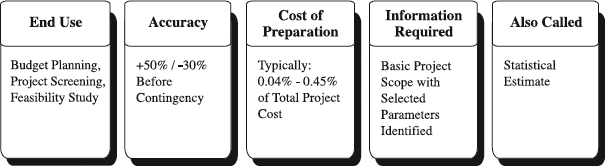
Figure 7.7 Basic features of Parametric Estimates.
Basic project scope description provides understanding of what is being estimated. Its parameters are identified on the basis of the nature of CER model that will be used to collect and organize historical information, which will be related to the project being estimated.
Prepare the Estimate. As explained in the section about the Cost Planning Map, the general process of developing any type of estimate is pretty much the same. Per such process the parametric estimating starts with preplanning and continues with developing item descriptions and costing. The last step is very uniquely performed. Specifically, it includes database development, model building, and model application.
The purpose of database development is to collect and organize cost data from past projects in such a manner that the data can be used to build a model, which will be employed to estimate the cost of a new project. The first step is to select the framework to organize costs of past projects methodically. That framework is called the basic work element structure form and corresponds to that of the desired CER. For example, the structure may include project management cost (e.g., planning, controls), nonrecurring costs (e.g., design and engineering, software, facility), and recurring costs (e.g., production, operations). The necessary cost data from outside and within an organization are collected against the structure and normalized to established ground rules and assumptions. Typically, these databases are maintained in some constant-year price levels and are updated periodically to provide consistency in estimating from project to project.
Building a model aims at determining which equation type would best fit a data sample organized in the database and deriving a mathematical model for the CER that describes the project we want to estimate [3]. While many mathematical models in the form of equations can be used for the CER, in practice, lots of cost data can be fit empirically using one of the following forms—linear, power, exponential, or logarithmic curves. When graphed, all of them will look like either straight lines or well-behaved curves. As shown in Figure 7.6, the simplest CERs are as simple as the dollars per square foot relationship, a linear relationship of the form y=ax, where y is the estimated project cost (dependent variable) that is a function of x, the area in square feet (parameter and independent variable), and a is the parameter based on historical cost data relating the dependent variable to the independent variable (parameter). If this type of CER is used for rough cost estimating for a new home, and assuming that a number of homes between 1800 and 2300 square feet had costs of $90 per square foot, then the corresponding CER can be expressed as:
![]()
This simple linear model assumes that there is such a relationship between the independent variable (parameter) and cost that as the independent variable changes by one unit, the cost changes by some relatively constant number of dollars. Often, life is not that linear and simple, which leads to the use of nonlinear CERs (see an example in the box that follows, “Parametric Software Estimating”), as well as CERs with multiple independent variables and multiple regression analysis.
How do we determine which equation type would best fit a data sample organized in our database? If we enter all data points from the past projects into a graph, generally the best fit would be the equation type that can be drawn through the data points such that the sum of vertical distances from the CER curve to the data points above the line are about equal to the sum of vertical distances from the CER curve to the data points below the line. Or more sophisticatedly, the best mathematical fit is the equation type that minimizes the absolute value of total cost deviation between the data points and the CER curve [3].
Once the best-fit equation type is determined, model building continues with deriving a mathematical model for the CER. Among many statistical techniques available for this, the method of least squares appears to be the most frequently used curve-fitting method. Although linear in nature, the method can be applied to both linear and nonlinear CER equation types, to the latter only when they are transformed into linear forms.
Parametric Software Estimating
Many parametric software effort models are based on key software parameters as cost drivers. They are usually based on the statistical analysis of the results of previous software development projects [5–8]. These analyses included key parameters such as system size (e.g., line of code), complexity (e.g., degree of difficulty), type of application (e.g., real time), and development productivity (e.g., productivity). An expert suggested 59 parameters (factors) that can impact the outcomes of these cost models [10]. A simple model can take the form of:
- Z = CYL Where Z = estimated project effort (person-months)
where:
- Y = Estimated project size (KLOC-thousands of lines of code)
- C = Regression coefficient
- L = Regression exponent
You can apply this model to estimate the effort for a new software development project by assuming the following values: C = 3.8, L = 1.4, Y = 2.
- Z = CYL = 3.8 (2)1.4 = 10.03 person-months
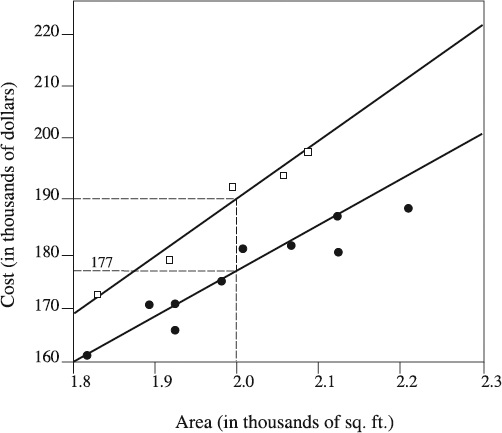
Figure 7.8 Stratified cost estimating relationships (CERs).
When database development and model building are complete, you can proceed with the next step—model application, using CER derived from past cost experience to estimate the cost of a new project. Clearly, the assumption in applying CER is that future projects will be performed as past projects. What if, as is often the case, the future project that is being estimated differs from the past projects in some details? This can be resolved by CER stratification and cost adjustments. Through stratification our historic database is divided into layers, each one a “family” of data points similar to each other in some respect. Then, a separate curve for each family is fitted. For example, five data points in Figure 7.6 have higher costs than the other ten. A close look reveals that these five data points are for luxurious homes with features such as central vacuum cleaner, surround system, stainless steel appliances, marble countertops, hardwood floor, stucco work, and so forth, while the remaining ten were ordinary homes with much simpler and less expensive features. Logically, we could stratify our database into two families of homes and fit curves through each of the two subsets of the database, thus obtaining two CERs, as illustrated in Figure 7.8. If we have a square footage of the home being estimated (for example, 2000 square feet), we can easily read off Figure 7.8 the parametrically estimated cost of either the luxurious ($190K) or the ordinary home ($177K).
Cost adjustments or complexity factors are also used in parametric estimating to adjust the CER estimated cost to mirror a difference between the project or its item being estimated and the database from which the CER was built [3]. For example, product development projects from the database typically included an average number of ten prototypes. If a project being estimated includes 40 prototypes, two methods can help resolve the difference. One is to stratify the database and develop separate CERs for different numbers of prototypes. The other is to separately compute the cost of the prototypes. Whatever the case, when cost adjustment is done, the Parametric Estimate needs to be checked, reviewed, and improved as discussed in the section on the Cost Planning Map.
Utilizing Parametric Estimates
When to Use. Parametric Estimates are most often used in the project definition stage as well as in the early design stages when there is not enough information to develop a Bottom-up Estimate. Considering that CERs typically relate project cost to high-level measurement of capacity or performance, it is exactly this information that is available early [3]. Naturally, such summary information makes parametric estimates very appropriate for calculating comparative cost assessments of alternate project approaches and providing a cross-check to other estimating tools, but not for developing a detailed competitive cost proposal [4]. To be used for such purposes, the Parametric Estimate must be based on accurate historic information, quantifiable parameters, and scalable model (applicable in both small and large projects).
Time to Develop. The most difficult and time-consuming part of parametric estimating is the methodology development, including database development and formulation of the CER. Depending on the complexity of the database, it may take anywhere from tens of hours to hundreds of hours to develop the database and CER. Once that's done, the estimating act can be measured in minutes or hours, having to do with the nature of the assignment.
Benefits. Parametric cost estimating tends to be faster and less resource-consuming than bottom-up estimating. Focused on the need to establish good CERs that properly relate project cost and cost-driving parameters, parametric estimates are bent on including only truly driving cost parameters, disregarding what is less important. This concentration on cost-driving parameters—coupled with greater speed and lower resource consumption—enables parametric estimates to be applied in estimating situations in which the Bottom-up Estimate is neither practical not possible. Think, for example, about a house cost estimating. To develop a Bottom-up Estimate of the house, you need detailed house blueprints, bill of materials, labor trades and rates information, and so forth. A lot of effort and cost is needed to prepare all of this. For estimating the cost of the same house using dollars per square feet parameter, you only need knowledge of the house structure, making it much faster and easier to estimate. Apparently, Parametric Estimates can be produced even though little is known about the project except its physical parameters.
Advantages and Disadvantages. Major advantages of parametric estimates are in that they are
- Easy to use and repeatable. The reason for these is that the estimates are based on mathematical formulas, which correlate the present estimate with the past history of resource utilization on similar project items. Still, to enjoy these advantages, you must rely on judgment and experience.
On the negative side, this calibration to the past that is not necessarily applicable to the future may
- Incorrectly present cost trends.
- Be subjective. Adjusting the CER calculated cost to account for identified differences between the item being estimated and the database from which the CER was derived is often subjective and difficult. This may be a reason why the accuracy of parametric estimates varies widely.
Variations. Parametric Estimates are extensively used in manufacturing, construction, and software industries, ranging from very simple ones to those with many parameters. Although many companies developed their own models, there are also commercially available models, such as three aerospace-oriented hardware models—PRICE, CAAMS, and FAST [16].
Customize the Parametric Estimate. To develop a parametric estimating model of a higher value to your projects, one that fits your needs, you may adapt the generic model we have described. The following examples provide some hints on how to accomplish this.
| Customization Action | Examples of Customization Actions |
| Define limits of use. | Use Parametric Estimates for budget planning and project screening. |
| Modify a feature. | Adjust the CER calculated cost for design complexity of new projects caused by fast technology changes (this is for high-tech projects). |
| Leave out a feature. | Eliminate cost adjustments for projects with stable technology. |
Summary
This section centered on the Parametric Estimate, which uses mathematical models to relate cost to one or more physical or performance parameters of a project. The Parametric Estimate is most often used in the project definition stage, as well as in the early design stages, when there is not enough information to develop a Bottom-up Estimate. The value of Parametric Estimates is in that they can be produced even though little is known about the project except its physical parameters.
Parametric Estimate Check
Check to make sure you developed a proper parametric estimate that
- Is based on a well-structured database of historic cost information.
- Is developed from best-fit CER that is derived from the database.
- Shows total project cost and its items, if these are required.
That value can be further improved if the estimate is customized for specific project needs. The box on page 242 summarizes the key points in developing the Parametric Estimate.
Bottom-up Estimate
What Is a Bottom-up Estimate?
A Bottom-up Estimate relies on estimating the cost of individual work items, then adding them up to obtain a project total cost [11]. Typically, an in-depth analysis of all project tasks, components, and processes is performed to estimate requirements for the items including labor and materials. The application of labor rates, material prices, and overhead to the requirements turns the estimate into monetary units [3]. Fig. 7.9 is a generic version of the Bottom-up Estimate for simpler projects, with more complex projects having more details and documentation. Basic features of the Bottom-up Estimates are summarized in Figure 7.10.
Developing a Bottom-up Estimate
Collect Necessary Information. The process of developing a Bottom-up Estimate and its accuracy heavily depend on the quality of the information inputs such as the following:
- Project scope (WBS)
- Resource requirements
- Resource rates
- Historical information
- Project schedule.
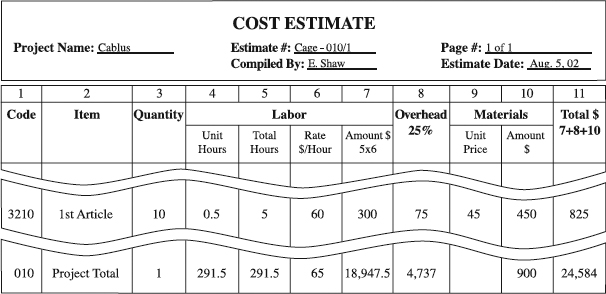
Figure 7.9 An example of the Bottom-up Estimate.

Figure 7.10 Basic features of Bottom-up Estimates.
Project scope in the form of WBS provides a framework to organize an estimate and ensure that all work identified in the project is estimated [11]. For this to happen, resource requirements that define types and quantities of resources necessary to complete the work are multiplied by resource rates to obtain a cost estimate. Typically, the rates come from historic records of previous project results, commercial databases, or personal experience of team members. Considering that some estimates contain an allowance for cost of financing such as interest charges, which are time-dependent, the durations of activities as defined in the project schedule are an important input.
Establish the Estimate Format. Once all information inputs are available, work on a Bottom-up Estimate begins. Normally, the format of the estimate is established in the Cost Planning Map. A sound practice in that sense is to adopt a format that is based on a code of accounts, where a cost code is allocated to each item. In our example in Figure 7.9, the code in column 1 is actually built on WBS coding. This simplifies the analysis of the project while serving as the basis for cost reporting, cost control, and even information retrieval [12].
Prepare the Estimate. When the estimate format is set, take several steps to prepare the estimate. Since these steps are discussed in general in the section on the Cost Planning Map, here we will shed light on their specifics related to Bottom-up Estimates. First, you need to identify an item that is being estimated, then determine its quantity, along with the cost of labor (human resources), overhead, and materials. One good way to accomplish this is to proceed area by area or category by category in the project, before adding them up to arrive at the total project estimate. We take that approach in our example in Figure 7.9, selecting an item to be a work package in WBS. Specifically, our work package is called 1st article approval (column 2). By estimating work package by work package, our intent is to eventually aggregate them up the WBS to obtain total project cost.
The item of 1st article approval requires that the quantity (column 3) of ten prototypes of a high-tech cable are produced with equipment, tooling, fixtures, and materials that will be used later in the course of the regular production. Should you show the estimated labor cost for a single unit or a whole project batch of ten items? When project tasks are single and nonrepetitive, the question of quantity is irrelevant. When there are multiple identical items, as in our example, the cost for the whole batch needs to be estimated. Accordingly, our CER will multiply half an hour per unit (column 4) by the ten prototypes (column 3), which is a total of 5 resource hours (column 5), by a rate of $60 per resource hour (column 6) to obtain the cost of $300 (column 7).
Columns 4 to 7 indicate the labor times and cost for each estimated work package item. While we use monetary units to record cost in columns 6 and 7, we do recognize that many a project manager will not do so, but instead will only record labor or resource hours in columns 4 and 5. This is an acceptable practice in many industries, where project managers are not expected to manage dollars but resource hours only. Actually, when these labor times estimates (along with actually achieved times) are used for estimating future projects, the category of resource hours is much more relevant than the one of cost. With the passage of time, the accuracy of cost is eroded by inflation and other factors, while the resource (labor) times estimates should remain valid.
Involved in the project may be different departments and their specialists (for how not to exclude the departments, see box that follows, “How the Courthouse Disaster Was Courted”). Since they typically have different hourly rates consisting of their salaries or wages, plus employee-related expenses, an adequate estimate should be based on labor times and hourly rates of all contributing specialists. When labor cost for all these specialists is totaled in columns 4 to 6, it will yield total labor cost in column 7, the direct labor cost for each work package item. When quantities to produce, unit production rates, and an hourly rate of labor are available, labor cost may be calculated as explained in the section about the Cost Planning Map.
When the direct labor cost is calculated, you can move to the labor overhead (column 8). There are no hard-and-fast rules here, since company policies widely vary. While some companies zealously include labor overhead into the estimate, other companies do not factor overhead labor into the estimate at all. Those who do often have different overhead rates in different parts of the company, and even from a project to a project. Very frequently, this rate is based on a CER, calculating it as a percentage of the direct labor cost in column 7. In our example (Figure 7.9), the rate is 25 percent, for most industries a lean and competitive approach. Typically, the overhead labor relates to the wages and salaries of employees who are not directly connected with the project, such as supervisors.
So far, the estimate produced direct and overhead labor cost for an item, in our case a work package. Now, we will estimate a net cost of materials required for the item completion (column 10), using a CER that multiplies the cost per unit (column 9) by the number of units (column 3). Materials cost typically comprises costs of components, raw materials, or services for each item. It can include the cost of larger capital equipment as well, which is left out here for the sake of simplification. While our example for unit prices is based on catalog prices of materials, it is also possible to base it on vendor quotations or standard unit costs for stock items [19].
How the Courthouse Disaster Was Courted
Halfway through its construction, the courthouse project looked like a sure winner for the contractor. The project was on schedule, contract payments were made in a timely manner, and the owner was happy with project performance. Then Greg, the contractor's project manager who also developed the Bottom-up Project Cost Estimate that was the basis for the project contract, left the company. A month later, Pete, the new project manager, figured out that the whole project budget was spent although lots of work remained to be done. A quick audit commissioned by management revealed the following:
- A significant monetary loss was to be expected at the end of the project.
- Greg's project cost estimate was never reviewed by peers or managers.
When completed a few months later, the courthouse became one of the biggest losers in the company's history, ending $500K in the red, almost one-third over the original budget. In the postmortem session, the following improvements were adopted for future cost estimating:
- All major estimates will be reviewed by peers and management.
- All major estimates developed under time pressure will be compared to a shadow cost estimate (a cost estimate developed by an independent firm).
With direct and overhead labor cost already available, the materials cost is the last cost piece necessary to figure out the total estimated cost for the item. Adding them up in column 11, everything comes together. Repeating this exercise for each item (i.e., work package) and summing up estimates for all items will lead to a total project cost estimate. If this were a project for an external customer, this would be the time to add markup for profit. The work on a Bottom-up Estimate ends with checking, reviewing, and improving it. Details about this are discussed in the section on the Cost Planning Map.
Utilizing Bottom-Up Estimate
When to Use. Both small and large projects, whether simple or complex, are good candidates to apply Bottom-up Estimates. Typically, the application occurs just before project execution, or even in earlier phases if the required information inputs are available. This generally means that a substantial amount of design work is completed, often exceeding 60 percent. For their detailed nature, they are primarily used for cost control budgets, bids/proposals, and change order estimates (see the box that follows, “No Bottom-up Estimate, No Job!”).
Time to Develop. The time to develop a Bottom-up Estimate varies with the size and complexity of a project that is being estimated. A 500-resource hour project without materials and equipment may take an hour or two to Bottom-up Estimate. In contrast, a team of estimators may spend thousands of resource hours preparing a bottom-up estimate for a $400M project.
Benefits. Bottom-up Estimates' value lies in their capacity to produce estimates of good accuracy, which is higher than that of any other estimating tools. Subsequently, they are the best basis for cost control [4].
Advantages and Disadvantages. Bottom-up Estimates' advantages are that
- They can easily be applied—in manual form or computerized form.
- Because of their involvement in the estimating process, people who will do the work are committed to the estimate.
These two major advantages may be offset by the estimate's major disadvantage. They may be relatively time consuming, requiring that the details of the project design are known.
Variations. These are generally changes in the layout of the tool, most often providing more or less detailed information about elements of the estimate such as labor, overhead, or materials cost.
No Bottom-up Estimate, No Job!
“We develop perfect quality software” was an informal motto of SP Group, a unit of a privately held company. Its clients, divisions of the same company, agreed: SP Group was doing a great job of developing software applications that had almost no bugs. Happy with the quality, the clients didn't care much about the actual costs of the projects. For a project to be approved and paid for by the client, SP Group would simply submit an order-of-magnitude estimate ranging from 1,000 to 10,000 resource hours—and that's it. Then, the company went public and the trend of profit orientation and demonstrated cost efficiency took over. Unable to respond to the trends, all division managers were forced out and new, profit-oriented division executives were brought in. The game of cost estimating also changed. “Sharks,” as project managers called the new division managers, flatly refused to even look at the order-of-magnitude estimates. Having profit-and-loss responsibility, sharks wanted to manage their cost and required Bottom-up Estimates to approve a project. Lacking the expertise to develop such estimates, the large majority of project managers were also forced out. Apparently, the time to learn how to develop a Bottom-up Estimate has come to SP Group.
Customize the Bottom-Up Estimate. Since we have described a generic Bottom-up Estimate that is tailored to meet the needs of projects across industries, it may not be appropriate for every project. If so, adapt it to gain more value out of it. The examples on page 247 provide ideas on how to adapt it.
Summary
In this section we dealt with the Bottom-up Estimate, where we estimate the cost of individual work items, then add them up to obtain a project total cost. Both small and large projects, whether simple or complex, are good candidates for Bottom-up Estimates. Typically, the application occurs just before project execution, or even in earlier phases if the required information inputs are available. They are valued for their capacity to produce estimates of good accuracy, which is higher than that of any other estimating tools. Customizing the estimate for specific project purposes adds to its value. In summarizing the use of the Bottom-up Estimate, the following list offers key points for its development.
Bottom-up Estimate Check
Check to make sure you developed a proper Bottom-up Estimate. The estimate should show
- Cost code
- Item descriptions
- Item quantities
- Item labor cost
- Item overhead cost
- Item materials cost
- Total cost for the line item
- Total project cost
Cost Baseline (Time-Phased Budget)
What Is the Cost Baseline (Time-Phased Budget)?
The Cost Baseline is a time-phased budget used to measure and monitor cost performance on the project [11]. Developed by summing estimated costs by time period, the baseline reflects estimated costs and when they were supposed to occur, if executed in a specific way (see Figure 7.11). Frequently, the baseline is displayed in the form of an S-curve (see Figure 7.13). Many projects, mostly large ones, may have multiple Cost Baselines expressing different facets of cost performance. For example, the baseline may measure expenditures (cash outflows), received payments (cash inflows), or committed costs. In contrast, other projects may have only one Cost Baseline—a labor S-curve that measures how labor hours are expended.
Developing a Cost Baseline (Time-Phased Budget)
Collect Necessary Inputs. A smooth process of constructing a Cost Baseline depends on the availability of such quality inputs as:
- Cost estimate
- WBS
- Project schedule
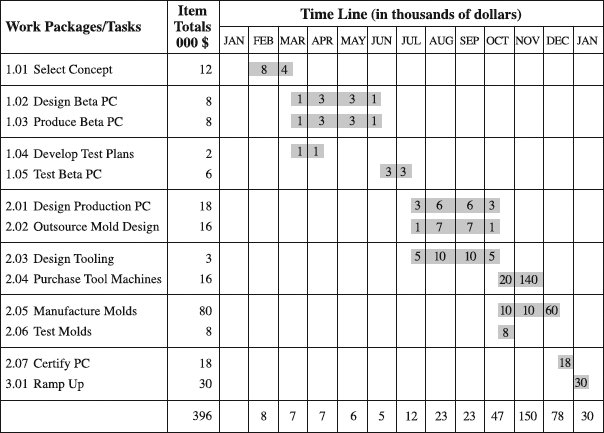
Figure 7.11 An example of the Cost Baseline (Time-phased Budget).
A simple definition of cost baselining as the sheer spreading of the cost estimate items over time hints that having a documented cost estimate that includes all cost items is a starting point. Hopefully, these items can be arranged in tune with WBS as we have chosen to do. If done so, the knowledge of the project schedule—indicating planned start and expected finish dates for work elements—enables the assignment of the cost to the time period when the cost will be incurred.
Identify the Type of Cost Baseline and Cost Items. Which types of cost are typically included in a Cost Baseline? That, of course, depends on the type of the baseline being developed. As mentioned earlier, several are available, but the size and nature of the project are major determinants of the baseline type you may need. If the target is to prepare a baseline focusing on project expenditures (also called project spending plan or cash outflows or project budget), which is our focus here, consider including a broad menu of cost items, some of which are as follows:
- Salaries and wages of project personnel (in simplest cases this is the only item to include in in-company projects)
- Overhead expenses
- Payments to contractors
- Payments of vendors' invoices for purchases of equipment, materials and services
- Interest payable on loans, loan repayments, tax payments, shipping fees, duties, and so on.
In case you are after the baseline measuring cash inflows, examples of some cost items that may be included are as follows:
- Payments from customers for delivered equipment, materials and services
- Loans from financial institutions
- Tax refunds, grants, and so on
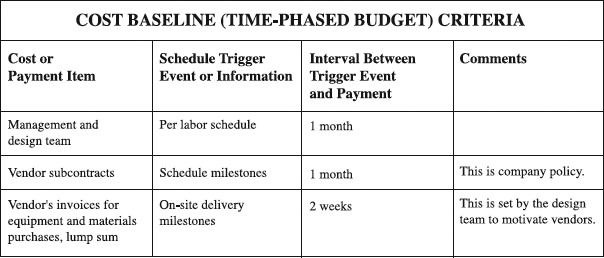
Figure 7.12 Examples of criteria for cost baselining in a product development project.
If the intent is to manage cash flow, you will need items for both cash outflows and cash inflows. Once the cost items to include are identified, it is time to set criteria for cost baselining.
Set Cost Baseline Criteria. The preparation of a Cost Baseline is essentially an act of establishing the relationship between the cost estimate and timing. For this to be possible, there must be clear criteria that determine which project events trigger payments of cost items included into the baseline and how long the intervals between the trigger events and the related payments are (see Figure 7.12). For payments of vendors, for instance, the trigger events are usually milestones defined in the contractual terms that stipulate how and when the payments are to be made. In other times, such as paying salaries of project management team members, labor schedule of their engagement is what triggers their payment at the end of the month. The intervals, whether for payments within or outside the organization, are dictated by the time needed for internal and external communications, approvals and administrative procedures, and company policies bent to keep money as long as they can [19]. Performing an appropriate analysis of the criteria and defining them in a written form is highly advisable for it becomes a crucial foundation for tabulating costs by periods in the process of cost baselining.
Allocate Cost Items to Time Periods. When the type of the baseline is chosen, cost items to be included into the baseline identified, and criteria for baselining defined, the foundations for allocating cost to time periods are laid down. Then you should address coding and arrangement of cost items. Preferably, the project would have its own cost codes (column 1 in Figure 7.11) that are consistent with the company's cost coding system or industry standards. This may not be possible when the project is externally funded, because the customer may mandate the use of its own cost codes. Items from column 2 may be arranged in different ways. If a Cost Baseline is being developed on the basis of the Bottom-up Estimate, the items can be arranged in line with WBS, as we have done in Figure 7.11, using work packages from the WBS for a project. When an analogous or Parametric Estimate is being used to construct a Cost Baseline, other methods to arrange the items can be deployed.
Column 3 provides cost estimates for the items, which will now be allocated to certain time periods in a nine-month project. Since the reporting is on a monthly basis, time periods are months represented in columns 4 to 12. Item 1.01, Develop Specs, will be carried out in months 1 and 2, so part of the estimated $10K will be expended in month 1 and the remaining part in month 2. How much will be allocated to each month hinges on the following factors [19]:
- The project schedule, indicating the planned start and end dates of the item, along with resource histograms specifying resource requirements by time period (see the box that follows, “Simple S-Curves in a Complex Microprocessor Project”)
- The contractual terms
- Intervals between trigger events and payments
Working off these information inputs, from the estimated $10K for item 1.01, $8K will be distributed to month 1 and $2K to month 2, and entered over a bar in Figure 7.11. Similarly, estimates for the remaining items are spread over their months of execution and entered over their bars. These bars are actually the schedule for the project in the form of bar chart. The schedule is rarely drawn on the Cost Baseline, but we included it in Figure 7.11 to make the baseline easier to comprehend.
Sum Estimated Cost by Period. Once all item cost estimates are allocated to specific time periods, the next action is to sum estimated cost by periods as is shown in the last row of Figure 7.11. Apparently, this provides information about incremental expenditures by time periods—that is, expenditures for each month—which will be used in the next step to display the Cost Baseline graphically.
Display the Cost Baseline. S-curve is a popular way of displaying Cost Baseline formatted as cumulative expenditures (see Figure 7.13). To figure out cumulative expenditures, add the incremental expenditures for the first period to those of the second period. These are the cumulative expenditures for the first two periods. Add this number to the third period's incremental expenditures to obtain the cumulative expenditures for the first three periods, and continue with this procedure for the remaining periods. When done, graph the cumulative expenditures on y-axis over time (x-axis) to develop Cost Baseline in the form of an S-curve. As in any type of the cost estimate, this is the time to check and review the Cost Baseline. Once the project is over, there is a lot of value in studying how the initial baseline worked over the life of the project, learning the lessons, and using them to improve future Cost Baselines.
Simple S-Curves in a Complex Microprocessor Project
When a microprocessor development project started, management was very clear: they wanted to see a Time-phased Budget for the engineering talent for the project. Starting from the project schedule, the project manager responded by
- Specifying the monthly needs for each type of desired engineers.
- Translating the needs into S-curves for each type of engineers and the aggregate S-curve for the whole design team composed of all of these engineers, who at one time peaked at almost 300.
The S-curves were used for multiple purposes. The aggregate S-curve including person-months over project schedule served as a baseline for a simplified version of the earned value measurement. Also, the curve was expressed in dollars that management had to secure for paying the engineers' salaries. Since all of the engineers were not available in the company, the S-curves for individual engineering types were also used for timely preparation and hiring in the job market.
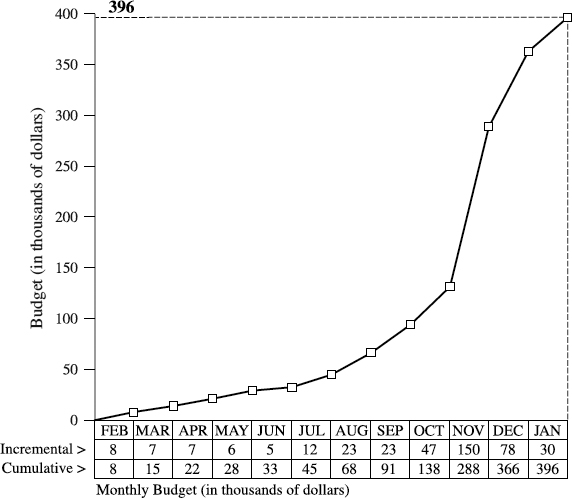
Figure 7.13 A Cost Baseline displayed as an S-curve.
Utilizing Cost Baseline
When to Use. Most experts believe that cost baselining is definitely a redundancy in small projects, because the cost of its preparation may easily outweigh the benefits [19]. In contrast, other projects do have a need for the Cost Baseline. Typically, the baseline is developed as part of initial project planning to forecast its cash flow. Considering that the Cost Baseline may be based on an analogous, parametric, or bottom-up cost estimate, sometimes as the estimates evolve and become more accurate, so do the Cost Baselines. They are reissued at regular or irregular intervals and may even constitute part of project reports submitted to higher management or external customers [1]. For details about updating and changing the baseline, see the box that follows, “When Should You Update or Change the Budget?”
Time for Development. As a function of the size and complexity of the project and its schedule, resource requirements and cost estimate, the time to develop a Cost Baseline may widely vary. The development of a Cost Baseline based on a low-detail Analogous Estimate and summary schedule may consume an hour or two of the skilled team's time. On the other hand, an experienced project team may spend tens of hours constructing a cost baseline based on a very detailed Bottom-up Estimate, with hundreds of activities in the schedule, much less, though, than what it would take a less skilled team.
When Should You Update or Change the Budget?
Dogmatically sticking with the initial Cost Baseline or Time-phased Budget when there is a need to alter it serves no purpose and is unrealistic. This need for alteration is of a managerial or control nature and is really triggered by several factors, leading to minor (updates) or major revisions (changes) of the baseline. Updates may occur because of factors such as [1]:
- Cost estimate evolvement. As the project progresses, more information becomes available, helping develop more accurate estimates from analogous or parametric to the bottom-up one. Such changes in estimates should lead to the update of the baseline.
- Project changes. Management of these changes may require new expenditures, which should be added to the baseline. Changes may be due to unforeseen conditions or from customer-generated changes.
- Schedule changes. Changes of time-phasing of project activities during the execution stage are frequent and result in inevitable modification of the baseline.
In addition to these updates (minor revisions), there may come times when a major revision of the baseline may occur. During the project implementation, major unplanned schedule, cost, or technical problems may occur. Or, there may be a need to change the project strategy. These, typically, prompt major revision of the project plan, including a major revision of the Cost Baseline. Such changes to the Cost Baseline may happen very rarely, once or twice in the life of a project, if at all. Whether dealing with updates or changes to the baseline, the key is to manage all these modifications and related factors in a proactive rather than a reactive way and maintain the control of the project.
Benefits. The lack of an effective Cost Baseline, even if a cost estimate and labor requirements are available, poses a major threat to a project—organizing measurement of performance and cash flow is difficult, if not impossible. Therefore, constructing the baseline offers benefits of using it as a performance measurement baseline (see the “Earned Value Analysis” section in Chapter 13). In this capacity, the baseline is a basis for comparing actual costs (and when they occurred) with planned costs (and when they were supposed to occur) [1]. This, then, is a way to gauge efficiency and progress, attracting management's attention to any deviations from planned progress and estimated costs.
Cash flow forecasting is another major value that an effective baseline may create. It informs management or the customer in advance of the funds that must be made available in order to procure resources and use them to sustain project progress. When properly performing this role in the course of the project implementation, the Cost Baseline should be modified to reflect performance and progress to date. Some risky consequences of not managing cash flow in a project, and how to avoid them, are described in the box that follows, “The Museum Design Company (MDC).”
Advantages and Disadvantages. The operation of cost baselining is relatively simple, whether performed manually or with the help of a computer. Additionally, the visual power of displaying it in an S-curve format is impressive, further strengthening the case of its simplicity. Contrast these two major advantages with its major disadvantage, Cost Baseline's often time-consuming nature, a possible burden on an already busy project team.
Variations. As explained earlier, Cost Baselines come in different shapes, some measuring expenditures (cash outflows), others received payments (cash inflows) or committed costs, still others indicating expended labor hours. Since the project schedule is a critical input in cost baselining, these may be based on project activities' early start dates, or late start dates, or their averages. Other names for Cost Baseline/Time-phased Budget are cash flow schedule, project budget, and performance measurement baseline.
The Museum Design Company (MDC)
MDC found itself in what appeared to be a paradoxical situation: It had a bunch of contracts but no positive cash flow. How was this possible? Loaded with top design talent and known for a strong track record of superb technical quality, MDC had no difficulty landing project contracts to design the military museum exhibits. But John Riddle Jr., CEO of MDC and an accomplished designer, had to borrow from his bank almost each month to make the payroll. Puzzled by this, Jr. asked for professional help. He was advised to look into cash inflow and outflow S-curves for each project. Since those were not available, project managers developed the curves with the help of the consultant. The majority of them looked like the ones in Figure 7.14a. Apparently, the difference between the funds obtained from the customer (cash in) and payments paid for designers' salaries, overhead, and loan interests (cash out) was negative cash flow all the way through the project except at the end when it was zero. This was the source of the paradox, which eventually could make MDC go out of business and made MDC borrow from the bank, eating up its own profits. Jr. concluded that this negative cash flow situation must be avoided at all costs in future projects. The idea was to make the difference between cash in and cash out positive (Figure 7.14b), enabling MDC to eliminate the need for costly loans and stay in business. After a careful explanation, the customer accepted the idea.
(a) Negative cash flow (b) Positive cash flow
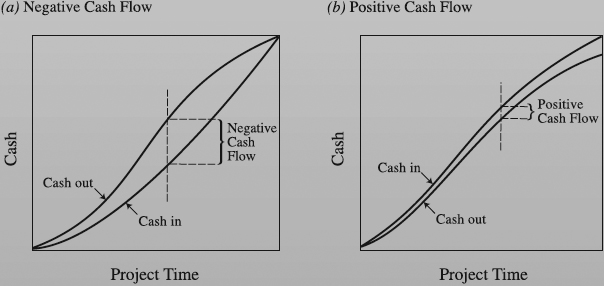
Figure 7.14 Two possibilities: negative and positive cash flow.
| Customization Action | Examples of Customization Actions |
| Define limits of use. | Adjust to the standard used in the industry. For example, use Cost Baseline expressed in labor hours rather than expenditures for internal software projects. Base on averages of early and late start dates. Use cash flow (inflow and outflow) for externally funded projects. Base on early start dates of activities. |
| Add a new feature. | Enter 100 percent on the top of the right vertical axis of the S-curve. Add the remaining percentages in 10 percent intervals. These percentages indicate percent complete in the project (popular with technically oriented project managers favoring percent complete for progress measurement and reporting). |
| Modify a feature. | Include a new column in the form in Figure 7.11 between code and items columns to designate the control account plan for each item (this is for companies employing formal earned value measurement). |
Customize the Cost Baseline. Given the available variations of Cost Baseline, adapting them to best account for your specific needs is a good proposition. See simple examples of such actions to help you visualize possible customization on page 257.
Summary
This section covered the Cost Baseline, a Time-phased Budget used to measure and monitor cost performance on the project. Typically, the baseline is developed in larger projects as part of initial project planning to forecast its cash flow. Developing the baseline offers benefits of using it as a performance measurement baseline. In that way, the project team can gauge efficiency and progress, attracting management's attention to any deviations from planned progress and estimated costs. In the end, key points in developing the Cost Baseline are listed in the box that follows.
Concluding Remarks
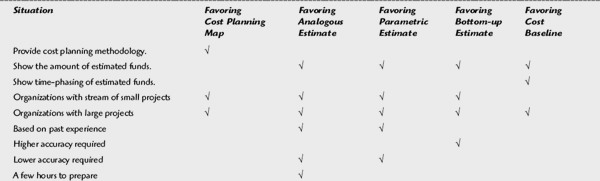
This chapter featured five tools with clearly designed purposes. For two of them, Cost Planning Map and Cost Baseline, the purposes are so distinct that they do not compete with other tools for project manager's attention. While the Cost Planning Map strives to establish a systematic methodology for cost planning, the Cost Baseline aims at providing a time-phased budget. The remaining three tools may be used in combination or the most appropriate one of them can be chosen. That calls for matching the project with situations in the list that follows and understanding marks that show how each situation favors the tools. If these are not sufficient to characterize the project, add more of them and mark how they favor the tools use. The tool with the highest number of marks is probably the most appropriate to deploy.
Cost Baseline Check
Check to make sure you developed a proper Cost Baseline. The baseline should show
- Cost code
- Item descriptions
- Item cost estimates
- Item budget by period
- Project budget by period
- Cumulative, to date budget for the project
- S-curve (if a choice of display).
A Summary Comparison of Cost Planning Tools

References
1. Harrison, F. L. 1983. Advanced Project Management. Hunts, U.K.: Gower Publishing Company.
2. Roetzheim, W. H. and R. A. Beasley. 1995. Software Project Cost and Schedule Estimating: Best Practices. Upper Saddle River, N.J.: Prentice Hall.
3. Stewart, R. D., R. M. Wyskida, and J. D. Johannes. 1995. Cost Estimator's Reference Manual. 2d ed. New York: John Wiley & Sons.
4. Westney, R. E. 1997. The Engineer's Cost Handbook. New York: Marcel Dekker.
5. Boehm, B.W. 1984. “Software Engineering Economics.” IEEE Transactions on Software Engineering 10(1): 4–21.
6. Pressman, R. S. 1992. Software Engineering: A Practitioner's Approach. 3d ed. New York: McGraw-Hill.
7. Gulledge, T. R. and W. P. Hutzler. 1993. Analytical Methods in Software Engineering Economics. Berlin: Springer-Verlag.
8. Kile, R. L. and U.S.A.F.C.A. Agency. 1991. REVIC Software Cost Estimating Model User's Manual version 9.0. Arlington, Va.: Revic Users Group.
9. American Association of Cost Engineering. 1990. Standard Cost Engineering Terminology; AACE Recommended Practice and Standard No. 10S-90. Morgantown, W.V.: American Association of Cost Engineering.
10. Birrell, N.D.A. 1985. Practical Handbook of Software Development. Cambridge, Mass.: Cambridge University Press.
11. Project Management Institute. 2000. A Guide to The Project Management Body of Knowledge. Drexell Hill, Pa.: Project Management Institute.
12. Humphreys, K. K. and L. M. English. 1992. Project and Cost Engineers' Handbook. 3d ed. New York: AACE and Marcel Dekker.
13. Kemerer, C.F. 1997. Software Project Management. Boston: McGraw-Hill.
14. Smith, N.J. 1995. Project Cost Estimating. London: Thomas Telford.
15. Institution of Chemical Engineering, I. and A.o.C. Engineers. 1977. A New Guide to Capital Cost Estimating. Rugby, U.K.: The Institution of Chemical Engineers.
16. Stewart, R. D. 1991. Cost Estimating. 2d ed. New York: John Wiley & Sons.
17. Reifer, D. J. 1993. Software Management. 4th ed. New York: IEEE Computer Society Press.
18. Marciniak, J. J. and D. J. Reifer. 1990. Software Acquisition Management. New York: John Wiley & Sons.
19. Lock, D. 1990. Project Planner. Aldershot, U.K.: Gower Publishing.