6
Schedule Development
You win battles by knowing the enemy's timing, and using a timing which the enemy does not expect.
Miyamoto Musashi
Major topics in this chapter are schedule development tools:
- Gantt Chart
- Milestone Chart
- Critical Path Method Diagram
- Time-scaled Arrow Diagram
- Critical Chain Schedule
- Hierarchical Schedule
- Line of Balance

Figure 6.1 The role of schedule development tools in the standardized project management process.
These tools will help successfully develop a calendar-based project schedule. Schedule development tools are deployed in coordination with scope and cost planning tools to culminate in an integrated project plan (see Figure 6.1). A significant role in that effort belongs to tools of the facilitating processes such as team, quality, and procurement planning, and risk response development. This chapter seeks to help practicing and prospective project managers accomplish the following:
- Become familiar with various schedule development tools.
- Select a schedule development tool that fits their project situation.
- Customize the tool of their choice.
These are critical skills in project planning and building the standardized PM process.
Gantt Chart
What Is the Gantt Chart?
Using bars to represent project activities, the Gantt Chart shows when the project and each activity start and end against a horizontal timescale (see Figure 6.2). Although the Gantt was developed around 1917 and is the oldest formal scheduling tool, it is still widely used. It is also called the bar chart.
Constructing a Gantt Chart
Developing a Gantt Chart takes several steps. Though the first step—determine level of detail and identify activities—is normally part of scope planning, we include it here in order to provide an integrated procedure.
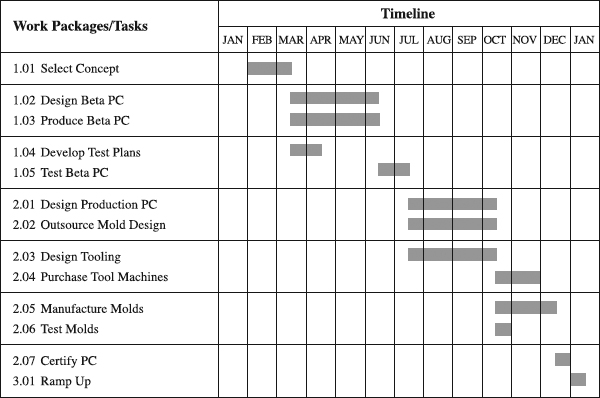
Figure 6.2 An example of the Gantt Chart.
Prepare Information Inputs. The quality of the Gantt Chart is firmly rooted in quality inputs about the following:
- Project scope
- Responsibilities
- Available resources
- Schedule management system
Information about the scope helps schedulers analyze and understand the project activities that are being scheduled. Naturally, those responsible for the execution of the activities should be in the best position to schedule them, because they are the best source of knowledge about the activities. Part of their knowledge relates to priorities, activity sequencing, and duration estimating. Another part of their knowledge relates to what resources are available and in which time periods. Still another part of their knowledge is the schedule management system, a method leading companies deploy to ensure their schedules are systematically developed and used (see box that follows, “Schedule Management System).
Determine Level of Detail and Identify Activities. How many activities should there be in the Gantt Chart? Twenty-five? Fifty? Seventy-five? The answer will determine how big the individual activities will be. Consider, for example, a practice in a company. For a certain type of project, the team's decision is that a typical Gantt Chart will have around 25 activities, with no activity longer than three weeks and shorter than one week. This provides guidance for the next step and ensures that the chart is just about the right size, neither too cumbersome and time-consuming nor too small, lacking necessary information to manage. Specifically, the amount of detail should be enough for the intended user to monitor progress and for coordination. However, the amount of detail should not be so great that it cannot be easily statused using the project's progress reporting systems. Note that it may take some practice before you establish the right level of detail.
Brainstorming and breaking the project down into constituent activities that need to be performed in order to get the project done is next. Or, you can enlist the help of the Work Breakdown Structure (Chapter 5) for this purpose, identifying activities necessary to achieve work packages in WBS. At this time, you don't need to worry about how big the activities are; rather, the emphasis is on making sure that all necessary activities are identified. Once that point is reached, refer to the level of detail established in the previous step. If the level tells there are too few activities, breaking down some of them to hit the desired level of detail is a natural choice. Or, if there are too many activities, it is helpful to combine similar ones to arrive at the desired level.
Schedule Management System
Scheduling a project is rarely a matter of sitting down and developing a single schedule before the project starts. The process of developing and using schedules needs to be planned and organized [2]. To ensure such an approach, leading companies tend to resort to a schedule management system, determining the following:
- What schedules are needed? Depending on the size of the projects, you can use a hierarchy of schedules for larger projects (see the Hierarchical Schedule section later in this chapter) or a single schedule for small projects, as well as preliminary and implementation schedules.
- How schedules will be used? Some schedules, such as a summary one, can be used for management oversight, while detailed schedule can be used for organizing work.
- What is schedule detail? Limiting the number of activities in a schedule, such as up to ten in a milestone schedule, is an attempt to preempt unnecessary detail and waste of time.
- What tools will be appropriate? Any of the tools in this chapter are appropriate, if used for their design purpose.
- When will the schedules be prepared? Whenever possible, before the project starts. In uncertain projects, a rolling wave concept may be applied: Prepare a front-end schedule for the first 60 days of a project, then develop a more detailed schedule as the project unfolds.
- How schedules will be monitored and updated? Frequency and schedule control tools need to be defined in tune with needs of a company.
Scheduling can be overkill, unless an appropriate measure of scheduling is found. Developing a schedule that is more detailed than necessary is as useless as the schedule that management cannot follow or understand. Inappropriate scheduling emphasis like this may easily turn people against scheduling and create the attitude of “how about stopping this red-tape exercise and get down to real work?” It is the job of the schedule management system to prevent this.
Sequence Activities. Sequencing activities involves arranging them in a logical order of execution. This requires a good knowledge of the technology and priorities of the project and ensures that we first perform activities that need to produce outputs necessary for work on the subsequent activities. Illogical sequence of activities is destined to cause rework and slow down the project.
Estimate Activity Durations. Resources, human and material, drive the process of estimating activity durations. Begin the process by asking, “What resources do I need to successfully complete this activity?” The answer should provide the names of resources and work time for each one of them to complete the activity; for example, 100 hours of work from a programmer. Next, knowing the availability of a resource and the company's work calendar (e.g., no work on Sundays), convert the work time into calendar time. For instance, because she is involved in multiple projects, the programmer's 100-work time hours will have to be spread over 12 weeks to get her job done. This should be repeated for each activity.
Draft and Refine the Gantt Chart. Drawing a Gantt Chart requires a sheet or form with a horizontal timescale and the list of activities across vertical axis (see Figure 6.2). Adding up calendar times for project activities gives a rough idea of the total time the timescale needs to show. Adding to it a bit of spare time is helpful to improve the visual impact and have space for possible changes in the future. This is a good scale for a chart in which all activities are sequential. Should there be overlapping activities, you can reduce the duration of the timescale accordingly.
Next is listing all activities on the vertical axis per determined sequence, followed by these steps:
- Draw a barrepresenting each activity, with its length proportional to its duration on the timescale.
- For multiple activities that form a phase of work, add a summary bar, called a hammock activity or simply a hammock, just above the first activity. A hammock begins when the first of the activities begins and ends when the last of the activities ends. A reasonable measure is to have a hammock activity for every four to ten detailed activities that relate to each other. Because management needs a big-picture view of the project, the hammocks' summary level of detail makes them very convenient for that purpose.
- Look again at the whole chart. Are all necessary activities there? Logically sequenced? With appropriate timescale and reasonable durations? Make any changes necessary to finish refining the chart and get ready to use it.
Utilizing the Gantt Chart
When to Use. The Gantt Chart is an effective tool for smaller and simpler projects, where there is no need to show dependencies between activities, since they are well known to all involved planners [11]. As the project size and complexity increase, the Gantt Chart becomes less applicable. Simply, the chart gradually looses the ability to handle the increasing number of activities, data, and dependencies between activities involved. In large and cross-functional projects, using the Gantt Chart as the primary scheduling tool is impractical and ineffective (see the box that follows, “Tips for Gantt Charts”).
In contrast, in large and complex projects, the complementary use of the Gantt Chart and CPM chart may be a very smart strategy. The latter effectively copes with number of activities, data, and dependencies between activities involved. It, however, does a poor job of showing to project people in a simple and visual manner what activities to work on in the next week or the next two weeks. That is where the Gantt Chart may step in. Extracting from the sizable CPM chart activities due in the next week or two, presenting them in the Gantt Chart format, and handing to the people portions of the Gantt Chart they are responsible for provides clear and practical partial short-term outlook schedules. Those in management will still be responsible to coordinate the interfaces between the owners of the schedules.
Time to Develop. Depending on one's knowledge and experience, a 20-activity Gantt Chart can be developed in anywhere from 10 to 40 minutes. Some experienced project managers use the rule “activity per minute,” meaning it should take one minute for each activity in the Gantt Chart. Note that the more people are involved in the Gantt Chart development, the more time may be needed.
Benefits. Having a Gantt Chart helps ensure that everyone understands the timetable for project activities. Then, project participants will have the necessary time allocated on their calendars and be available to perform their activities.
Advantages and Disadvantages. The chart has the advantages in that it is
- Visual. It creates a pictorial model of the project. This makes it a superb communication tool.
- Simple. With little or no instruction, almost anyone can read or construct a Gantt Chart, from a project team member to the executive sponsor.
- Useful to show both the planned and actual status (see the Jogging Line tool, Figure 12.4, in Chapter 12) of the project.
- Useful in resource planning or allocation. First marking on each activity the numbers of different human resources and adding them up for each time period helps get the total number of a certain resource over time for each activity and the whole project (see the Cost Baseline tool in Chapter 7).
- Rely on Gantt Chart as long as it has fewer than 25 activities.
- Use a single Gantt Chart as a primary scheduling tool in small, simple, functional projects.
- Don't use a single Gantt Chart as a primary scheduling tool in large, complex, cross-functional projects.
- Team-developed Gantt Charts lead to higher quality, better buy-in, and stronger commitment of team members.
Gantt Charts have disadvantages that may limit its relevance. In particular, they
- Do not show dependencies between activities, making it impossible to clearly identify the sequence of project activities and, consequently, the critical path. Without this information, Gantt Charts are not effective in large and cross-functional projects.
- Cannot cope effectively with projects containing large number of activities, measured in hundreds, for example. This can be overcome by using hierarchical Gantt Charts, in which an activity in a higher-level Gantt Chart is broken down into more detailed activities in the lower-level Gantt Chart (see the section “Hierarchical Schedule” later in this chapter).
Customize the Gantt Chart. The Gantt Chart we have presented here is no more than a generic one. You can expect to get maximum value out of it only if its format and features are adapted according to your own needs. Here are some examples of how this can be accomplished.
| Customization Action | Examples of Customization Actions |
| Define limits of use. | Use Gantt Charts for functional projects or phases of a large project with fewer than 25 activities. |
| Use Gantt Charts for cross-functional projects with fewer than 25 activities, only if team members have excellent knowledge of their interdependencies. | |
| Develop templates that can be used as a starting point in charting Gantts for new projects. | |
| Add a new feature. | Add a column showing the owner of the activity. |
| List resources under each activity. | |
| Add major milestones to the chart. |
Check to make sure you developed a good Gantt Chart. The chart should have
- All necessary activities to complete the project
- A logical sequence of the activities
- Activities with reasonable durations
- An appropriate timescale.
Summary
The focus of this section was on the Gantt Chart, a tool that uses bars to represent project activities and shows when the project and each activity start and end against a horizontal timescale. The Gantt Chart is an effective tool for smaller and simpler projects, where there is no need to show dependencies between activities, since they are well known to all involved planners. Having a Gantt Chart helps ensure that project participants will have the necessary time allocated on their calendars and is available to perform their activities. Customizing the chart for specific project needs enhances its value. The following box recaps the key points in building the Gantt Chart.
Milestone Chart
What Is the Milestone Chart?
This chart shows milestones against the timescale in order to signify the key events and to draw management attention to them (see Figure 6.3). A milestone is defined as a point in time or event whose importance lies in it being the climax point for many converging dependencies. Hence, “Complete requirements document” is a distinctive milestone for software applications development projects, and “Complete market requirements document” is a characteristic milestone for product development projects. While these milestones relate to the completion of key deliverables, other types may include the start and finish of major project phases, major reviews, events external to the project (e.g., trade show date), and so forth.
Developing a Milestone Chart
A relatively simple procedure for developing a Milestone Chart includes several steps that build heavily on a schedule with activity dependencies that is constructed in a separate procedure. We nevertheless include it here in order to present an integrated picture of Milestone Chart development.
Prepare Information Inputs. A Milestone Chart is as good as its inputs are, specifically:
- Project scope
- Responsibilities
- Schedule management system
- Project schedule, possibly one that shows dependencies.
Having a solid definition of the project scope provides those who schedule with a good understanding of the milestones being scheduled. The quality of the chart is certainly expected to be higher when the owners of milestones are responsible for their scheduling (see the box that follows, “Who Owns Schedules?”) and follow guidelines established in the schedule management system (see the “Schedule Management System” box earlier in this chapter). If scheduling of milestones is based on the previously developed detailed schedule, the quality of the chart is bound to further improve.
Prepare a Detailed Schedule Showing Activity Dependencies. This may be any of the network diagrams described in this chapter. Their value is in dependencies between activities that they show. The schedule should be used later in the step of sequencing milestones.
Who Owns Schedules?
Involvement of project participants in developing schedules hinges to a great extent on the organizational strategies for project management. In the matrix environment, for example, many players are involved—team members, project managers, functional managers, the project office, and executives.
Team members typically own work packages/tasks, reporting their completion and estimating how much more time will be necessary to complete each unfinished work package or task. While they have to know some scheduling terms, such as start date, finish date, data (reporting) date, resource availability, and so on, there is no need for their extensive knowledge of scheduling theory. As providers of resources to a project, functional managers care about the accuracy of the estimates and availability of resources when projects need them [6]. Like team members, their knowledge of scheduling theory is basic.
Project managers are the ultimate users and owners of the project schedule. They facilitate schedule development and monitor the data furnished by team members for completeness and feasibility. Then they run data and schedules on a computer or use the project office for this purpose and check out the results. Finally, they communicate with functional managers and make schedule modifications. They need a decent amount of knowledge about scheduling theory. The project office (or the scheduling group) should have theoretical scheduling experts who are capable of designing and maintaining a project scheduling system in which all other players have to fit. Also, their knowledge in running scheduling software and checking out time, cost, and resource estimates in order to support the system and individual projects in need is essential.
The job of executives in project scheduling is not about scheduling theory, tools, or software. Rather, their focus is on asking questions, reading reports, directing project-related personnel and providing overall support. Like a well-conducted orchestra of master musicians, these players need to synchronize their actions to produce a meaningful scheduling concert.
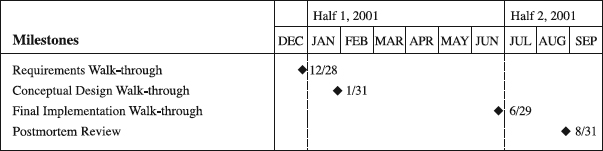
Figure 6.3 An example of the Milestone Chart.
Select the Type of the Milestone Chart. Again, you may develop a management type of the chart with only a few high profile milestones intended to entertain managers or outside stakeholders. Another option may be a working type of the chart designed to help manage work to get milestones accomplished. Which one is better? It depends on the situation. An example may help visualize this question. For a certain type of project, the company can use high-level Milestone Charts with five standard milestones identified as break points between project phases. At these milestones, senior management reviews the project and decides to either continue or kill the project. In addition, the company uses a more detailed chart with 14 milestones, at which the project team reviews major project deliverables. For another example of such a chart, see the “Management Milestone Chart” box that follows. Selecting the type of chart and clearly defining its purpose is an important step in building the Milestone Chart.
Select Milestones. In this step we let the type of the chart that is chosen guide the selection of the desired milestones. Consider all types of milestones—key deliverables, start and finish of the project and its major phases, major reviews, important events external to the project, and so forth. Which ones are key to the project progress? If a company uses standard milestones, the answer is simple: those same standard milestones. If this is not the case, consulting management may help in making the choice.
Sequence Milestones. Sequencing milestones is about studying dependencies between activities and comprehending how their outputs will converge to a culmination point—the selected milestone. Marking their position in the detailed schedule will provide their sequence, indicating which activities have to be started or completed to proclaim that this milestone is accomplished.
Management Milestone Chart
These milestones are eight sacred cows in one company's product development projects: product concept approval, requirements definition, plan and specs review, design complete, product evaluation review, launch plan, launch complete, and product release. Spanning from one to two years and costing millions of dollars, these projects are the company's engine of growth. The milestones signify the end of key phases and require upper management review. They are displayed in the management milestone chart that is used to report progress to senior management.
- Don't cram milestones. Space them out.
- Use both charts for key events and detailed milestones.
- Use the charts in both large and small projects for both the plan and actual project progress.
- Use the chart in conjunction with another schedule showing activity dependencies.
- Team-developed Milestone Charts lead to higher quality, better buy-in, and stronger commitment of team members.
Draft and Refine the Milestone Chart. Once milestones are marked on the detailed schedule with activity dependencies, the Milestone Chart is essentially drafted. This is the time to ask the following questions. Are all necessary milestones there? Are they logically sequenced? In appropriate positions on the schedule? It is important to ensure that enough milestones have been chosen so as not to have a prolonged period where there are no milestones. It is easy to select all milestones at the project beginning and end, where many activities start and complete. However, that would leave the middle void of milestones, reducing the ability to control project progress. As these questions get answered, the information will be created to make any changes and distill the chart.
With milestones marked on the schedule, two points should be discernible. The first is the laborious work that must be done. Second, the selected milestones that signify keys to the project progress must stand out so as to avoid getting lost in the details of the laborious work. In short, not only should the trees (details) be evident, but the forest (milestones) as well.
Finalize the Milestone Chart. Quite understandably, managers won't like to bother with detailed schedules. Rather, they will ask for a chart showing only milestones so they can glance and figure out key data on project progress. You should use information from the detailed schedule with milestones—timescale, milestone names, and time positions of milestones—in order to prepare the Milestone Chart (see Figure 6.3). To do so, list milestones on the vertical axis of a sheet, draw the timescale across the horizontal axis, select symbols for milestones (diamond, for example), and place the symbols across the timescale. (Also see the box above, “Tips for Milestone Charts.”)
Utilizing the Milestone Chart
When to Use. Traditionally, the Milestone Chart has been used to focus management on highly important events whether projects are large or small [12]. As a result, when used for this purpose, the chart typically shows a few key milestones. In other words, use the chart to provide key data on the planned and actual project progress to higher management. When the WBS is used in the project, these highly important events and key data are usually related to level 1 in the WBS. Recent developments have seen the increased use of multiple Milestone Charts at a time, whereas each chart corresponds to a certain level of WBS. Consequently, a chart on level 4 of a five-level WBS, for example, may easily have a couple of hundred milestones, each one tied to a work package. The chart is then used in conjunction with a detailed network diagram chart so that the effect of dependencies on milestones is discernible. This practice is well accepted in technology organizations that compete on fast project cycle times (see the “Hierarchical Schedule” section later in this chapter).
Time to Develop. The development of a chart with several key milestones can take 20 to 30 minutes, while a Milestone Chart with 300 milestones may take several hours, provided that a more detailed schedule with dependencies was previously prepared. Should more people be involved, you can expect the time necessary for the development to grow because of more interface among participants.
Benefits. A chart with a few key milestones—related to level 1 of WBS, for example—is in a solid position to capture and enjoy management attention and time with high profile project events (see the box that follows, “The Lack of Milestones May Kill Thousands”) [13]. Not so with charts including many milestones linked with work packages. The gain from such charts is the ability to beef up the emphasis on goal orientation (“milestone accomplished” or “milestone not accomplished”), while reducing focus on activity orientation (“I am working on it”).
Advantages and Disadvantages. The chart has the advantages in that it is
- Visual. It creates a pictorial model of the project ideal for effective communication between project team and management, and within project team.
- Simple. Minimal or no training is necessary for project participants and their managers to develop or interpret a Milestone Chart.
- Useful as both planning and tracking tool.
The Lack of Milestones May Kill Thousands
Napoleon, a master of warfare, never made more than the sketchiest plans even for his great projects [1]. Those sketchiest plans probably resembled milestones to signify key events in a campaign. When he invaded Egypt, he did so making his expectations clear to each of his generals. Their effort proceeded very much per this high-level schedule, leading them to the zenith of glory. In contrast, when Napoleon invaded Russia with his 400,000+ troops in June of 1812, he chose not to communicate the plans. Despite his generals' desire to have the plans communicated because of the harsh Russian winter, Napoleon never shared them. In December of 1812, Napoleon's defeated army left Russian soil, this time numbering only 20,000+ troops. The lack of a clear milestone schedule might have contributed to the finale of Napoleon's Russian campaign—from the zenith of glory to ashes.
Check to make sure you developed an effective Milestone Chart. The chart should have the following:
- Key milestones
- A logical sequence of milestones based on activity dependencies
- Well-spaced-out milestones
- Milestones appropriately positioned on the timescale
The Milestone Chart's disadvantages include the following:
- When used separately from a detailed schedule with activity dependencies, it is difficult to understand how to reach a milestone. This is especially true when the chart includes many milestones.
- As the number of milestones grows, the chart loses its appeal. By being overcrowded, it may become ineffective in managing the work, thereby defeating its own purpose. Coupling it with a schedule with activity dependencies may be the best option to mitigate risks associated with detailed Milestone Charts.
Customize the Milestone Chart. The features of the Milestone Chart that we have described so far are of a generic nature. To get the real value out of the chart, the project team has to customize it to fit specific needs of their project. Here are some examples of how that can be done.
Summary
This section discussed the Milestone Chart—a tool that shows milestones against the timescale in order to signify the key events in the project. Traditionally, the Milestone Chart has been used to focus management on highly important events, whether the project is large or small. It can also help strengthen the emphasis on goal orientation while reducing focus on activity orientation. Its value can be additionally improved if the chart is customized to specific project needs. In the following box, we summarize the key points in the Milestone Chart.
| Customization Action | Examples of Customization |
| Define limits of use. | Use the Milestone Chart only for events on level 1 of WBS, with no more than six milestones on the chart. |
| Develop templates that can be used as a starting point in constructing milestones for new projects. | |
| Add a new feature. | Add a column to show the owners of milestones. |
| Link the milestones to indicate dependencies. |
Critical Path Method (CPM) Diagram
What Is a CPM Diagram?
CPM is a network diagram technique for analyzing, planning, and scheduling projects. It provides a means of representing project activities as nodes (see Figure 6.4) or arrows, determining which of them are “critical” in their impact on project completion time and scheduling them in order to meet a target date at a minimum cost [14].
Building a CPM Diagram
Constructing a CPM schedule is an exercise in patience and discipline that involves proceeding through several major steps. In it, as with all schedule development tools, a crucial step is to determine the level of detail and to identify activities. Although the step usually belongs to the scope planning process, we include it here. That helps explain this tool development in an integrated way.
Prepare Necessary Information. The process of building a CPM schedule is destined to produce a better product if quality information about the following inputs is developed:
- Project scope
- Responsibilities
- Available resources
- Schedule management system.
In this context, the purpose of the information about the scope is to provide schedulers with the knowledge of the project activities that are being scheduled. Clear definition of responsibilities—who does what in the project—points to who has the best information about the individual activities and should therefore schedule them. To develop realistic schedules, these “owners” of the activities also need to know which resources are available and when. Finally, the schedule management system will direct schedulers in developing and using the CPM diagram (see the “Schedule Management System” box earlier in this chapter).
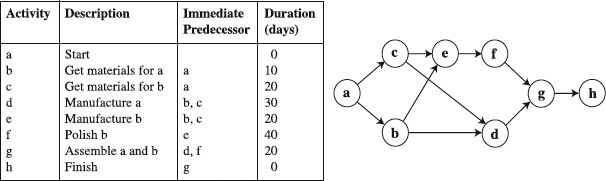
Figure 6.4 An example of a CPM Diagram.
Why a Team Approach to CPM Development?
Using a project team to build a CPM diagram is perhaps the most effective way of doing it. Here is why:
- Team members are usually the best source of knowledge about their piece of the schedule.
- Each team member can see where and why he or she is critical to the success of the project.
- The team can find creative ways to best sequence and shorten the duration of activities and the total project.
- As a unit, the team can focus its energy and mind on mission-critical activities.
- Involvement of team members enhances commitment and a sense of ownership of the project.
Determine the Level of Detail and Identify Activities. How can large or small individual activities that are identified influence the number of activities in the CPM? A rule at one company may help clarify this point. Large fab construction projects run at around 2000 activities, lasting from two to four weeks. This helps everyone realize what level of detail is acceptable and what is unacceptable. The goal for scheduling is to account for the complexity and size of the project in a way that gives the team enough information—not too little and not too much—to direct the daily work, identify interfaces between workgroups, and monitor progress at an effective level (see the box above, “Why a Team Approach to CPM Development?”).
When the level of detail is set, you are ready to
- Brainstorm and identify activities that are necessary to complete in order to finish the project. This can be done by means of the Work Breakdown Structure, perhaps the most systematic and integrated way of activity identification process (see the “Work Breakdown Structure” section in Chapter 5).
- Refocus the attention on the established level of detail. If the number of activities is lower than the intended number, continue breaking down larger activities. If the number of activities is over the target number, combine similar activities to reach the target.
Sequence Activities. Sequencing is about identifying dependencies between activities by determining an activity's immediate prerequisite activities, called predecessors. A portion of the dependencies will be arranged in pure “technological order.” These are termed hard or logical dependencies, meaning that the technology of work mandates such sequence. An example is that one must write the code before testing it; the other way around is not possible. Disregarding hard dependencies may lead to rework and project delay. But not all of dependencies are hard; some of them are soft or preferential ones. They are not required by the work logic but set by choice, reflecting one's experience and preferences in scheduling. For example, we may decide to write part of code, test it, write another part, test it, and so forth. Dependencies may also be dictated by availability of key resources. If two activities require the same resources, one will have to follow the other. Once the dependencies are established, they can be recorded, as we have done in the table in Figure 6.4.
Assign Resources and Estimate Activity Durations. The age-old rule of scheduling is that people and material resources get the project work done. As a result, it is logical to estimate an activity's duration by identifying resources necessary to successfully complete it. Consider, for example, 100 hours of work from a business analyst. This is the work (effort) time, which in the case of mature work technologies is calculated by dividing the amount of work by the production norms [15]. With the information that the analyst splits her work time between this and three more projects, and knowing the company's work calendar (50 hours per week only; no work on Saturdays and Sundays), she may need eight weeks to get it done. This is the calendar time. Repeat the cycle of identify resources; figure out work time, convert it to calendar time for all remaining activities, and write the calendar time in the fourth column of the table in Figure 6.4.
Draft a CPM Chart. Each activity is drawn on the network diagram as a circle or rectangle, with identifying symbols and duration within the circle or per convention chosen (Figure 6.4). This format is called AON (activity-on-node). Later in this chapter, we discuss another format of drawing network diagrams, AOA (activity-on-arrow). To pursue the AON format, indicate sequence dependencies by arrows connecting each circle (activity) with its immediate successors, with arrows pointing to the latter. For convenience, connect all circles without predecessors into a circle denoted “Start.” Similarly, connect all circles without successors into a circle marked “Finish.”
Identify the Critical Path (CP). Normally, the diagram shows a number of different paths from Start to Finish, defined as sequences of dependent activities. To calculate the time to pass through a path, add up the times for all activities in the path. The CP is the longest path (in time) from Start to Finish. It indicates the minimum time necessary to complete the entire project. Essentially, CP is the bottleneck route, the highest priority to manage.
There is another way to calculate CP: using the forward/backward pass procedure [16]. While adding up activity times is simpler for smaller projects, it is too cumbersome and difficult for larger projects. Rather, the large projects use the pass procedure [17]. Say, for example, you have the start date for a project. Then, for each activity there exists an earliest start time (ES). Assuming that the time to finish the activity is t, then its earliest finish time (EF) is ES + t. Figure 6.5 shows how to go through the forward pass to calculate ES and EF for each activity. The process, from left to right, is as follows:
- ES is the largest (or latest) EF of any immediate predecessors.
- EF is ES + time to complete the activity (t).
Suppose now that you want to finish the project by the time that is equal to the EF for the project. If so, you can define the concept of late finish (LF), or the latest time that the project can be finished, without delaying the total project beyond EF. Thus, LF is equal to EF. Similarly, you can define late start (LS) as LF − t, where t is the activity time. Building on these concepts, we can go through the backward pass, from right to left, to calculate for each activity (see Figure 6.5):
- LF is the smallest (or earliest) LS of any of immediate successors
- LS is LF − Time to complete the activity (t).
Now that the forward/backward pass is finished, note that Figure 6.5 indicates that in some activities, early start is equal to late start, while in some it is not. The difference between an activity's early and late start (or between early and late finish) is called total float. Total float is the maximum amount of time you can delay an activity beyond its early start without necessarily delaying the project completion time. Free float is another kind of float equal to the amount of time you can delay an activity without delaying the early start of any activity immediately following it. While an activity with the positive total float may or may not have the free float, the latter never exceeds the former. The formula to calculate free float is as follows:
The difference between the activity's early finish (EF) and the earliest of the early start times (ES) of all of its immediate successors.
In our example in Figure 6.5, activity b and d have free float of 5 days and 15, respectively, while all other activities have zero free float. The question is why one needs the two floats.
Activities on the CP have zero total float and are called critical activities. They are shown in Figure 6.5, with thick arrows connecting critical activities on the only CP. It is, however, legitimate to have multiple CPs, a common situation in fast-tracking projects. An activity with zero total float has a fixed scheduled start time, meaning that ES=LS. Consequently, to delay the start time is to delay the whole project, which is why such activities are called critical. In contrast, activities with positive total float offer some flexibility. For example, we can relieve peak loads in a project by shifting activities on the peak days to their late starts. That won't impact project completion time. But this flexibility may vanish quickly. Consider a path with a very small total float, which we call near-critical path, the second-highest priority to pay attention to. If we let an activity on the near-critical path slip, its small total float may be gone and it becomes critical path. In case of the free float, we can delay the activity start by an amount equal to (or less than) the free float without affecting the start times or float of succeeding activities.
Review and Refine. Look closely at the drafted diagram and ask the following questions:
- Has any important activity been left out or forgotten to be included in the chart?
- Is the activity sequencing logical?
- Are durations of activities reasonable?
- Is the project scheduled as time-constrained or resource-constrained? (See box that follows, “Time- or Resource-Constrained? Or Both?”)
Time- or Resource-Constrained? Or Both?
Although Intel is in a constant time-to-market race with its competition, project managers in one of its divisions understand well the problem of the relationship between time and resources when developing their schedules. The problem is in that no matter how fast they want to complete their projects, the availability of resources is limited. This helps classify schedules into [4]:
- Schedules under a time-constrained situation. The project must be finished by a certain time (called the drop-dead date in Intel language), with as few resources as possible. Here, it is time, not resources, that is critical. These are typically projects of higher priority.
- Schedules under a resource-constrained situation. The project must be finished as fast as possible without exceeding a certain resource limit. Here it is resources, not time, that is critical. Projects like these are usually of lower priority.
Between these two extremes are resource-leveling projects with their medium priority. In them, once a schedule is developed, project tasks are shifted within their float allowances to provide smoother period-by-period resource utilization. As long as management clearly communicates in which category each project is, project managers face no problem—most of commercially available software they use already have algorithms to develop schedules for any of the three situations. The trouble arrives when project managers are told their projects are time-constrained but with limited and insufficient resources. Faced with such systems constraints [8], they know they have to find resources on their own. So, what do project managers do? They make do. They throw in overtime, work long hours, convince team members to do the same, and navigate their way through. Most of the time they succeed. After all, Intel's culture is all about performance.
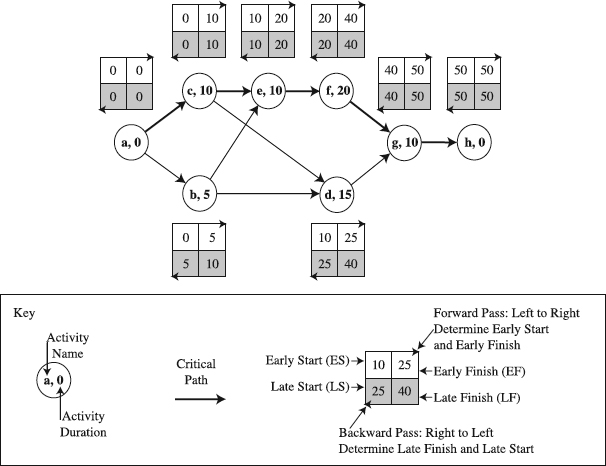
Figure 6.5 Forward and backward pass.
This is the time to answer the questions and, if the answers require, to make necessary corrections.
If the company competes on time, this is also the time to check if it is possible to reduce the project duration. The only avenue to do that is to find ways to shorten activities along CP. This is possible by fast tracking or crashing, or their combination [18]. Note that fast-tracking or crashing noncritical activities is irrelevant, because it does not reduce the duration of CP. Fast-tracking means changing the hard and soft dependencies—in other words, changing the logic of the diagram by obliterating previously established dependencies and creating the new ones. In the process, neither activity durations nor resource allocations will be changed. Simply, this can be done by taking certain activities from CP and overlapping them.
“Crashing” means shortening the duration of activities along CP without changing dependencies. The way to do this is by assigning more people to the activities, working overtime, using different equipment, and so on. The crucial question is whether the gains from the reduction of project duration exceed the costs of acceleration. For the majority in time-to-market projects the answer to the question is yes. For more details, see the “Schedule Crashing” section in Chapter 12.
- If you need to accelerate the schedule, do it by fast-tracking and crashing.
- Watch out! Accelerating the schedule may increase the number of critical activities. While in earlier times 10 percent of all activities were critical, in today's fast schedules, you often see 40 percent to 50 percent of activities being critical.
- Sprinkle major milestones over your CPM chart. It helps you see woods (milestones) and the trees (activities).
- Color-code activities performed by various resource providers in order to identify their interfaces and provide their coordination.
- Develop template CPM charts. Then, use them consistently to develop the schedule for new projects.
Utilizing CPM Diagram
When to Use a CPM Schedule. The CPM tool was originally developed for large, complex, and cross-functional projects [19]. Even nowadays that is the major area of CPM application, because it can easily deal with large number of activities and their dependencies, directing our attention to most critical activities [20]. With the dissemination of PM and CPM knowledge, it is not unusual to see CPM used in smaller projects.
A fine application of CPM can be found in conjunction with the Gantt Chart. In short (see the “When to Use” discussion in the Gantt Chart section), extracting from the sizable CPM Diagram activities due in the next one or two weeks, presenting them in the Gantt Chart format, and handing to the people portions of the Gantt Chart they are responsible for provides clear and practical partial short-term outlook schedules.
Time to Develop. A skilled, smaller project team can take a day to a day and a half to build a 250-activity CPM schedule. As the team grows in size, so does the time it needs for communication and, consequently, CPM development time. Starting the development off a template schedule is a sure way to reduce the time.
Three Don'ts for CPM Diagrams
- Don't let the CPM chart control you. It is just a schedule and won't make a decision for you. You will.
- Don't consider it gospel. If there is a better way to schedule, go for it!
- Don't throw it aside when your project starts slipping. Review it, update, and improve, then use it again!
Benefits. Having a CPM schedule helps the project manager to see the total completion time, understand the sequencing of activities, ensure resources when necessary, monitor those that are critical, and measure progress (or lack of it). This is easier to accomplish if certain rules are followed (see the boxes on page 190, “Tips for CPM Diagrams” and “Three Don'ts for CPM Diagrams”).
Advantages and Disadvantages. CPM offers
- Graphic appeal. CPM is easily explainable, even to the laypeople, by means of the project network diagram that clearly charts the technological order of work. Data calculations are not difficult and can be handled readily and quickly by personal computers.
- Intuitive logic. In a simple and direct way, it displays the dependencies in the complex of activities comprising a project. The logic reveals which activities have to be executed before others can proceed.
- Focus on top priority. It pinpoints attention on the small group of activities that are critical to project completion time. This focus greatly adds to higher accuracy and, later, precision of schedule control.
CPM's shortcomings include the following:
- It looks convoluted and perplexing to first-time users. The multitude of activities flowing into and branching out of the web of interrelated paths creates a sense of disorientation and complexity that is difficult to comprehend. As such a user put it, “When I used it for the first time, CPM appeared to me as mind-boggling crow tracks, almost impossible to decipher.
- It is timeless, since it is a diagram without a timescale. Certainly, the diagram is accompanied by a tabular report of schedule dates, but for today's project managers pressed for time, speed, and efficiency, the inability to quickly read dates and float off the CPM Diagram is frustrating.
- It appears overwhelming when it comes to maintaining it for a very dynamic project, where frequent changes are the order of the day. Consequently, updating and changing the schedule may be very time-consuming.
Variations. The CPM diagram taken here is one of the AON format. Other formats include CPM with AOA, PERT (Program Evaluation and Review Technique and precedence diagram (PDM). In AOA, activities are shown as arrows, and the arrows are connected by circles (or dots) that indicate sequence dependencies. In that way, all immediate predecessors of an activity lead to a circle at the beginning point of the activity arrow, while all immediate successors stem from the circle at the arrowhead. Thus, a circle becomes an event, where all activities leading to the circle are completed.
CPM is very similar to PERT [21], but while CPM's activity duration estimate is deterministic, PERT uses a weighted average to calculate expected time of activity duration as follows:
![]()
where
a = optimistic time estimate
b = pessimistic time estimate
m = most likely time estimate, the mode
PERT has been used primarily in research and development projects, while CPM, which was originally developed for construction projects, has spread across other industries.
PDM is an AON network that allows for leads and lags between two activities (see the “Time-Scaled Diagram” section in this chapter for more details on leads and lags). This makes it easier to portray rich and complex dependencies of the real-world projects, giving PDM a wider application across industries and an edge over CPM and PERT. These two methods allow for leads and lags only by splitting activities into subactivities, leading eventually to a significant increase in the number of activities in the network, and making it more complex and difficult to manage.
Customize the CPM Diagram. In this section we have described a generic type of the CPM. To benefit most from the diagram, you should adapt it to meet the specific project's need. Following we offer several examples of adaptation.
| Customization Action | Examples of Customization Actions |
| Define limits of use. | Use CPM for cross-functional projects with more than 25 activities. |
| Decide on the format of the diagram: AOA or AON. | |
| Develop templates that can be used as a starting point in building CPM schedules for new projects. | |
| Amend an existing feature. | Amend the key to identify what information will be shown in the diagram. Some choices are activity name, duration, resources, owner, and so on. |
| Decide on how to mark the critical path. | |
| Add a new feature. | Add major milestones to the diagram and link them with activities to show dependencies. |
Check to make sure you developed a good CPM Diagram. The diagram should show
- All necessary activities to complete the project
- A logical sequence of the activities
- No loose ends (beginning and ending points of all activities should be tied into other activities' beginning and ending points)
- Durations and resources assigned to all activities
- Critical paths
Summary
This section featured the Critical Path Method (CPM) Diagram. This tool provides a means of representing project activities as nodes or arrows, determining which of them are “critical” in their impact on project completion time. Originally developed for use in large, complex, and cross-functional projects, the CPM tool is nowadays employed in smaller projects as well. Having a CPM schedule helps the project manager to see the total completion time, understand the sequencing of activities, ensure resources when necessary, monitor those that are critical, and measure progress. A list of key points in building the CPM diagram is highlighted in the box above.
Time-Scaled Arrow Diagram (TAD)
What Is TAD?
TAD is the only Critical Path Method displayed against the timescale (see Figure 6.6). Its purpose is to analyze, plan, and schedule projects in order to meet a target date at a minimum cost. In the process, TAD determines which project activities are “critical” in their impact on project completion time so the project team can focus on them. As its nominal definition states, TAD is an activity on arrow tool.
Developing a TAD
Building a TAD is a workout that requires endurance and discipline, unfolding through several major steps. Like with all schedule development tools, the first thing to do is to figure out the level of detail and identify activities. Typically, this is part of the scope planning. We include it here in order to provide an integrated view of this tool's development.
Prepare Information Inputs. TAD's quality is heavily dependent on solid information about the following:
- Project scope
- Responsibilities
- Available resources
- Schedule management system
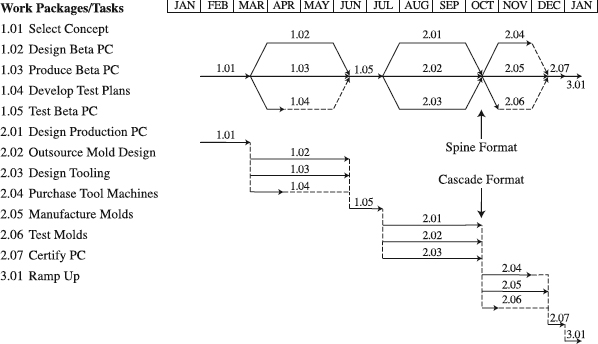
Figure 6.6 An example of a Time-scaled Arrow Diagram.
Clearly, you need to understand the project scope in order to schedule the project activities. The purpose of knowing who is responsible for certain activities is to indicate who will schedule and then manage the activities. For this to be possible, these schedulers need information on resource availability. Guidelines for how to develop and maintain TAD will come from the scheduling management system (see the box “Scheduling Management System” in the “Gantt Chart” section).
Determine the Level of Detail and Identify Activities. How large or small individual activities are influences the number of activities in a TAD. A company's example may shed more light on this issue. Large new-product-introduction projects typically include 300 to 500 activities, with durations between three and five weeks. The message is, only this level of detail is satisfactory. Its intention is to provide just enough information—neither more, nor less—than what one needs to direct and monitor project work of a certain size and complexity. Providing more or less information than necessary may either overload the team or deprive it of essential information, respectively.
Once the level of detail is chosen, the next actions are as follows:
- Identify activities that have to be performed to get the project done. As is the case with all types of scheduling tools, an excellent way for this is to employ the Work Breakdown Structure, perhaps the most systematic and integrated way of activity identification process. Activities necessary for developing TAD are those needed to produce work packages, the lowest-level elements of WBS.
- When the activities are identified, concentrate on the level of detail that was selected earlier. If the actual number of activities is smaller than the targeted number, resume breaking down larger activities. Should the actual number exceed the target number, some similar activities can be merged to reach the desired level of detail.
Sequence Activities. Sequencing is establishing dependencies among activities. This means putting activities into a specific order by determining an activity's immediate prerequisite activities, called predecessors, and leaving no loose ends (see the box that follows, “Loose Ends May Mislead the Team). As explained in the section on the CPM diagram, some dependencies will be hard or logical; others will be soft or preferential. Both types can be used to create overlapping activities, of course, for the purpose of fast-tracking TAD. For example, instead of writing the complete program and then testing it, you may decide to overlap the two activities by writing part of program, testing it, writing another part, testing it, and so on.
To overlaps like this and to other types of relationships between activities, TAD makes available another way to envisage dependencies: Finish-to-start (FS), start-to-start (SS), finish-to-finish (FF), and start-to-finish (SF) [22]. To each of those we may specify a lead/lag factor in order to accurately define the dependency. (See the examples in Figure 6.7.)
How much are these dependencies really used in practice? How much do we need them? Traditionally, FS has been used all the time. Generally, SS has gained huge popularity in businesses competing on faster project cycle times. If you are in that business, SS is what you need to fast-track a project [23]. Its major benefit is in allowing parallel work. Consider, for example, developing a new computer, where software development has an SS with lag dependency with hardware development. To start its work, the software team needs at least a hardware design, and once they get it, they can carry on with their work in parallel with the hardware development. FF and SF, on the other hand, haven't seen as much action.
Loose Ends May Mislead the Team
We frequently see TADs with loose ends, including arrow tails and arrowheads that are not connected to other activities. When we ask project managers why, we often get an answer like, “I only want to show the critical path and dependencies on it. Other paths and their dependencies are not important to me.” This is a poor practice. To determine the critical path, the team has to evaluate all paths with properly connected activities. If there are loose ends, the team may not see the real critical path. Then the whole purpose of having a TAD—focus on really critical activities—is defeated.
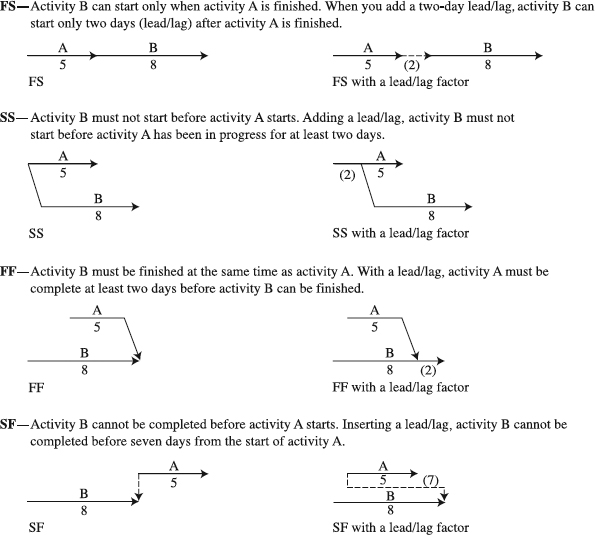
Figure 6.7 Types of dependencies between activities.
Assign Resources and Estimate Activity Durations. The heart of schedule development is resource allocation and scheduling. Although it was touched on in the section on CPM, we repeat it here. The first rule of this allocation business is to identify resources necessary to successfully complete activities. For example, you may need a cost estimator and precisely 80 hours of his work (effort) time. With regard to mature work technologies, you can obtain this number by dividing the amount of work by the production norms [15]. Assume now that the estimator is shared by this one and two more projects. Look at the company's work calendar as well (50 hours week only; no work on Saturdays and Sundays). All this information tells that the estimator will need to spread his 80 hours' worth of work over 10 calendar weeks (calendar time). Reiterate steps of identify resources, figure out work time, and convert it to calendar time for all remaining activities. Estimating activity durations can be tricky, especially in multi-project environments (see the box that follows, “Switchover Time Adds to the Schedule Inaccuracy”).
Draft the TAD. Draw activities as arrows, connecting them to one another—arrowhead to arrow tail to indicate the sequence of dependencies (see Figure 6.6). In that manner, all immediate predecessors of an activity lead to the beginning point of the arrow tail, while all immediate successors stem from the arrowhead. Thus, the beginning point of the arrow tail becomes an event, where all activities leading to the point are completed. Obviously, a TAD can be drawn in two different formats (see Figure 6.6 and the box that follows, “Cascade vs. Spine Formatted TAD”).
Identify the Critical Path (CP). Normally, a TAD shows a number of different paths—that is, sequences of dependent activities. The paths can be used in two ways to find CP. First, you can visually find a path composed of activities without float—no complex calculations necessary. Among all network users, this convenience is available only to those who practice TAD. Adding up the times for all activities in a path (as we did with CPM) will tell how long it is. As a reminder, CP is the longest path in TAD, which indicates the minimum time necessary to complete the entire project. Second, you can find CP with the forward/backward pass procedure and calculate total and free float, as explained in the “Identify the Critical Path” part of the “Critical Path Method (CPM) Diagram” section.
Switchover Time Adds to the Schedule Inaccuracy
Some 90 percent of projects are implemented in a multiproject management environment. This means that a practice of having multiproject managers run multiple projects at a time, anywhere from two to ten, is widely accepted [3]. While such an approach provides outstanding benefits in terms of better management [7], it also generates a unique problem that calls for very meticulous scheduling of the projects. In particular, the problem here is the switchover time. When the multiproject manager switches from one project to another, she needs switchover time to align her thinking and get into the new project, physically and mentally [8]. Since team members also operate as members of multiple teams at a time, they suffer from the same problem. As the projects grow in complexity, so does the switchover time [10]. Clearly, this time is a loss in a busy day of a multiproject manager and team member. For example, some experts indicate that this loss may be up to 20 percent of the multiproject manager's or team member's time, when involved in four projects at a time. The real problem is then that this switchover time loss typically is not taken into account in scheduling multiple projects. As a consequence, project schedules are notoriously optimistic and inaccurate. There are at least two strategies to deal with the problem. One is to reduce the available monthly work hours of a multiproject person used for scheduling purposes by the corresponding switchover time loss. Another is to increase the estimate of a multiproject person's work hours for a specific project by the corresponding switchover time loss. These strategies are not attractive, but they are necessary for the realistic development of TAD or whichever tool is used.
Cascade vs. Spine Formatted TAD
Cascade
- One zone, one activity. A zone is a horizontal swath or strip across a TAD printout. The cascade format allows only one activity per zone.
- Why called cascade? A well-arranged succession of activities, one per zone, appears like a cascade.
- Less complex. The cascade resembles a Gantt Chart, a simple-looking tool, which creates a sense of lower complexity that is easier to apply.
- Less practical. Because of one activity per zone, a larger TAD may require lots of sheets to print it and large wall space to post it.
Spine
- One zone, multiple activities. TAD printout allows multiple activities per zone.
- Why called spine? Activities are symmetrically arranged around a central path, usually the critical path, resembling a spine of the network.
- More complex. The appearance of the spine is much like any other network, something that looks scarily complex to some project managers.
- More practical. Because of multiple activities per zone, you can print a larger TAD on a single sheet of paper and post on it on a small wall space.
Review and Refine. This is the time to review what has been developed. Directly off a TAD, you can
- Read the critical path, floats, the activity beginning and ending dates, along with their durations.
- Check hard and soft dependencies—leads and lags.
- Identify opportunities to speed up the schedule, add leads and lags.
In other words, when reviewing and refining TAD, we can modify to achieve a better schedule for our needs.
Utilizing a TAD
When to Use a TAD. Like any network diagram, TAD's original target were large, complex, and cross-functional projects. TAD is well suited to such projects because of the ease with which it handles a large number of activities and their intricate dependencies, directing our attention to the most critical activities. While it is still applied for this purpose, a large number of project managers have used TAD for medium- and small-size projects (see the box that follows, “Tips for TAD”). In this case, TAD is typically drawn in a cascade and often called a “Gantt Chart with links.” Perhaps more than anything else, this format facilitated the growing popularity of TAD.
A sizeable TAD can be used along with Gantt Chart to provide focus on the day-to-day project work. In particular, we can take out from TAD those activities due in the next week or two, show them in the Gantt Chart format, and have their “owners” use them as short-term outlook schedules. This provides a balance in focusing on both the big picture of the project with TAD and daily work details with Gantt Charts.
Time to Develop. A skilled, smaller project team can take a day to day and a half to build a 250-activity TAD schedule. The larger the team, the more time it needs to construct a TAD. Developing a TAD off a template is a good strategy to reduce the development time.
Benefits. TAD offers a unique benefit not available to any other network diagram: the ability to read directly off the schedule's timescale when the project and each activity starts and ends, as well as the total float. Like other network diagrams, TAD helps identify the total completion time, understand the sequencing of activities, ensure resources when necessary, monitor those that are critical, and measure progress (or lack of it). Perhaps the highest value comes from TAD's focus on priorities; TAD directs our mind on the vital few activities of critical importance to the project completion date. The outcome is higher accuracy and, later, precision of schedule control.
Advantages and Disadvantages. TAD's advantages are as follows:
- Lowered complexity. TAD combines the best of two worlds: retaining the visuality and timescale of a Gantt Chart without losing dependencies of a network diagram. This makes its much more attractive to use than other networks.
- Graphic appeal. TAD's unambiguous sequence of work, supported by the timescale, is easier to clarify than any other network diagram. Data calculations are not difficult and can be handled readily and quickly by personal computers.
- Intuitive logic. TAD exhibits the dependencies between constituent activities of a project simply and directly. This helps fathom the order of activity execution.
Tips for TAD
- If you need to fast-track your schedule, use SS with or without lags. Be prepared to see and manage 40 to 50 percent critical activities in the schedule.
- Building on the similarity between a cascade-formatted TAD to a Gantt Chart, spread the use of the TAD in all smaller projects. This will significantly enhance the quality of scheduling.
- Add major milestones to TAD to help vital events serve as beacons in the sea of activities.
- Insist on the use of template TADs to boost quality and productivity of scheduling.
Check to make sure you developed good TAD. The diagram should show
- All necessary activities to complete the project
- A logical sequence of the activities
- No loose ends
- Durations and resources assigned to all activities
- Duration of each activity against a timescale
- Critical paths and total float
Undoubtedly, while the addition of the timescale simplified TAD's basic network diagram nature, it can still look to some potential users as
- Complex and confusing. The multitude of interconnected activities, even in the cascade format, may leave an inexperienced person at a loss.
- Overpowering and time-consuming in situations requiring frequent and significant TAD updates and changes.
Customize TAD. What we have covered up to this point is a standard, generic TAD. For a TAD chart to be more useful, you need to modify it to best match the project situation. The following examples illustrate our point.
| Customization Action | Examples of Customization Actions |
| Define limits of use. | Use TAD for functional and cross-functional projects with more than 25 activities. |
| Use the cascade format for up to 100 activities; the spine format for over 100 activities. | |
| Use templates as a starting point in developing TAD schedules for new projects. | |
| Amend an existing feature. | Amend the key to identify what information to show in the chart. Choices include activity name, duration, resources, owner, and so on. |
| Decide how to mark the critical path. | |
| Add a new feature. | Add major milestones to the chart and link them with activities to show dependencies. |
Summary
Presented in this section was the Time-scaled Arrow Diagram, or TAD. This is the only critical path method tool displayed against the timescale. It is applied in large-, medium-, and small-size projects. TAD offers a unique benefit not available to any other network diagram. Specifically, it enables reading directly off the schedule's timescale when the project and each activity start and end, as well as the total float. Like other network diagrams, TAD helps you identify the total completion time, understand the sequencing of activities, assure resources when necessary, monitor those that are critical, and measure progress. There is a special value of customizing TAD for your own project needs. Key points in constructing a TAD are highlighted in the following box.
Critical Chain Schedule
What Is a Critical Chain Schedule?
A Critical Chain Schedule (CCS) is a network diagram that strives for accomplishment of drastically faster schedules (see Figure 6.8). It uses several unique approaches. First, CSS focuses on the critical chain, the longest path of dependent events that prevents the project from completing in a shorter time. Unlike the critical path, the critical chain never changes. Second, its activity durations are estimates with 50 percent probability. For this reason, they are significantly shorter than those used in other scheduling tools, which are often with 95 percent probability. Third, in contrast to the critical path, the critical chain is defined by the resource dependencies. Fourth, buffers are built to protect the critical chain in the course of project implementation. Finally, CCS requires certain behaviors by the project team. Introduced in 1997, CCS is a relatively new tool to the world of project managers [24].
Building a CCS
Prepare Inputs. Because of the inherent challenge of faster schedules that it seeks to make possible and its newness, CCS's quality is even more dependent on the depth and degree of definition of the following inputs than other schedule development tools:
- Project scope
- Responsibilities
- Dedicated team resources
- Schedule management system.
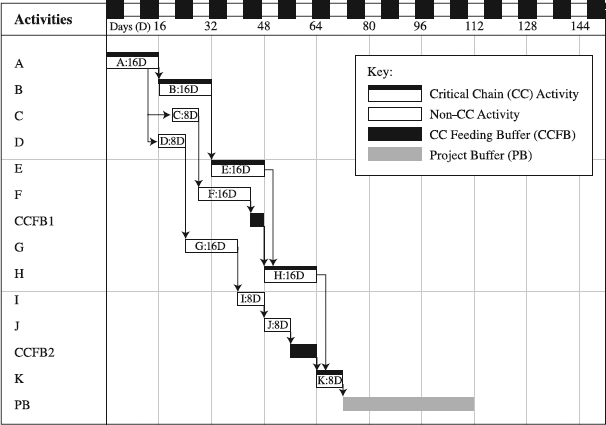
Figure 6.8 An example of the Critical Chain Schedule.
While the scope, responsibilities, and schedule management system will provide information about the what, and the who elements, as well as how to schedule project activities faster, the real emphasis is on CCS's requirement for dedicated team resources, meaning that team members work full-time on one project only. Because of this, the logic goes, members of the dedicated project teams are more productive than members who are shared by multiple project teams. A reason for this is the switching time cost created by one's work in multiple projects, as we discussed in the box “Switchover Time Adds to the Schedule Inaccuracy” in the TAD section. Although this is generally true, there are some exceptions. A study found that when a team member who is focused on a single project is assigned a second one, productivity often increases a bit because the team member no longer has to wait for the activities of other members working on that single project (see Figure 6.9). Rather, the team member can float back and forth between the two projects [25, 26]. When a third, fourth, and fifth project is added, however, the productivity plummets rapidly and the team member becomes a bottleneck of all projects he or she is involved in. This is why the CCS approach insists on using dedicated teams.
Determine the Level of Detail and Identify Activities. The number of activities in CCS is closely related with the size of activities in it. Therefore, choosing to have approximately 100 or 300 or 500 activities will help determine how large individual activities will be. To illustrate this point, look, for example, at one company's golden rule. Large product development projects, including between 5,000 and 10,000 person-hours, will have around 500 project activities that range in duration from two to four calendar weeks. Not only does this clearly tell everyone that neither 180-activity schedule nor15-week activities are tolerated, it also spells out the company's belief about the right level of detail. Given the complexity and size of the project, such level of detail provides sufficient information to manage the project without making it unnecessarily burdensome and time demanding.
Once the decision has been made about the level of detail, these actions should be taken:
- Brainstorm and identify activities that are necessary to complete in order to finish the project. As with other scheduling tools, if necessary, resort to the Work Breakdown Structure for the activity identification (see the “Work Breakdown Structure” section in Chapter 5).
- In this process, disregard how large the activities are; rather, ensure that all necessary activities are on the list.
- Go back to the chosen level of detail. If below the intended number of activities, continue breaking down larger activities; if over the target number, combine similar activities to reach the desired goal.
Sequence Activities. Sequencing means arranging a logical network of activities and their dependencies. Deep knowledge of nature and flow of work are prerequisites here. The principle of sequencing is to know that a preceding activity produces outputs that become inputs to an activity that follows. If the obtained network diagram fails to observe the principle, the bets are we are missing the logic of the project work, resulting in rework and delays in project execution.

Figure 6.9 Productivity of team members.
Reprinted with the permission of The Free Press, an imprint of Simon & Schuster Adult Publishing Group, from REVOLUTIONIZING PRODUCT DEVELOPMENT: Quantum Leaps in Speed, Efficiency, and Quality by Steven C. Wheelwright and Kim B. Clark. Copyright © 1992 by Steven C. Wheelwright and Kim B. Clark.
Assign Resources and Estimate Activity Durations. Since people and material resources get the project work done, they dictate activity durations. Therefore, a natural starting point for estimating the durations is, “What resources do I need to successfully complete this activity?” The answer should provide the names of resources and work time for each one of them to complete the activity—for example, 100 hours of work from a programmer. The key point here is that CCS uses a unique technique of activity duration estimating that does not allow for contingencies (see the box that follows, “When Estimating Durations, No Contingency Safety Allowed”). Considering that the Critical Chain approach requires dedicated teams, and knowing the company's work calendar—5 days a week, 10 hours a day—those 100 hours turn into 10 workdays or 14 calendar days. Naturally, the estimation of each activity should undergo this process.
Identify the Critical Chain. The Critical Chain (CC) is the longest path in the network diagram, considering activity and resource dependencies. Or, it is the sequence of dependent events that keeps the project from completing in a shorter time.
Indicate a Resource Buffer. CCS always considers the resource constraints and includes the resource dependencies that define the overall longest path. Practically, this is handled by adding resource buffers to protect CC from unavailability of resources. Resource buffers are added to CC only, do not take any time in CC, and are termed resource flags. For example, any time a new resource will be used in a CC activity, we will add a resource buffer. This signals to the project manager and resource provider when to make the resource available to work on a CC activity ready to start. Since timely resource availability is critical to rapid execution that CCS advocates, some companies use incentives to reward behavior of early delivery of activity outputs and standby time of resources [5, 27].
Create a Project Buffer. Unlike other schedule development tools, CCS uses a novel concept of the project buffer. Its purpose is to protect the project due date by aggregating contingency time in the form of the project buffer at the end of CC (for management of the buffer, see the “Buffer Chart” section in Chapter 12). There are several methods to determine the buffer duration. One of them is to divide the duration of the critical chain by two (called the “50 percent buffer sizing rule”). The buffer is used to absorb uncertainty or disruptions that may occur on CC and has no work assigned to it (see Figure 6.8).
Create Feeding Buffers. Protecting the CC with the project buffer is not enough. There is a significant risk that activities that are not on the CC but feed into it may slip to the point of pushing out the CC. To protect the CC from the risk, we can aggregate contingency time at all points where non-CC activities feed into the CC (see Figure 6.8). These contingency times are termed CC feeding buffers. During the project implementation, these buffers will be used to absorb uncertainty or disruptions that may occur in non-CC activities. To determine these buffers, use one-half of the sum of the activity durations in the chain of activities preceding the buffer. No work is assigned to the buffers.
Review and Refine. The final step in developing a CCS is to review what has been developed:
- Take a close look at the CCS to read the critical chain, activity beginning and ending dates, their durations, and buffers.
- Do they make sense? Are there any opportunities to improve CCS?
When Estimating Durations, No Contingency Safety Allowed
Most project managers tend to include contingency time into each activity estimate without specifying it. The reason is simple: add the safety time. The Critical Chain Schedule strives to eliminate the safety. Here is what it means. Figure 6.10 shows a typical distribution of activity time performance. The solid line (the left ordinate) tells us the incremental probability of a given activity duration time on the x-axis. The dotted line indicates the cumulative probability (the right ordinate) that the activity will be finished in a time less than or equal to the activity duration time on the x-axis [6].

Figure 6.10 A typical distribution of activity time performance.
When project managers include contingency time within an activity, they really go for 95 percent probable estimate (cumulative probability). As the cumulative curve shows in the figure it is duration equal to or less than 50 days. Without the contingency time, the duration is less or equal to 20 days. That is 50 percent probable estimate. The difference between the 95 percent probable estimate and the 50 percent probable estimate is contingency time, 30 days in this example. To avoid excessive activity duration, and speed up the schedule, CCS eliminates the contingency time, using only 50 percent probable estimates.
Tips for Critical Chain Scheduling
- Use CCS in important projects that may afford a dedicated team.
- Apply CCS in companies that are in a time-to-market race, always striving to shave off their cycle times.
- Support CCS with performance measurements that promote behavior of transferring an activity's output to the succeeding activities as early as possible.
- Deploy CCS where there exists a strong performance culture willing to take on 50 percent probable estimates.
The goal here is to make modifications that would lead to a more effective schedule for the project.
Utilizing the Critical Chain Schedule
When to Use a Critical Chain Schedule. The most appropriate application of CCS is for a dedicated project team seeking a significant reduction of the project cycle time in a company with an outstanding performance culture. The only job of this team is their project. Equipped with all necessary resources, the team operates in a company whose performance culture focuses on exceeding its customer expectations, creating maximum value for its shareholders, and providing strong growth opportunities to its employees (see the box above, “Tips for Critical Chain Scheduling”).
Time to Build. A well-trained, small project team can develop a 250-activity CCS in anywhere from a day to day and a half. When a large team is involved in the development, more time may be needed for additional communication. Significant time can be saved if a template schedule is used at the start of the exercise.
Benefits and Costs. Beyond every schedule's purpose of having the project team understand the timetable for project activities and their personal time commitments, CCS intends to improve the results of the project team. Hence, as early experiences with CCS indicate, the project should see considerable improvements in schedule and cost performance, because CCS
- Is an important eye-opener. Simply, CCS recognizes that the interaction between activity durations, dependencies, resource requirements, and resource availabilities has a major impact on project duration [28].
- Protects a deterministic baseline schedule. This protection helps fight uncertainties by using feeding, resource, and project buffer to set a realistic project deadline. As a result, CCS offers a significant potential for radical acceleration of project completion times. Project managers at 3M and Lucent reported up to a 25 percent reduction in project cycle times when using the CCS approach [5]. For those in rapid project cycle time business, this may be a tool worth trying.
- Makes a case for truth in activity duration estimation [29]. In contrast to other tools without a mechanism to prevent project managers from building contingency safety into activities, CCS's “no contingency allowed” mechanism eradicates such tendencies.
- Is a good fit for corporate and project achievers. By not allowing contingency safety, CCS drives the behavior of excellence, challenging even the most demanding performance cultures around.
- Enhances discipline. Greater and more open communication among internal project stakeholders results in enhanced discipline in project scheduling and control [30].
As a relatively new tool, CCS has been heavily scrutinized from both practitioners and researchers. Critics believe that the CCS approach includes assumptions, requirements and practices that may reduce its application and effectiveness. Specifically, CCS
- Needs more empirical testing. CCS is a relatively new tool, even though its concept has been around since 1964 [28]. Hence, there is little empirical evidence—beyond several case studies—about its true efficacy.
- May be based on an overly negative assumption. Some critics argue that the assumption that large contingency safety is “padded” into the activity duration estimation in critical path scheduling is overly negative and exaggerated [31].
- Requires a dedicated project team to apply it. In other words, when working at several projects sharing the same resources, project teams should not use the CCS approach. While the requirement makes economic sense based on a higher productivity of dedicated teams, it is not much in tune with political realities of today's organizations, where simultaneous work at multiple projects is almost a given.
- Excludes the use of project milestones. The lack of the milestones in CCS may severely hamper the ability of the project team to coordinate schedules with external vendors, often delivering critical components for the project [32].
- May overestimate the buffer. Experts testing the CCS capabilities found that its 50 percent buffer sizing rule might lead to a serious overestimation of the buffer protection. Also, updating the CC might provide shorter project durations than not updating as CCS argues [28].
- Requires extraordinary behaviors. CSS is well suited to strong performance corporate cultures, which are in relentless pursuit of excellence. Perhaps only such cultures may accept the challenge of 50 percent probable estimates on a routine basis without finger pointing when the estimates are not accomplished.
- May contribute to the burnout of project participants. As evidence about dedicated teams in accelerated product development projects indicates, people in such environments work long hours under high stress, resulting in physical and emotional burnout. Since work in such environments strongly resembles the CCS approach with its dedicated teams and 50 percent probable estimates, it is highly likely that an extended application of CCS with the same project players will have similar consequences.
Advantages. CCS's advantage is that its basic concept, including 50 percent estimates of activity duration, critical chain, and buffers is relatively simple. Although not evident upon first sight, CCS doesn't require any proficiency in statistics.
How to Customize CCS. We have described a standard, generic CSS. Adapting it to your needs is a good way to get the most out of it. Here are a few examples of such actions.
Summary
The focal point of this section was the Critical Chain Schedule. This is a network diagram that strives for accomplishment of drastically faster schedules. Its uniqueness lies in using project activity durations that are significantly shorter than those used in other scheduling tools. Its most appropriate application is in a dedicated project team, seeking a significant reduction of the project cycle time in a company with an outstanding performance culture. Although it is an eye-opener for many project managers, CCS is a relatively new tool that needs more empirical testing. The following box highlights key points in constructing this schedule.
| Customization Action | Examples of Customization Actions |
| Define limits of use. | Use CCS for cross-functional projects of the most strategic nature. |
| Use the cascade format as in TAD (because of its familiar look to managers). | |
| Amend an existing feature. | Amend the key to identify what information is to be shown in the schedule. The choices are activity name, duration, and so on. |
| Decide how to mark the critical chain and buffers. |
Check to make sure you developed a good Critical Chain Schedule. The chart should have:
- All necessary activities to complete the project.
- A logical sequence of the activities.
- Activities with durations without contingency safety—that is, based on a 50 percent probable estimate.
- Project buffer to protect the project due date.
- Feeding buffers to protect the Critical Chain.
- Resource buffers to protect the Critical Chain.
Hierarchical Schedule
What Is a Hierarchical Schedule?
This is a multilevel schedule with varying level of detail on each level (see Figure 6.11). Every activity in a higher-level schedule is broken down into several activities, sometimes entire schedules. Typically, the schedules from various levels are connected at major milestones or events. WBS offers a good skeleton for hierarchical scheduling.
Constructing a Hierarchical Schedule
Developing these schedules hinges on the size of project. A very large project can easily use three levels, while a medium-sized project cannot warrant more than two levels. To offer a sense of a more difficult situation, we will use a three-level hierarchy here. In developing the schedules, the rules for building the type of the chosen schedule—whether Gantt Chart, network diagram, or Milestone Chart—should be applied.
Prepare Information Inputs. Quality of the Hierarchical Schedule begins with the quality of its inputs:
- Project scope
- Responsibilities
- Available resources
- Schedule management system.
Project scope will provide information necessary for a good understanding of the project activities that are being scheduled. Such scope information will be furnished to or developed by those who are responsible for certain work packages of the project. When scheduling the work packages, they will rely on the information about availability of resources, seeking guidance from the roadmap for scheduling—the schedule management system (see the box titled “Schedule Management System” in the “Gantt Chart” section).

Figure 6.11 An example of the Hierarchical Schedule.
Develop Level 1 Schedule—Master Project Schedule. This is a summary schedule of the project, which is usually a Gantt or milestone chart format. It is an outline that will be used throughout the project as a tool to report progress to top management. Since it is developed in the phase of project planning, it is considered to be an initial plan as well. Included in the schedule are only principal activities and key milestones from level 1 or 2 of WBS (the project is level 0). Everything in the schedule is roughly estimated. For example, overall timing of phases, required resources, major dependencies, and major events in the schedule are all roughly estimated. It is important to highlight phases that need critical attention, such as material requirements, vital tests, and completion dates. Linking the development of the schedule with the definition of project objectives and strategies is a good strategy, because this is the time when the purpose and implementation methods for the project are shaped. In this linking, you should be able to easily chart, rechart, and evaluate multiple alternatives of the schedule in order to select the most viable one. Because the schedule is rough in its nature, it should not be used for the total integration of all project phases. That is why you need a level 2 schedule.
Figure 6.11 shows the master schedule for the product development project named OCI, consisting of eight work elements from level 1 of the WBS, each with a milestone at its end. It is in a Gantt Chart format and is used for the progress reporting to the product approval committee, an executive group responsible for the project selection.
For example, the first-level schedule (master project schedule) can be built of work elements from level 1 of the WBS. Work packages from level 2 of the WBS can be included into the second-level schedules (functional schedules because they are typically owned by functional units). Finally, constituent activities or task of the work packages (level 3) would be used to develop the third-level schedules (work package schedules).
Build Level 2 Schedule—Intermediate Schedule. The level 2 schedule will explode activities from the master project schedule, scheduling them in more detail. For this, a common choice is a Gantt or network chart, sprinkled with milestones. This schedule is a middle management planning and control tool, generally to assign responsibilities for work packages (level 3 of the WBS, for example). Clearly, activities in the schedule are not meant to provide daily or even weekly scheduling and directing of project work, except for the most critical activities. Still, it should be scheduled in sufficient detail to include major and minor milestones, crucial human resources, and sequencing and constraints in the project work. This enables you to scrutinize the structure of the project, dissect dependencies between various phases and milestones, and set boundaries within which shifting activities won't impact project delivery date. To deliver the punch, the level 2 schedule has to
- Allow the identification of the proper priorities.
- Determine critical and near critical paths.
- Get off to a quick start when the project receives a go ahead from management.
Project OCI had several level 2 schedules, each drawn as a Time-scaled Arrow Diagram in the cascade format. The largest of them had around ten work packages from level 2 of the WBS. Essentially, each level 2 schedule was the functional schedule for a certain discipline—marketing, electrical group, optoelectronic group, software hardware group, and so on.
Construct Level 3 Schedule—Detailed Schedule. This set of detailed schedules is intended to help lower levels of managers—work package managers, for example—in directing daily and weekly project work. Although it can be in the network format, a more frequent approach is to use a Gantt or Milestone Chart. Before getting to scheduling, you should size up available information, assess the size and complexity of the project, and weigh out experience and inclination of the involved project people. Then you should decide which of the following approaches to pursue for level 3 schedules:
- Create a fully integrated schedule for the entire project.
- Build a complete schedule for each activity from the level 2 schedule.
- Construct a separate detailed schedule for each phase as the project unfolds, and connect them via the level 2 schedule.
- Ask each project participant to develop detailed schedules for activities in the level 2 schedule that he or she is responsible for.
Milestone-CPM-Milestone Schedule Gets the Job Done
In a six-month-long, $70M project, a semiconductor company identified a few major milestones presented to the executive group (level 1 schedule). To direct the work and review progress weekly, the project management team relied on a CPM diagram with carefully weaved 400+ minor milestones (level 2 schedule). Minor milestones from the diagram were grouped into separate working milestone charts and handed to workgroups responsible for certain technical discipline (level 3 schedules). Including 40 to 50 milestones, each Milestone Chart was the key tool for doing work and reporting progress to the PM team. Rid of complex dependencies typical of the CPM diagram, the minor Milestone Chart provided clear and simple goals to go after.
Whatever the choice, the schedule must lay down the day-to-day, week-to-week work that an organization needs to successfully execute and control. It goes beyond saying that the schedule needs to be rooted in available resources, established dependencies, and time targets approved by management.
The choice of the OCI project was to use the Gantt Chart format to schedule in detail constituent activities of the individual work packages, keeping the number of activities per chart to less than ten (work package schedules). The total number of all activities in level 3 schedules was slightly below 500. While the OCI project offers one example of how to structure the Hierarchical Schedule, many other approaches are possible (see the box above, “Milestone-CPM-Milestone Schedule Gets the Job Done”).
Utilizing the Hierarchical Schedules
When to Use. Hierarchical Schedules are used to confront challenges in two major project situations, including:
- Rolling wave scheduling. When starting some projects, we only have information about an early phase, while details about later phases emerge as the project progresses. In response, at the start of the project, we can develop a rough schedule encompassing the whole project and then build detailed schedules of the project's major phases as details become available. This approach is termed rolling wave scheduling and is implemented via the Hierarchical Schedule method.
- Multitiered schedule information for larger projects. Since different levels of management have different jobs in a project, to successfully get its job done, each level needs a different detail of schedule information. Different levels in Hierarchical Schedules provide those different details of schedule information. Tips for Hierarchical Schedules are described in the box that follows.
Time to Develop. A three-level Hierarchical Schedule with several hundred activities may take several days to develop in an organization that has a process for it. Also, the larger the group of people involved and the more inexperienced they are, the more time it takes. The good news is that that time is spread over project duration.
Benefits. The use of Hierarchical Schedules equips management of the project with the capability to integrate the scheduling of the earlier and later phases. Without the schedules, our scheduling and our attention would be focused on a piece of the project for which we have information, ignoring the whole project and its big picture. This would be tantamount to a runner who sees terrain just in front of her, having no idea how long the run is (a mile or 26 miles), what major milestones lie ahead (a steep hill, for example). Such a runner would have little chance to pace herself and successfully reach the finish line. In addition, Hierarchical Schedules enable managers and doers to perform their individual jobs.
Advantages and Disadvantages. Hierarchical Schedules offer advantages including:
- Flexibility. The project team is not forced to develop a schedule for activities for which they have no information. Rather, they can build a flexible big picture schedule and focus on first activities first, then schedule and deal later with activities that come later.
- The right amount of information. A frequent project tendency to inundate participants with both information they need and information they do not need is not an issue here. Rather, they get as much information as they need to do their job.
Hierarchical Schedules have disadvantages that may reduce their rate of use. Specifically, they are
- Complex. Multiple-level scheduling requires well-established process, skills, and involvement and coordination of many participants. This may make it a baffling and cumbersome exercise, raising the resistance level to its use.
- Time-consuming. Detailed scheduling of this type demands time, a quantity lacking in too many organizations. For this reason, some project participants may feel resentment toward it.
Tips for Hierarchical Schedules
- Go for a hierarchical schedule if you deal with uncertain projects, generating information as they unfold.
- Involve those responsible for work packages in the scheduling process, because they own the project work.
- If less experienced, use a combination of Gantt Charts and milestones in hierarchical scheduling to increase buy-in.
- Remember to use good links (mortar) to link schedules from various levels (bricks).
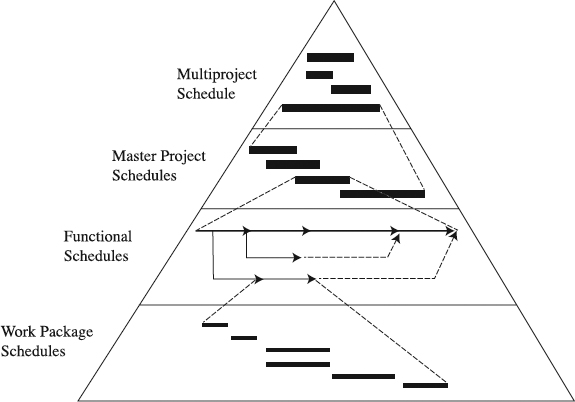
Figure 6.12 An example of the Hierarchical Schedule for multiple projects.
Variation. If we define multiproject management as an environment where multiple projects are managed concurrently [33], our Hierarchical Schedule (see Figure 6.12) can be adapted to help coordinate and integrate the multiple projects [25]. This requires an additional level of schedule, sitting on top of the three-level schedule from Figure 6.11 The additional level includes time lines for each of the multiple projects. Accordingly, we get a four-level schedule linking multiple projects, functional departments, and individual team members [34]. Product development and construction management are major users of this variation.
| Customization Action | Examples of Customization Actions |
| Define limits of use. | Use a three-level hierarchical “one -Gantt-one TAD-multiple -Gantts” schedule for large and uncertain projects. |
| Use a two-level hierarchical “one Milestone-multiple Gantts” schedule for smaller and uncertain projects. | |
| Develop templates that can be used as a starting point in developing Hierarchical Schedules for new projects. | |
| Amend an existing feature. | Decide what information to show in the chart. The choices are activity name, duration, resources, owner, and so on. |
| Add a new feature. | Assign responsibilities by adding the name of the owner to each activity or milestone. |
Check to make sure you developed a good hierarchical schedule. The schedule should have
- More than one level
- Activities from higher-level schedules exploded into several activities or entire schedules in a lower level
- Schedules linked together at major milestones or events
- Proper level of detail on each level.
Customize the Hierarchical Schedule. To get the most out of the schedule, there is a need to modify it so it fits specific project needs. The following examples will help demonstrate this modification.
Summary
The Hierarchical Schedule—a multilevel schedule with varying level of details on each level—was the topic of this section. It is an effective tool when applied in rolling wave scheduling because it helps integrate the schedules of the earlier and later phases. Also, it works well in multitiered scheduling for larger projects. Customizing this schedule for specific project needs can generate possible extra value. In summary, the following box offers key points about the Hierarchical Schedule.
Line of Balance (LOB)
What Is the LOB?
LOB is a tool for scheduling and tracking progress of repetitive projects (see Figure 6.13). More specifically, LOB displays the cumulative number or percentage of components or units that must have been finished by a certain point in time for the schedule to be accomplished.
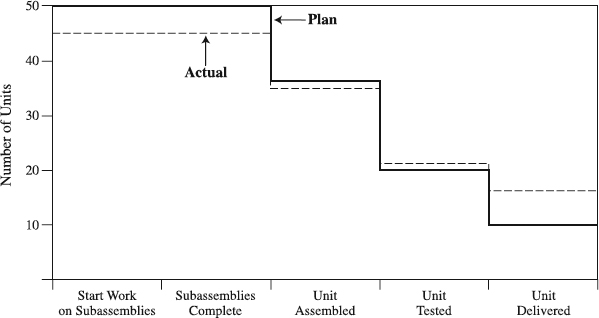
Figure 6.13 An example of LOB.
A Poor Bill of Materials Can Hurt Really Bad
A company received a request for special delivery of XYZ product according to a very tight schedule. An executive, who promised the customer a proposal the same day, asked for an LOB to highlight bottlenecks and assess the likelihood of meeting the schedule. The first step in preparing LOB calculation was getting BOM for a person to understand the parts buildup and define the program. Immediately a manufacturing representative discerned that the BOM was obsolete and not including all necessary parts. Updating BOM and checking missing lead times took a few days. As a result, executives could not keep their commitment and lost this business to a faster competitor.
Developing the LOB
Prepare Information Inputs. Developing a quality LOB requires the following information:
- Project scope
- Responsibilities
- Available resources
- Bill of materials, lead times for procurement, and production norms
- Schedule management system.
As with other scheduling tools, quality information about the scope, responsibilities, available resources, and schedule management system will help users of the tool understand the what and who issues, along with resources and scheduling requirements. What makes LOB different from other scheduling tools is the need for a bill of materials (for production projects, see the box above, “A Poor Bill of Materials Can Hurt Really Bad”), lead times for procurement, and production norms. This information is used to determine the program and then the time line for production/construction, as shown in the upcoming discussion on developing an S chart for multiunit programs.
Set the Objective. Picture a production or construction project aiming at producing a quantity of the end deliverables. A production example might include a series of special orders for 50 connection cables per agreed delivery commitments. To make the project more complex, the cables cannot be completed in one batch, because of the insufficient production capacity. In another case, the project's purpose is to construct a 15-house division. To start developing a LOB, you must set the objective of accomplishing the required delivery or completion schedule for 50 cables or 15 houses.
Define the Program. This is a production or construction plan that may be formatted as a network diagram, Gantt Chart, or Milestone Chart (see Figure 6.14). In the plan, we set the control points, which are key points in the production or construction process. Depending on the chosen format, these points are events in the network diagram, or the end of bars in the Gantt Chart, or milestones in a milestone chart. They are used to measure the progress of the project. An example that follows (Figure 6.14) shows such a program for one unit only. Having a project with multiple units to produce or construct requires the program for all units. There are two possible scenarios for this. In the first scenario, you can produce all multiple units in one batch, assuming sufficient production capacity. Here, all quantities for one unit are multiplied by the number of multiple units to arrive at the program for all units. The lead time for every unit would remain unaltered.
The fundamental premise of the second scenario is that the multiple units can be produced in several batches to accommodate for the insufficient production capacity. Considering that the lead time for each batch is equal to the duration of the one unit program, these batches can be fit into the production schedule. As a result, we obtain the program for producing multiple units.
Develop an S Chart for the Program. In a further step, draw the program for multiple units on a graph called an S chart, showing cumulative deliveries against timescale (see Figure 6.15) and also cumulative completion schedule for control points. Because of the linear production rate, S-curves are straight lines in our example. Essentially, this signifies the planned completion of final units and their intermediate parts or phases. This is for the second scenario—several batches to accommodate for the insufficient production capacity.
Draft and Refine the LOB. Draw a vertical line through the S chart. This is the LOB, a snapshot at a certain point in time (day 30, for example) that indicates the cumulative number of components or units that are planned to be complete by that date in order to comply with the schedule. To track the progress against the plan, you can draw another line that depicts the cumulative number of actually completed components or units (the dashed line in Fig 6.13). Figure 6.13, for instance, shows that the first two events are five units behind the plan, the third event is two units behind the plan, the fourth event is two units ahead of the plan, the fifth event is six units ahead of plan, and there is no real bottleneck. All of this is fine and helpful, but most of the time, the first draft may need refinement, including changes necessary to clean up the LOB.

Figure 6.14 Program for a single unit in a multiunit project.
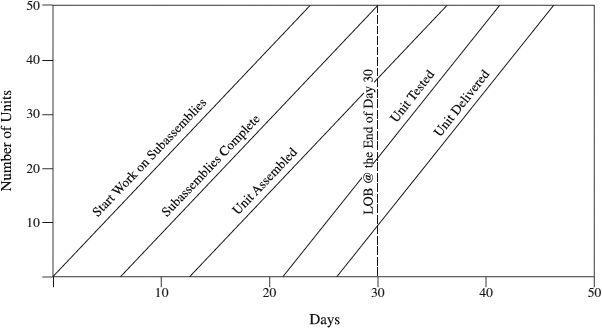
Figure 6.15 S chart for a multiunit program.
Utilizing the LOB
Time to Develop. If the prerequisites listed previously are prepared and an adequate software program is available, building an LOB diagram with 20+ units/components can be completed in between one and two hours. This time will increase when more people are involved, because more time is necessary for their communication.
When to Use the LOB. Although different versions have been developed since LOB's introduction in the 1950s, more than anything else, LOB is a tool for low-volume, new-production situations requiring coordination of the design and small-scale manufacturing or construction. Its main areas of application are as follows:
- Projects including the design and then the manufacturing of a limited number of units per that design (for example, a pilot run for microprocessors)
- Projects consisting of a number of identical units manufactured or constructed in sequence (for example, construction of a multiunit housing project)
- Projects of one-off nature (for example, shipbuilding)
Benefits. By presenting the planned completion status at each phase versus actual completion status at these phases, LOB shows to the project team in a very visual manner whether the project is ahead or behind the plan [35]. For executive use, it highlights the potential showstoppers and bottlenecks, urging an action to remove the problem areas (see the “Focus on Critical Components” and “Tips for LOB” that follow).
In a company, the prevailing view is that all components are not created equal. From previous experience, some components are known as potential show-stoppers in the delivery schedule, others are not. To respond to different level of risks related to the components, the company uses LOB only for monitoring the scheduling of circuit board components, long known as prone to delay. The point here is this: Keep your eye on the critical few, don't bother with trivial many.
Advantages and Disadvantages. LOB's major advantages are that it is
- Visual. It provides a visual display of both the planned and actual progress of repetitive activities.
- Concise. Its ability to report progress at a glance is what every reporting tool strives for.
- Focused. LOB highlights what requires critical attention.
When using LOB, you should watch out for the following shortcomings:
- One-day use. LOB is a snapshot in one point of time. For the next point of time, a new LOB needs to be developed. This is a time-consuming and laborious exercise, which in today's tight schedules may prove to be a discouragement for this tool's use.
- Loss of focus. Displaying the status of myriad of components may create a feeling that we don't see the forest for the trees. The remedy is in considering only those components that our experience marks as potential sources of risk to the delivery schedule.
- Tricky scale. Even in computer times, the vertical scale that has to accommodate a wide range of quantities may suffer from insufficient accuracy.
Customize LOB. To really exploit LOB in a beneficial way, you should adapt it to address specific project needs. The following examples illustrate how that can be done.
Tips for LOB
- Focus on critical components or units.
- Use LOB to detect bottlenecks.
- If you have an MRP (material requirements planning) system, use its power to define the program and develop S chart and LOB.
- Show LOB to executives when you need their support to solve a problem.
Summary
Featured in this section was LOB, a tool for low-volume, new-production situations requiring coordination of the design and small-scale manufacturing or construction. By presenting the planned completion status at each phase versus actual completion status at these phases, LOB shows to the project team in a very visual manner whether the project is ahead or behind the plan. For executive use, it highlights the potential showstoppers and bottlenecks, urging an action to remove the problem areas. As a summary, the following box lists key points to an effective LOB.
Concluding Remarks
There are seven tools in this chapter. That begs a question, which one or ones are the most appropriate to select and use? Such a decision, of course, depends on your project situation. To help narrow down the field, in the table that follows we list a set of project situations and indicate how each situation favors the use of the tools. Identifying the situations that correspond to your own project is the first step. If that set of situations does not describe the project well, brainstorm more situations in addition to those listed, marking how each favors the tools. The tool that has the highest number of marks for identified situations becomes the tool of primary choice. Note, however, that more than one tool can be used, since some of them complement each other rather than exclude each other. A careful study of the material covered in this chapter will help you determine when this is practical.
The LOB Check
Check to make sure you developed an effective LOB. The chart should have
- Number of units or components
- Phases of operation
- Planned completion of components or units at a certain date of the delivery schedule
- Actual completion of components or units at the same date of the delivery schedule, if it is to be used for tracking progress
A Summary Comparison of Schedule Development Tools
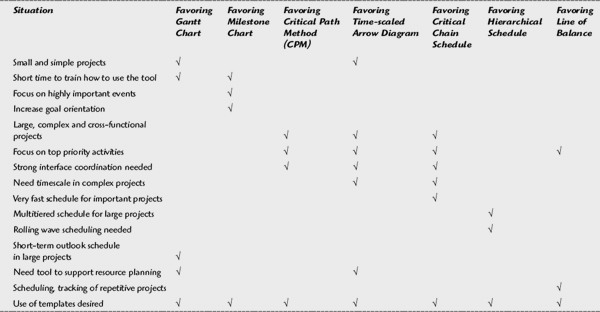
References
1. Segur, P. 1958. Napolean's Russian Campaign. Alexandria, Va.: Time-Life.
2. Powers, J. R., 1988. “A Structured Approach to Schedule Development and Use.” Project Management Journal. 19(5): 39–46.
3. Adler, P. S., et al. 1996. “Getting the Most out of Your Product Development Process.” Harvard Business Review 74(2): 134–152.
4. Mohanty, R. P. and M. K. Siddiq. 1989. “Multiple Projects-Multiple Resources Constrained Scheduling: A Multiobjective Analysis.” Engineerings Costs and Production Economics 18(1): 83–92.
5. Leach, L. P. 1999. “Critical Chain Project Management Improves Project Performance.” Project Management Journal 30(2): 39–51.
6. Sipos, A., 1990. “Multiproject Scheduling.” Cost Engineering. 32(11): 13–17.
7. Ireland, L. R. 1997. “Managing Multiple Projects in the Twenty-First Century” at Project Management Institute 28th Annual Seminars and Symposium. Chicago.
8. Fricke, S. E. and A. J. Shenhar. 2000. “Managing Multiple Engineering Projects in a Manufacturing Support Environment.” IEEE Transactions on Engineering Management 47(2): 258–268.
9. Meredith, J. R. and S. J. Mantel. 2000. Project Management: A Managerial Approach. 4th ed. New York: John Wiley & Sons.
10. Rubenstein, A. M., et al. 1979. “Factors Influencing Success at the Project Level.” Resource Management. 16: 15-20.
11. Belanger, T.C. 1995. How to Plan Any Project. 2d ed. Sterling, Mass.: The Sterling Planning Group.
12. Bennett, J. 1981. Construction Project Management. London: Butterworth.
13. Harrison, F. L. 1983. Advanced Project Management. Hunts, U.K.: Gower Publishing Company.
14. Bowen, H. K., 1997. Project Management Manual. Boston: Harvard Business School Press.
15. Project Management Institute. 2000. A Guide to the Project Management Body of Knowledge. Drexell Hill, Pa.: Project Management Institute.
16. James, K. E., Jr. 1961. “Critical Path Planning and Scheduling: Mathematical Basis.” Operations Research. 10(3): 296–320.
17. Wiest, J. D. and F. K. Levy. 1977. A Management Guide to PERT/CPM. Englewood Cliffs, N.J.: Prentice Hall.
18. Crawford, M. 1992. “The Hidden Costs of Accelerated Product Development.” Journal of Product Innovation Management 9(3): 188–199.
19. Levy, F. K., G. L. Thompson, and J. D. Wiest, 1963. “The ABCs of the Critical Path Method.” Harvard Business Review 41(5): 98–108.
20. Snowdown, M. 1981. Management of Engineering Projects. London: Butterworth.
21. Miller, R.W. “How to Plan and Control with PERT.” Harvard Business Review. 1962. 40(2): 92–102.
22. Crandall, K. 1973. “Project Planning with Precedence Lead/Lag Factors.” Project Management Quarterly 4(3): 18–27.
23. Kent, B. H. 1997. Project Management Manual. Boston: Harvard Business School Press.
24. Goldratt, E. 1997. Critical Chain Project Management. Croton-on-Hudson, N.Y.: North River Press.
25. Wheelwright, S. C. and K. B. Clark. 1992 “Creating Project Plans to Focus Product Development.” Harvard Business Review: 70–82.
26. Wheelwright, S. C., S. C., and C. K. B. 1992. Revolution Product Development: Quantum Leaps in Speed, Efficiency, and Quality. New York: Free Press.
27. Kania, E. 2000. “Measurements for Product Development Organizations.” Visions 24(2): 17–20.
28. Herroelen, W. and R. Leus. 2001. “On the Merits and Pitfalls of Critical Chain Scheduling.” Journal of Operations Management. 19(5): 559–577.
29. Steyn, H. “2000. An Investigation into the Fundamentals of Critical Chain Project Scheduling.” International Journal of Project Management. 19(6): 363–369.
30. Elton, J. and J. Roe. 1998. “Bringing Discipline to Project Management.” Harvard Business Review 76(2): 78–83.
31. Pinto, J.K. 2002. “Project Management 2002.” Research Technology Management 45(2): 22–37.
32. Zalmenson, E. 2001. “PMBOK and the Critical Chain.” PM Network. 15(1): 4.
33. Kuprenas, A. J. 2001. “Project Management Workload-Assessment of Values and Influences.” Project Management Journal 31(4): 44–51.
34. Cusumano, M. A. and K. Nobeoka. 1998. Thinking Beyond Lean: How Multi-Project Management Is Transforming Product Development at Toyota and Other Companies. New York: The Free Press.
35. Lock, D. 1977. Project Management. 2d ed. Westmead, U.K.: Gower Publishing Company.