
3
Project Portfolio Mapping
Balance is beautiful.
Miyoko Ohno
Major topics in this chapter are tools for mapping project portfolio:
- Traditional Charts
- Bubble Diagrams
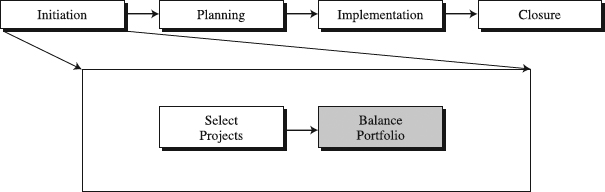
Figure 3.1 The role of portfolio mapping tools in the standardized project management process.
They have a simple purpose: to help companies obtain a balanced portfolio of projects, including existing and newly selected ones (see Figure 3.1). The logic here is that the investment firms are seeking to balance their growth versus income stocks and domestic versus international investments, and spread them out across industries, all in an attempt to acquire a well-diversified portfolio of investments. The analogical use of this concept in project-driven organizations strives for a portfolio of projects that are optimally diversified in terms of a certain number of key dimensions. By supporting such diversification, portfolio planning tools also facilitate the alignment of projects with the organization's strategy while balancing risks involved in projects.
This chapter's goal is to help practicing and prospective project managers
- Learn how to use various project portfolio mapping tools.
- Select those tools that account for their project situation.
- Customize the tools of their choice.
Internalizing these skills has a powerful and positive impact on initiating projects and building a standardized PM process.
Traditional Charts for Portfolio Management
What Are Traditional Charts for Portfolio Management?
These charts are numerous forms of traditional tools, such as histograms, bar graphs, and pie charts, shown in Figure 3.2, that can successfully picture project portfolio balance. Flexibly designed, they do not set limits on project dimensions/parameters to display [2]. Rather, the charts can present various dimensions from project size to resource allocation to earned value to timing. Presenting relative proportions of these dimensions, the charts indicate their distribution, offering managers an opportunity to balance it according to their goals.
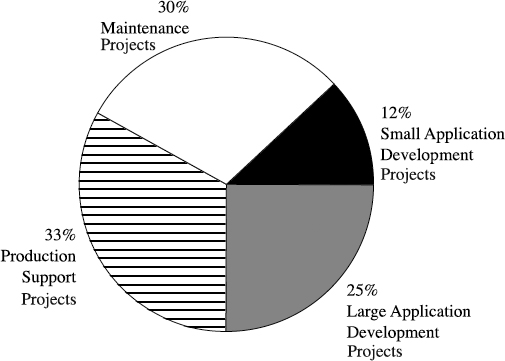
Figure 3.2 Pie chart for spending allocation per project type.
Constructing the Traditional Charts
Prepare Information Inputs. The act of balancing a project portfolio is deeply rooted in quality information about the following:
- Strategic and tactical plans
- Active projects
To determine which dimensions matter and will be presented on a chart, you need to look at the strategic and tactical plans of an organization. Then information about projects from the active roster can be fed into building the chart.
Select the Type of Chart. What portfolio dimensions do you need to balance? The answer to this question dictates the type of chart you pick. For example, if there is a need to portray the spending allocation across types of projects, a good choice is the pie chart. In one case of a software applications development group, management wanted to verify that their resource allocation is in tune with their strategic goals. The pie chart, they decided, can do this job.
There are no hard-and-fast rules for selecting the type of chart. For example, instead of the pie chart from Figure 3.2, management could have chosen a histogram. Apparently, their belief was that the pie chart's simplicity and visual impact more clearly projected where project dollars go than the histogram. As in this example, personal preference and past experience are influential in deciding which charts to use. Another concern is the number of charts to prepare. Go for the minimum number that meets information needs of portfolio balancing.
Draw the Chart. A look at Figure 3.2 reveals that we need to draw a pie with its wedges. While the total pie represents total resource allocation, the wedges reflect spending for each project type. Therefore, in drawing the chart, either manually or by computer, you need to enter the project type information and appropriate percentages. Similarly, drawing other chart types is straightforward.
Interpret the Chart. Interpretation of the chart is made possible by comparing the current balance with the desired balance, which is typically part of the strategic goals set by management. As for the current balance, the message from Figure 3.2 seems to be rather clear:
- The majority of resources (63 percent) are allocated to maintenance and production support projects.
- The minority of resources (37 percent) is consumed in applications development projects, small and large.
The desired or right balance is that 80 percent of resources be allocated to the applications development projects, the remaining 20 percent to maintenance and production support projects. Apparently, there is a huge gap between the current and the right balance. A balancing action is a necessary element—one that the chart is not designed to provide. Rather, it is management's job to determine and take such action.
Balance. This is the step directed at taking a management action to close the gap between the right and current balance. In the example from Figure 3.2, what are the options available to management? Specifically, they can
- Increase the number of applications development projects. For this approach to be possible, there must exist a sufficient number of quality project proposals in the pipeline of project selection.
- Decrease the number of maintenance and production support projects. The assumption here is that another approach can be put in place to avoid the disruption of production support.
In this case, it is quite clear that balancing actions must be closely synchronized with the processes of project selection and production support. What this really hints at is that portfolio balancing is not a simple, standalone operation. Instead, it is often part of a wider system including strategic planning, project selection, project implementation, and operations management.
Utilizing Traditional Charts
When to Apply. Traditional charts fit both purposes, presenting small and large projects in a portfolio. In deciding when to use them, an important factor is that their information richness is lower than that of bubble diagrams. Consequently, simpler displays of the project portfolio favor the application of the charts over the diagrams. On a similar note, managers are much more familiar with the charts than the diagrams, giving the charts an edge in comparable display situations and especially when deciding where to start when balancing project portfolio for the first time (see the box that follows, “Start Where the Money Is Being Spent Now”).
Time to Complete. Drawing a Traditional Chart is a quick and effective action. Once the necessary information is prepared, it takes minutes to get the chart done. Balancing activities following the preparation of the chart may take a group of managers hours or even a day or two.
Benefits. The value the charts create for the users is in their capacity to clearly display information important to balancing. In that sense, however, the charts are even more imperfect than Bubble Diagrams. For example, while the diagrams can hint which of their quadrants are more or less desirable for projects, the charts cannot do that. To a significant extent, this is the consequence of their lower information richness compared to the diagrams.
Advantages and Disadvantages. Traditional Charts' advantage is in their
- Simplicity. Preparing the charts or reading them poses almost no challenge to their users. As a consequence, their simple design and appearance offer no-training-required opportunity to use them.
- Familiarity. Since they have been in use for a long time, managers are accustomed to them, a nice advantage when they can be used for the portfolio balancing.
- Flexibility. The charts function like shells: while their external appearance doesn't change, inside you can insert any dimension that fits. This enables using the charts to display almost any project dimension or parameter.
Start Where the Money Is Being Spent Now
Many managers did not consider what is the right balance for their portfolio of projects. If you are one of them, ask yourself, do I know the current breakdown of either my projects or spending? We asked this of a manager of an applications development group and she could not tell what percent of funding was going to her project categories/types, new software development projects versus upgrades versus support of the existing products. One way to begin balancing the portfolio of projects is to assess the current breakdown of project spending:
- What is the total project spending now?
- What percentage of the spending goes to each category of projects?
You can also consider the breakdown by project timing (completion dates or in which phase is the project currently). This information can be collected from project teams and charted. That is your current portfolio, a good start with which to approach your management to determine the desired portfolio. Since the essence of management's job is resource allocation, setting adequate spending goals is a crucial issue.
A disadvantage identified by some experts is their
- Oversimplification. Charts such as pie charts contain such basic information that some experts question their ability to display information meaningful to balancing a portfolio of projects.
Variations. Variations of Traditional Charts remind us of life forms in that they are strikingly numerous. Figure 3.3 presents a histogram for the timing of project completions with five parameters: each project in the portfolio, the allocation of resources to each project, resources per quarter, resources per product line, and when the projects will be completed. This chart is very convenient in balancing a project pipeline to produce a continuous stream of projects, without sudden peaks and valleys. Also, it is helpful in balancing resources across the product lines.
Another traditional chart, the bar graph, is shown in Figure 3.4. Again, the focus is on resource allocation, indicating four parameters: projects, budgeted, actually consumed, and earned value resources. The major purpose of the graph is to detect which projects are using resources slower or faster than planned, so the resources may be moved from where they are not needed to where they are needed. For example, project Z is overspending and possibly may need more resources. By contrast, project X may use fewer resources than planned, which may make it possible to reallocate the resources to project X. Where on the bar graph do we see this? We see it in the ratio of earned value bar over the actual bar (also called cost performance index, see Chapter 13).
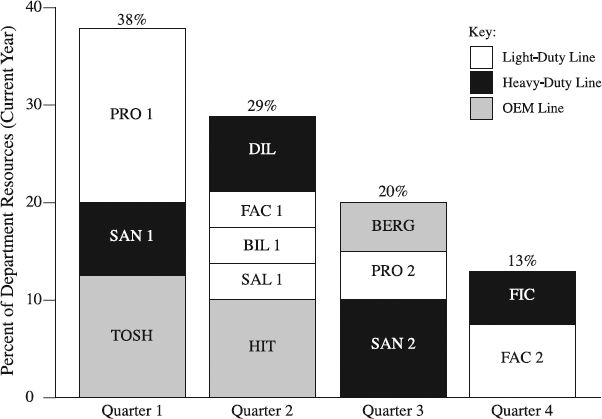
Figure 3.3 Histogram for timing of project completions.
From PORTFOLIO MANAGEMENT FOR NEW PRODUCTS by ROBERT G. COOPER, SCOTT J. EDGETT and ELKO J. KLEINSCHMIDT. Copyright © 1998 Robert G. Cooper, Scott J. Edgett and E.J. Kleinschmidt. Reprinted with permission of Perseus Books Publishers, a member of Perseus Books, L.L.C.
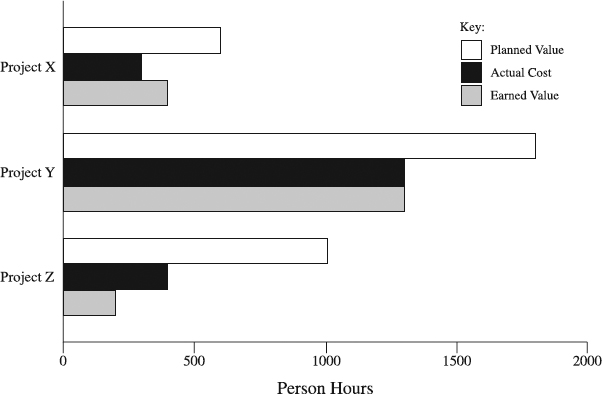
Figure 3.4 Bar graph for resource allocation.
Customize Traditional Charts. Although the charts presented here are beneficial, they may not exactly match your needs. That creates a need to analyze the available formats and features of the charts, and select and adapt them to maximize their value for your projects. Following are a few ideas regarding how to go about the adaptation.
| Customization Action | Examples of Customization Actions |
| Define limits of use. | Choose to use a few charts only. Coordinate the selection with the selection of Bubble Diagrams so they are complementary. |
| Make sure they best fit your strategic and tactical plans and goals. | |
| Select dimensions for each of the chosen charts. | |
| Tie the use of the charts with project selection tools. Purpose: to select and balance projects simultaneously. | |
| Use the charts in portfolio review meetings and project phase reviews. | |
| Adapt a feature. | Fit any project dimension in the charts that you need, since they are designed to display almost any project parameter. |
Make sure you prepare the Traditional Charts properly. They should show the following:
- Chosen project dimensions or parameters
- The scale for dimensions
Summary
This section dealt with forms of traditional tools, such as histograms, bar graphs, and pie charts, that have the capacity to provide simpler displays of information important to balancing a project portfolio. They are also helpful when organizations are using portfolio displays for the first time. Although these charts are convenient for presenting both small and large projects in a portfolio, understand that they are not capable of suggesting the actions to balance an unbalanced portfolio. To be truly effective, the charts must be customized for your specific situation. The key points about what the charts should show are highlighted in the box above.
Bubble Diagrams
What Is the Bubble Diagram?
Bubble Diagrams are information displays that visually show projects' key parameters necessary to successfully balance a project portfolio (see Figure 3.5). Typically, x and y axes of the diagram represent two of the key dimensions/parameters. Adding the bubble to the diagram indicates the position of the project on the two dimensions, while its size and color may point to additional parameters such as size, percent complete, project type, and so forth. Spread around the diagram, bubbles visualized as projects help managers decide whether they are rightly distributed along key dimensions. If not, managers can take a balancing action.
Constructing the Bubble Diagram
Prepare Information Inputs. Aiming at balancing a project portfolio calls for quality information about the following:
- Strategic and tactical plans
- Project selection criteria
- Project roster with projects' numerical scores
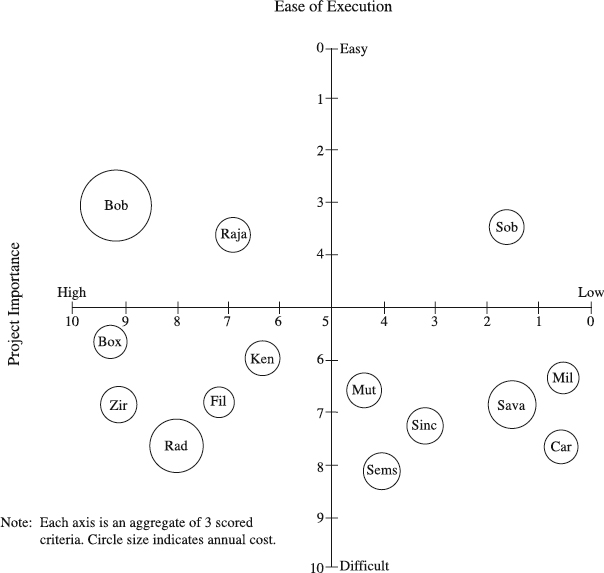
Figure 3.5 A Bubble Diagram of ease of execution versus project importance.
From PORTFOLIO MANAGEMENT FOR NEW PRODUCTS by ROBERT G. COOPER, SCOTT J. EDGETT AND ELKO J. KLEINSCHMIDT. Copyright (c) 1998 by R.G. Cooper, S.J. Edgett and E.J. Kleinschmidt. Reprinted with permission of Perseus Books Publishers, a member of Perseus Books, L.L.C.
These plans and project selection criteria help frame the balancing problem in terms of which dimensions will be on the diagram. The product of the project selection process includes both the list of the existing and newly selected projects; the actual project roster is what are displayed on the Bubble Diagrams and then balanced. We say accurate roster because some managers have the tendency to informally add their pet projects to the formal, official roster. If all of these are not included in the balancing act, there is a real risk of mismatch of the required versus available resources and related schedule delays. Project scores are inputs in the diagram that are obtained by means of scoring models for each of the dimensions of the diagram.
Select the Type of Chart. Making a choice of chart begins with clear understanding of dimensions on the axes of the Bubble Diagram (see the “This Is Not the Old BCG Matrix” box that follows). Options are numerous, as the following sample list indicates [3, 4]:
- Return (financial, multiple criteria-based)
- Life cycle phases (concept, planning, execution, closure)
- Completion date (months, years)
- Strategic fit or importance (low, medium, high)
- Quality of resources (low, medium, strong)
- Project costs (dollars, resource hours)
- Probability of success (technical and commercial expressed as percentages)
- Ease of execution (difficult-easy continuum)
- Project categories (R&D, engineering, manufacturing, marketing, maintenance, etc.)
- Project types (e.g., product development—platforms, derivatives, enhancement, joint ventures, etc.)
- Market segments (market A, market B, etc.).
Any pair can be used as x and y axes on the bubble chart to help describe the portfolio and depict the balance. When charts' dimensions are selected, they are likely to belong to one of these groups:
- Scoring models-based charts (e.g., project importance versus ease of execution)
- Risk-return charts (e.g., adjusted NPV versus the probability of technical success)
- Other Bubble Diagrams (e.g., project costs versus life cycle phases)
This Is Not the Old BCG Matrix
When first exposed to Bubble Diagrams many people are quick to notice that these are the same as Boston Consulting Group matrix (or GE or McKinsey matrices) of the 1970s [1]. Actually, they are not. Old matrices were used to plot the existing strategic business units on market attractiveness versus competitive position matrix, capturing the present state of the units. Project Bubble Diagrams add newly selected projects to the existing projects, focusing on the future. In addition to this difference in unit of analysis and time horizon, dimensions of the diagram are also very different, ranging from probability of technical and commercial success to the ease of project execution. Many dimensions are used as shown in the preceding list.
Do You Agree with This Portfolio Verdict?
The first thing Peter, Star Tech's new software development (SD) manager, did was to convene a meeting to overview the status of SD projects. There he learned that projects were taking far too long. His feeling was that the pipeline was clogged with too many projects—28. Apparently, there were some really good projects. What perplexed him was the large number of sub par projects. No two of them were in the same product performance/market segment area. This approach was strategically scattershot. There was really no glue to bond all those projects; the total lack of focus was more than evident.
All of the projects held a promise of high reward, obviously a good sign. The problem is that all of them also were highly risky, with a reasonable probability to fail technically or commercially. Almost all projects were long term. The absence of “quick hits” to balance the long-term development projects was apparent. Also, almost all projects were in the programming phase, with no new projects in the requirements definition or closure phase. “Okay,” Peter thought to himself. “Now, the groups of issues seem clear. In order to talk to my reports, I need to summarize this into a few words, describing where our portfolio is as of now. Would the following description make sense?”
- Overall, our portfolio stinks!
- Our portfolio is unfocused!
- Too many projects; resources spread too thinly!
- Too many poor projects!
- Our portfolio is poorly balanced!
- Our portfolio does not support our business strategy!
Agree?
Apparently, no single chart can comprehensively characterize a portfolio. That prompts the question of how many charts do you need? And which ones? Multiple charts may be necessary, but you must also avoid proliferation of charts and possible information overload. Therefore, shoot for a maximum of several charts that can accurately capture major strategic requirements of project portfolio. Consider, for example, the “Do You Agree with This Portfolio Verdict?” box above. To catch graphically problems related to the portfolio, the manager would need Bubble Diagrams indicating the following:
- Project types versus market segments
- Completion date versus life cycle phase
- Risk (probability of success) versus return
Also, a traditional chart comparing required resources and available resources would help detect the lack of a resource balance. Once the inputs have been prepared and charts selected, it is time to chart projects on the Bubble Diagram.
Chart Projects. Take a look at Figure 3.5. Drawing the x and y axes, labeling them, and entering the scale is a logical first step. Labels we have chosen are dimensions of project importance and ease of project execution. This type of the diagram is based on scoring models for project selection. In this example, each dimension's scale is a numerical average of three constituent scales. For project importance those include strategic importance to company goals), organizational impact (e.g., profitability or customer impact), and economic benefits (e.g., dollar savings or revenue growth). Ease of execution, on the other hand, relates to cost of execution, project complexity (e.g., difficulty of implementation), and resource availability. The intent here is to assess the project in a comprehensive, multicriteria fashion. When scales are set, use scores for each dimension's three elements to develop averages and chart projects from the roster on the diagram (see the box that follows, “Use Project Scores from Project Selection”).
Interpret the Diagram. Look for projects in favorable quadrants (the upper left of the diagram in Figure 3.5), dissecting those in the “low importance and difficult to do” quadrant, striving to balance ease and importance of projects. In particular, in Figure 3.5:
- Easy-to-do projects are in short supply, just three out of 14. We need more of these “low-hanging fruit” projects when seeking a balance between easy-to-do and difficult-to-do projects.
- There are only two projects in the most sought after upper left quadrant, an intolerably low number. Perhaps, too few proposals for these diamond projects are submitted for project selection.
- Another headache looms on the horizon: too many projects, six precisely, are in the lower right quadrant. This is the most unpleasant place to be in. Consider which to eliminate.
- Five projects are of high importance but difficult to do. Perhaps there are ways to remove some barriers to ease of implementation.
In this relatively simple example, the Bubble Diagram demonstrates its forté, the ability to display project information well. It also demonstrates what it cannot do: suggest what action to take to balance the portfolio.
Balance. Managers must make a decision to act and balance the portfolio. After an in-depth analysis of the Bubble Diagram and pertaining project information related to Figure 3.5, the following balancing actions could be taken:
- Increase the number of easy to do projects. How? Review again projects on hold, searching for easy opportunities to upgrade them to an easier-to-do status.
- Increase the number of the most sought after projects in the upper left quadrant by reviewing again all promising project proposals that didn't make the cut in the project selection process. Can their ease of doing or project importance be improved by modifying their scope, resource requirements, and implementation plan? Also, encourage more project proposals to be submitted that fit this quadrant.
- Kill three projects with the lowest importance.
- Increase the ease of implementation of all five projects in the high-importance, difficult-to-do quadrant. Review and improve their resource commitments. Analyze and overcome the most difficult barriers in milestone reviews (e.g., the barriers may be in technology integration, production, assembly, or testing).
These are sample actions, not magical solutions. They are here to hint at the essence of balancing, a need for conscious, well-informed decisions to spread out the risk. Often that will require going back to the project selection step and strategic plans, reexamining all choices, and changing some of them to achieve the desired balanced portfolio. Strategic planning, project selection, and portfolio balancing steps are most effective when intertwined.
Utilizing Bubble Diagrams
When to Apply. Bubble Diagrams are versatile tools that can be used in multiple ways. One of them is the hierarchical format, starting on the top of the company (a Bubble Diagram for top strategic projects) and cascading through portfolios of different organizational levels (e.g., a Bubble Diagram for the marketing or R&D department) all the way down the group level (a Bubble Diagram for a multiproject manager). In this application, each lower-level Bubble Diagram supports one above it, enabling the integration of all company projects into an overall portfolio. Although effective, the hierarchical format is also very demanding, which is perhaps why its use is not high. More frequently used is a decentralized format, where different groups in the company construct Bubble Diagrams for their own projects, independently of each other. Good examples are new product, information technology, and manufacturing groups. In this context, the Bubble Diagrams are employed for periodic reviews of the project portfolios, quarterly or semiannually. Those who favor project phase reviews (also called go/kill points) for major projects may use Bubble Diagrams to compare the reviewed project with other projects when deciding to continue it or terminate it. An innovative application of the diagrams is in the setting of multiple projects management. Faced with the pressure of managing six or seven projects at a time, multiproject managers tend to use the Bubble Diagram to control their workload across dimensions of the project size and project phases. (Don't have two large projects simultaneously in the planning stage!)
Use Project Scores from Project Selection
When considering a portfolio approach, many managers go beyond using only financial metrics. Rather, they rely on multiple criteria. A good option for this situation is to build a risk-reward Bubble Diagram, in which axes are based on the same scored criteria that were used in the scoring model to rate, rank, and select projects (see Chapter 2). Furthermore, project scores obtained in the selection process become inputs to your risk-reward Bubble Diagram. That provides a seamless consistency between the project selection and portfolio balancing.
Time to Complete. Provided that information about projects is readily available, constructing a Bubble Diagram is a quick action. Constructing a diagram with 20 projects may take a group of decision makers only a few minutes, especially with the advent of the powerful computer programs. Where time is really consumed is in analyzing the diagram—debating its strengths and weaknesses, opportunities and threats—and making decisions to balance. These steps may take several hours to a full day of the group time.
Benefits. It is difficult to argue against the basic value of the diagrams and its ability to act as a meaningful information display. To many experts this is the reason for the popularity of Bubble Diagrams. The diagram indicates projects that are in more preferred quadrants, for example, high-importance, easy-to-do projects. Similarly, it helps discern projects in less desired quadrants, for example, low importance, difficult-to-do projects. Additionally, the sense for the utmost importance of balancing projects across the desired quadrants comes across pretty clearly. Such a visual demonstration of the project portfolio is unmatched by other tools such as economic methods or scoring models.
Despite benefits of the Bubble Diagrams, some users see some serious imperfections in them [5, 6]. The diagram is designed to act as an information display of a project portfolio, not as a decision model. Therefore, it does not contain a mechanism to help make decisions. In particular, scoring models are designed to be decision models to generate project rankings, whereas bubble diagrams cannot balance the portfolio. Rather, they only offer a starting point for management to make decisions and define actions. Bubble Diagrams cannot tell what is the right balance. Management must define the right balance and compare it against the actual balance. In addition, Bubble Diagrams do not spell out how they should be used; management needs to decide how to use them, for instance, when to change the balance, terminate some projects, or add new ones. However, while some might view these imperfections as design flaws, others may argue that this tool does what is designed for well: display information about portfolio balance.
Advantages and Disadvantages. Bubble Diagrams offer substantial advantages through their
- Simplicity. Their user-friendliness and ease of use are so high that many first-time users need little or no training to construct or read them.
- Data-based view. Bubble Diagrams offer an unbiased view of the data, not tainted by someone's opinion.
The problems with the Bubble Diagrams may result from the following:
- Information overload. Because there are so many different Bubble Diagrams, too many of them may be used, increasing rather than decreasing the complexity of the balancing assignment.
- Inappropriate data. If the choice of data used to create the diagram is not carefully made, the resultant diagram may be misleading.
Variations. Also called portfolio maps and portfolio matrices, Bubble Diagrams come in all kind of varieties [7, 9]. Figure 3.6 illustrates a risk-return version of the diagram that is very popular in research and development projects. The diagrams indicate the following:
- Too much spending for the bread-and-butter projects. These should be small, simple projects with a high probability of success, but low reward. Instead, an inordinate amount of work is being spent on trivial projects.
- There is good number of “pearls,” projects with high likelihood of success able to produce high returns. These are potential star projects.
- Two “oysters” are probably a good number of projects, viewed as long shots that may generate high returns but with low probability to succeed.
- The “white elephant” quadrant has only one project, a good number. These are low-return projects with a low likelihood of success.
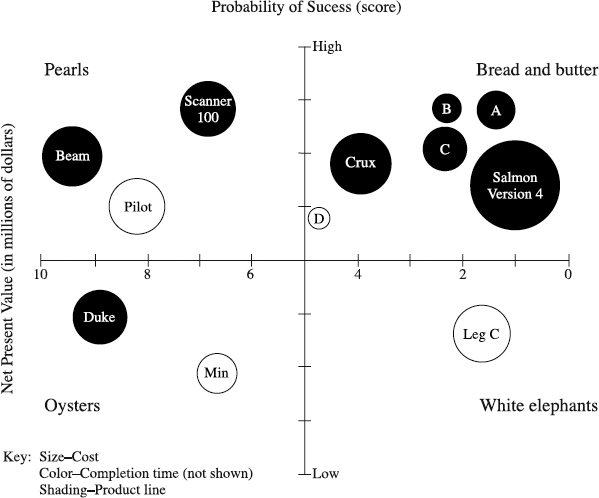
Figure 3.6 A risk-return bubble diagram.
From Marheson, D., Matheson, J.E. and Menke, M.M., “Making Excellent R&D Decisions,” Research-Technology Management, November-December 1994. Copyright © Industrial Research Institute. Reprinted with permission of Industrial Research Institute.
Another popular variation is completion date versus life cycle phase Bubble Diagram, shown in Figure 3.7. The diagram indicates the following:
- All smaller projects will be completed around the end of year 1. All large projects will be completed around the end of year 2. This is a very poor balance, needing an action to spread projects along the pipeline. A balance of projects of different sizes is also desired.
- There is a solid balance of projects across life cycle phases, both small and large projects.
Customize Bubble Diagrams. We have only shown a few generic types of Bubble Diagrams. They may be customized a myriad of ways. We suggest you study the generics and adapt them to fit your project situation. Following are a few ideas to spur your customization action.
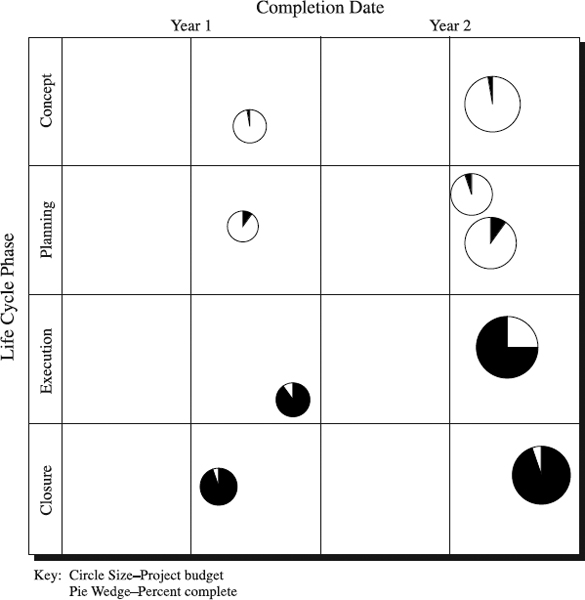
Figure 3.7 A Bubble Diagram of completion date versus life cycle phase.
Summary
This section was about Bubble Diagrams, information displays that visually show projects' key parameters necessary to successfully balance a project portfolio. They are also helpful in project phase reviews when deciding to give a project the go-ahead or terminate it. Similarly to the Traditional Charts, Bubble Diagrams cannot suggest actions to balance an unbalanced portfolio of projects. However, they can indicate the importance of balancing projects across the desired quadrants. Customizing the diagrams for specific situations is the most effective way for their use. Following is a checklist to help you construct a Bubble Diagram.
Bubble Diagram Check
Be sure to adequately construct the Bubble Diagram. It should show the following elements:
- Chosen dimensions on the x and y axes
- The scale for dimension
- Projects as bubbles in quadrants, balanced as determined by management
Concluding Remarks
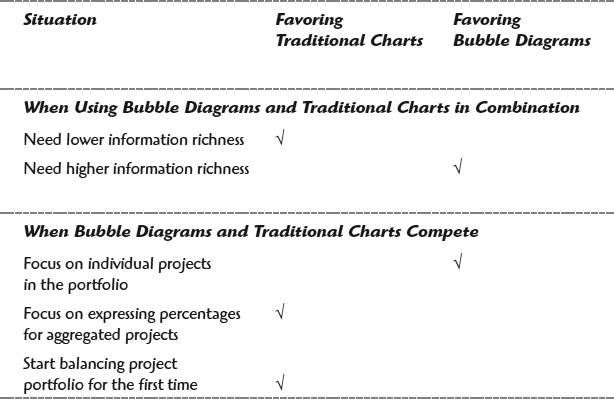
We have covered two distinct families of project portfolio mapping tools in this chapter: Traditional Charts and Bubble Diagrams. Each one features a host of forms. When designed to display two or three parameters, Traditional Charts can be used alongside Bubble Diagrams, for instance, using a pie chart similar to Figure 3.2 and a Bubble Diagram like Figure 3.5. Here the lower information richness of the pie chart shows well the big picture of the resource allocation across project types. This information is finely complemented by the higher information richness of the Bubble Diagram, with its details of the balance of individual projects in terms of their importance and ease of implementation.
When there is a requirement for higher information richness of the portfolio display, Bubble Diagrams and Traditional Charts are not compatible and compete against each other. For example, information in the histogram from Figure 3.3 can easily be displayed on the Bubble Chart. In that case, the Bubble Chart would provide a better focus on individual projects, showing them as standalone bubbles with different sizes. On the other hand, the histogram outperforms the diagram in showing cumulative percentages for aggregated projects in each quarter. Overall, Traditional Charts are simpler and better known to managers, suggesting that when a company wants to start balancing its portfolio of projects, the charts are an easier choice. The following table summarizes this information to help you select the proper tools in different project situations.
A Summary Comparison of Project Portfolio Mapping Tools
References
1. Harrison, J. S. and C. H. St. John. 1998. Strategic Management of Organizations and Stakeholders. 2d ed. Cincinnati: South-Western College Publishing.
2. Brenner, M. S. 1994 “Practical R&D Project Prioritization.” Research Technology Management 37(5): 38–42.
3. Buss, M. D. J. 1983. “How to Rank Computer Projects” Harvard Business Review 1(71): 145.
4. Cooper, R. G., S. J. Edgett, and E. J. Kleinschmidt. 1998. “Best Practices for Managing R&D Portfolios: Lessons from the Leaders—Part II.” Research Technology Management 41(4): 20–33.
5. Cooper, R. G., S. J. Edgett, and E. J. Kleinschmidt. 1997. “Portfolio Management in New Product Development: Lessons from the Leaders—Part I.” Research Technology Management 40(5): 16–19.
6. Cooper, R. G., S. J. Edgett, and E. J. Kleinschmidt. 1997. “Portfolio Management in New Product Development: Lessons from the Leaders—Part II.” Research Technology Management. 40(6): 43–52.
7. Archer, N. P. and F. Ghasemzadeh. 1999. “An Integrated Framework for Project Portfolio Selection.” International Journal of Project Management 17(4): 207–216.
8. Marheson, D., J. E. Matheson, and M. M. Menke., 1995. “Making Excellent R&D Decisions.” Research-Technology Management 37(6): 21–24.
9. Matheson, J. E. and M. M. Menke. 1994. “Using Decision Quality Principles to Balance Your R&D Portfolio.” Research-Technology Management 37(3): 38–43.