
14. Reporting in QuickBooks
One reason QuickBooks is so popular is for the ease in which you can get reports of your financial activity. On summary reports, you can “drill down” on a specific number in a report to see the underlying transactions, taking the guesswork out of determining where a number came from.
In this chapter, you learn about the many ways you can access, modify, and memorize often-used reports.
Using the Company Snapshot
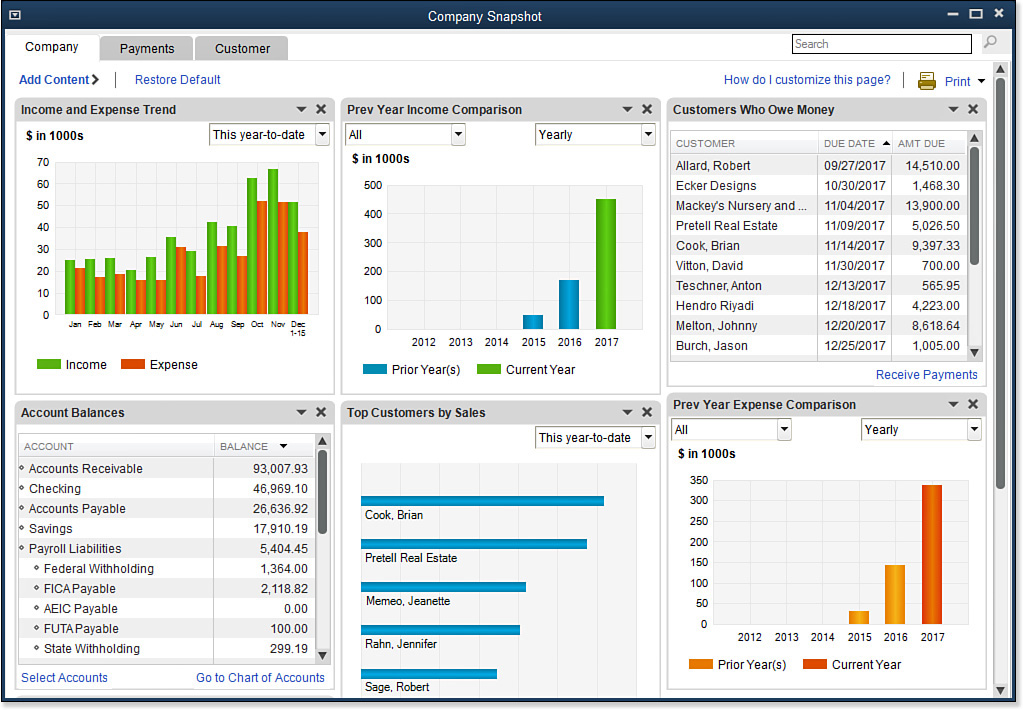
The Company Snapshot (see Figure 14.1) is one convenient place to review company information and perform important tasks. The QuickBooks Company Snapshot offers a real-time view of your company’s critical information. It provides insight into your business using a variety of analytic and performance indicators.
Figure 14.1. The Company Snapshot offers a wealth of useful information.
Customizing the Company Snapshot
QuickBooks offers the capability to customize the snapshot information on both a user and company file-specific basis, which can be helpful in multiuser environments. To customize your Company Snapshot, follow these steps:
1. From the menu bar, select Company, Company Snapshot to view the default graphs and reports.
2. Click Add Content to view and select from additional graphs and reports. See Figure 14.2.
Figure 14.2. Customize the Company Snapshot by adding or removing content.
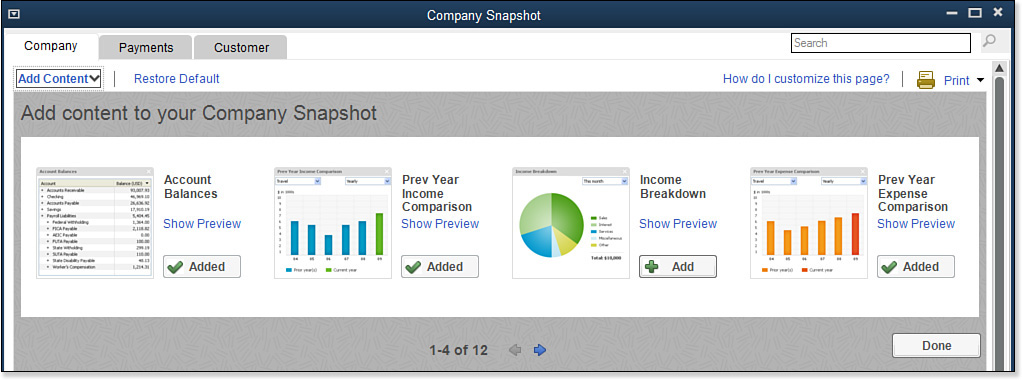
3. Click the + Add button next to a graph or report to add it to your Company Snapshot.
4. Click Restore Default to remove any graphs or reports you added.
5. Click Done to view your modified Company Snapshot.
6. To rearrange the order or placement of a graph and report, click and hold your left mouse button (a four-pointed arrow displays), drag the item to a new location, and release the button.
7. If you want to print the details of the snapshot, select one of the following options from the Print menu in the upper-right corner to print your snapshot or prepare it for printing: select Print, Print Preview, or Set Orientation.
Get an immediate view of the bottom line of your business with these reports available on the QuickBooks Company Snapshot:
• Account Balances—By default, View Balance Sheet accounts is shown. You can add any other account type to this view by clicking the Select Accounts link.
• Previous Year Income Comparison—View how much money you are making this year, compared to previous years for any or all accounts. You can view monthly, quarterly, weekly, or yearly comparisons.
Caution
If your company has created user restrictions in QuickBooks, users have access only to activities of the Company Snapshot that they have permission to access. If you do not want users to see the Income and Expense of the company, you must set restrictions for both Sensitive Accounting Activities and Sensitive Financial Reporting. To modify a user’s security rights, you must be logged in to the data file as the Admin user.
After you have set up the security, log in as that user and verify that the behavior is what you expect. For more comprehensive user security settings, consider using QuickBooks Enterprise Solutions 14.0.
• Income Breakdown—View your company’s largest sources of income.
• Previous Year Expense Comparison—Compare how much money you are spending this year compared to previous years for any or all accounts. You can view monthly, quarterly, weekly, or yearly comparisons.
• Expense Breakdown—View your company’s biggest expenses.
• Income and Expense Trend Graph—In a graph form, view the income and expenses of your business for the selected time period.
• Top Customers by Sales—Easily report on your top five customers, based on sales for a given period of time.
• Best Selling Items—Know which items and services customers are buying the most during a given period of time. You can view the data by amount or by units.
• Customers Who Owe Money—Review customers who owe your company money. Overdue items display in red. To sort any of the columns, click the column header in any of the panes. The Due Date shown is the earliest due date for all invoices or statement charges for that customer.
• Top Vendors by Expense—View your top five vendors, based on expenses for a given period of time.
• Vendors to Pay—Skip running the aged payables reports by adding this section to your Company Snapshot. Amounts in red are past due. To sort any of the columns, click the column header. The Due Date shown is the earliest due date that the vendor bills are due. The Amt Due column is the total ending balance for that vendor.
• Reminders—Never forget important tasks. Include these critical reminders in your Company Snapshot. Click the Set Preferences link in the Reminders box to customize what information you want displayed.
Defaulting the Company Snapshot as Home Page
If you want to have the Company Snapshot display when you first open a company file, follow these steps:
1. Click the Company Snapshot icon on the icon bar to open the Company Snapshot. Alternatively, from the menu bar, select Company, Company Snapshot.
2. With the Company Snapshot the only window open in QuickBooks, from the menu bar, select Edit, Preferences; then on the left side of the Preferences dialog box, select Desktop View.
3. On the My Preferences tab, click the Save Current Desktop option button. See Figure 14.3.
Figure 14.3. The desktop preference settings control what opens automatically when you launch QuickBooks.
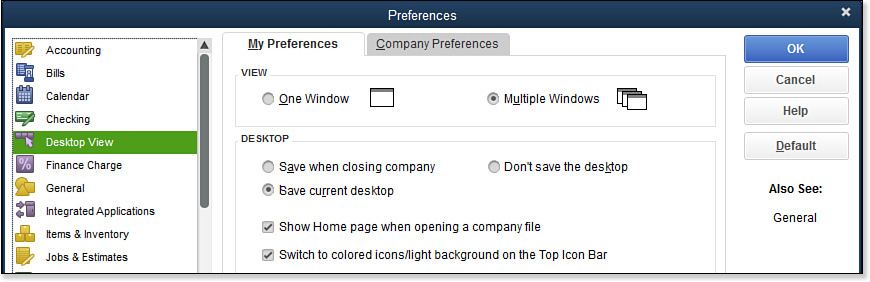
4. Uncheck the option Show Home Page When Opening a Company File. When you open your data file, the Company Snapshot automatically displays.
Report Center
Up to this point in the book, you have learned how to get started with QuickBooks and create a variety of transactions. In this chapter, you follow step-by-step instructions to create specific reports to assist you with your QuickBooks setup or review.
If you are new to QuickBooks or you have never reviewed the QuickBooks Report Center, you find out in this section about the many features that help you simplify your reporting needs in QuickBooks.
The Report Center is available in the following editions of QuickBooks: Pro, Premier, Accountant, and Enterprise.
To open the Report Center, on the icon bar, click Reports, or from the menu bar, select Reports, Report Center. The Report Center displays. Features of the Report Center include the following:
• Option to view the reports or graphs in Carousel view (see Figure 14.4), List view (see Figure 14.5), or Grid view (see Figure 14.6) by selecting one of the icons on the top right of the Report Center.
Figure 14.4. The QuickBooks Report Center looks like this in Carousel view.
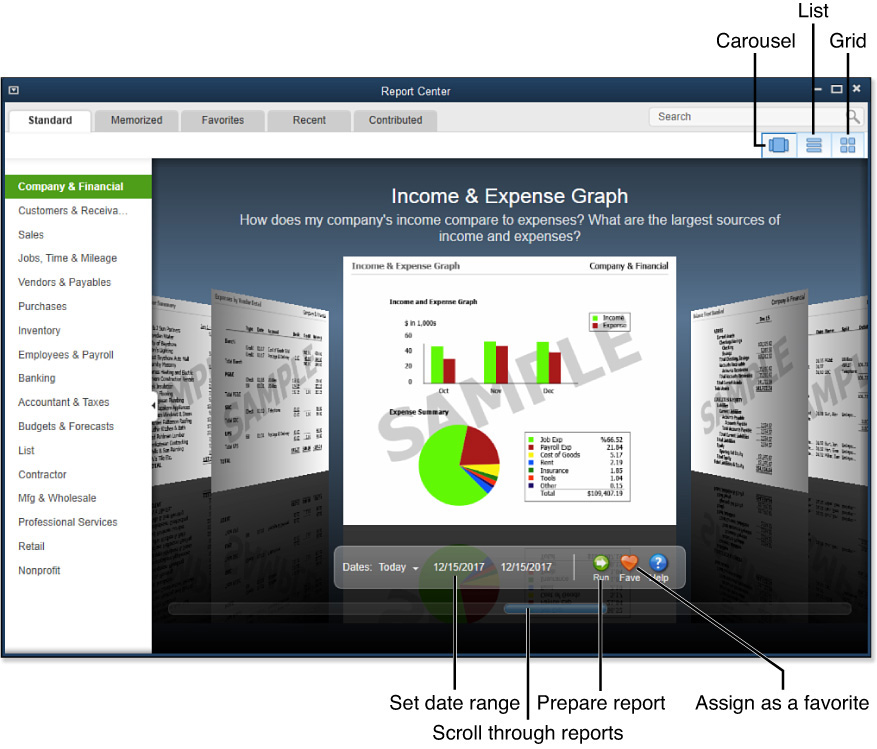
Figure 14.5. Optionally view your reports in List view.
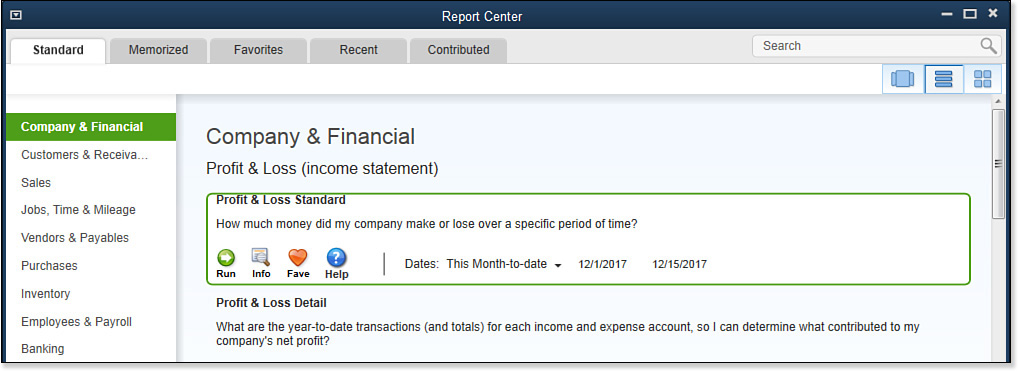
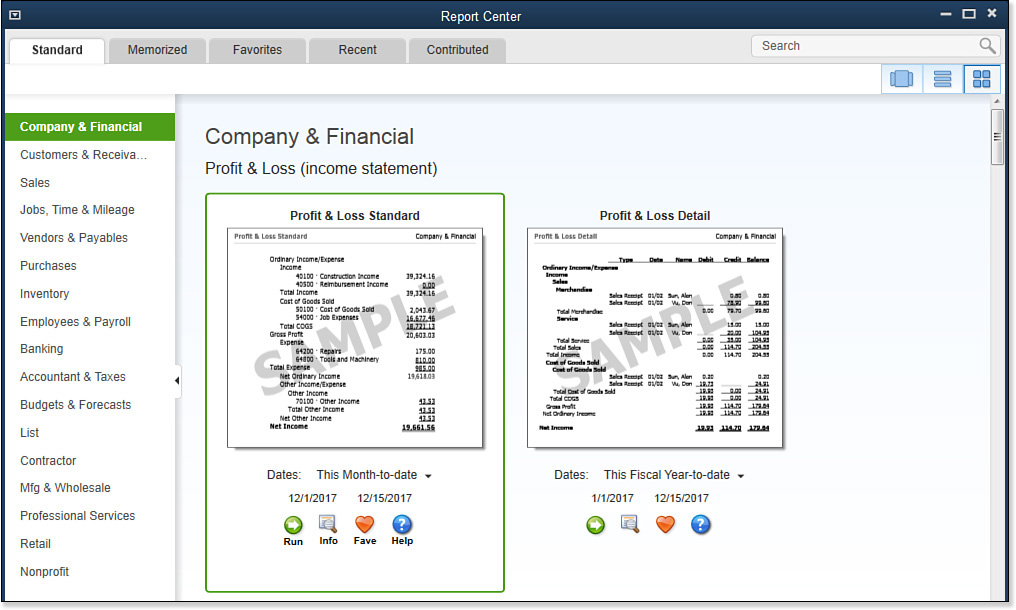
Figure 14.6. Use Grid view to find reports for your business.
• From the Standard tab, select a grouping of reports. Your displayed report groups might differ from those in Figure 14.4, depending on the version of QuickBooks you are using.
• In Carousel view, use the scrollbar at the bottom of the displayed report to move through samples of the reports available in the selected report group. Data displayed is sample data.
• Click the Dates drop-down list to select a specific date, or accept the default date. (You can also click the dates to modify.)
• Click the Run icon to display the report details with your company data.
• Click the Fave icon to mark or unmark a favorite. Marking a report as a favorite places it on the Favorites tab within the Report Center.
• Click the Help icon to open Help information about the specific report.
• Optionally, click the arrow notch on the left of Carousel view to close the menu report group listing.
The Report Center also includes a Contributed tab, which displays reports other QuickBooks users share. QuickBooks does not share any financial data from your company file. When you share a report, you are sharing only the report structure. If the report is filtered for specific chart of accounts or other unique user-defined data, you might not be able to share the report.
To share a report from the Memorize Report dialog box, select Share This Report Template with Others and follow the prompts to give the report a title and brief description, as well as other information.
Reports & Graphs Preferences
QuickBooks makes it easy to customize reports globally through Reporting Preferences. Reporting Preferences come in two types: My Preferences, which are unique to a logged-in user, and Company Preferences, which only the Admin or External Accountant user can set and which represent global settings for all users.
My Preferences
The My Preferences setting for reports is user specific. To access user-specific preferences for reports, from the menu bar, select Edit, Preferences. In the Preferences dialog box, select Reports & Graphs and click the My Preferences tab.
You can specify the following settings that are unique for the currently logged-in user (if using QuickBooks in a multiuser mode):
• Prompt Me to Modify Report Options Before Opening a Report—When selected, this option causes QuickBooks to open the Modify Report dialog box each time a report is opened.
• Reports and Graphs—You have a choice, when report details have changed, to request QuickBooks to select one of the following options: Prompt Me to Refresh (this is the default option for a new data file), Refresh Automatically, or Don’t Refresh. I usually choose the Refresh Automatically option. However, if the report is lengthy and you have multiple users entering data, you might want to review a report, make changes, and not have QuickBooks refresh at the time the change is made.
• Graphs Only—This option offers settings for drawing in 2D or using patterns.
Company Preferences
Different from the My Preferences setting for Reports and Graphs, Company Preferences can be set only by the Admin or External Accountant user and are global settings for all users.
To access Company Preferences for reports, log in as the Admin or External Accountant user in single-user mode and select Edit, Preferences from the menu bar. In the Preferences dialog box, select Reports & Graphs, click the Company Preferences tab, and set global defaults (for all users) for the following items:
• Summary Report Basis—You can choose accrual (default) or cash basis. Business owners should discuss this option with their accountant.
• Aging Reports—You can choose to age from the due date (default) or age from the transaction date. This setting determines the aged status of your accounts receivable and accounts payable reports.
• Reports—Show Items By—Choose from the following options:
• Name Only—Shows the item name/number on item-based reports.
• Description Only—Shows only the information typed in the Description field on item-based reports.
• Name and Description—Shows both the item name/number and the description on item-based reports. This is the QuickBooks default for a new file or when upgrading to QuickBooks 2014.
• Reports—Show Accounts By—Choose from the following options for displaying the account name and description on reports (see Figure 14.7).
Figure 14.7. Optionally, you can include a description in addition to the account name.
• Name Only—Shows the account name and account number, as in Figure 14.8 (if the Use Account Numbers preference is enabled).
Figure 14.8. This is the resulting report when the Name Only report preference is selected in addition to having the account numbering preference enabled.
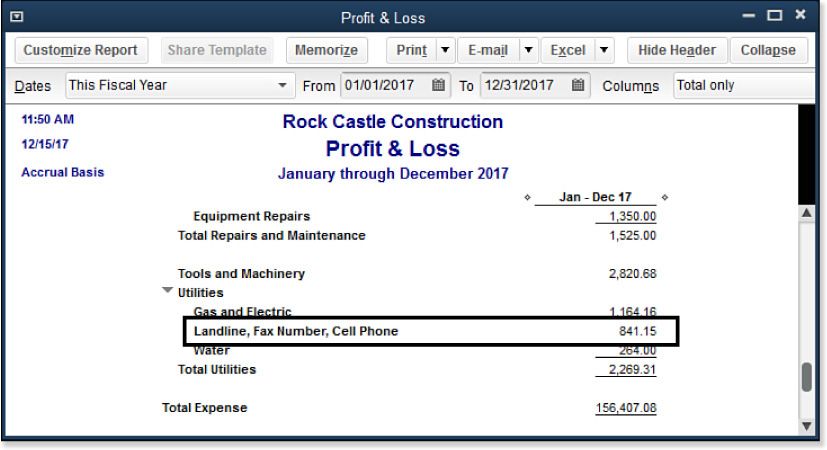
• Description Only—Shows only the information typed in the Description field (see Figure 14.9).
Figure 14.9. This is the resulting report when the Description Only report preference is selected.
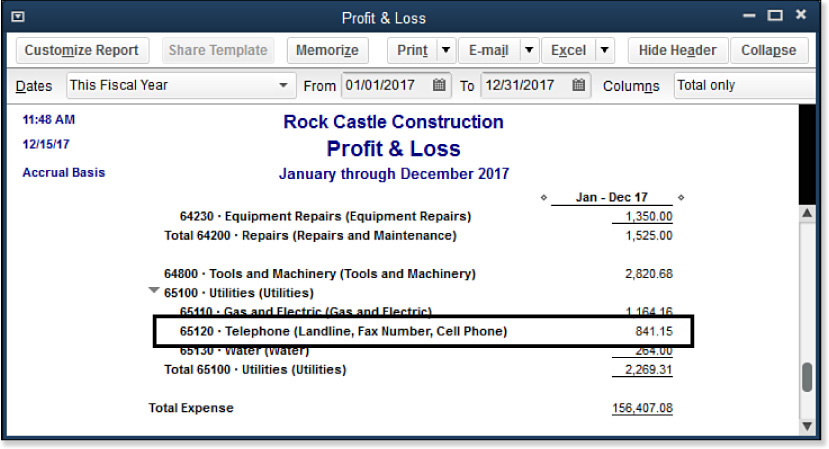
• Name and Description—Shows the account number, account name, and description (see Figure 14.10).
Figure 14.10. This is the resulting report when the Name and Description report preference is selected in addition to having the account numbering preference enabled.
• Statement of Cash Flows—View information about uses of Cash for Operating, Investing, and Financing activities. Click the Classify Cash button to open the Classify Cash dialog box and specify which accounts you want included in the Cash Flow analysis.
• Format—Click the Format button to set the following options globally for all reports:
• Show Header Information—Leave the default information in place. QuickBooks populates the report with this current information automatically.
• Show Footer Information—Enter an extra footer line, such as Confidential Information.
• Page Layout—Adjust the alignment from the default of Standard to left, right, or center justified.
• Fonts—On the Fonts & Numbers tab, you set the fonts for all text or specific text lines. As you select the text line on the left, QuickBooks displays the current font choice and size for that text. Click Change Font.
• Show Negative Numbers—Use this to define how negative numbers are formatted on reports. Format choices include normal, –300.00; in parentheses, (300.00); or with a trailing minus, 300.00–. Optionally, you can select to have these numbers print in red.
• Show All Numbers—Use this to divide all numbers by 1,000, to not show zero amounts, or to show numbers without the cents. Accounting professionals generally use these options when providing a statement to a bank, for example.
Modifying Reports
QuickBooks makes gathering information from your data quick and easy. Many reports already have been created and organized for your use, but you might occasionally want to modify an existing report. This section briefly discusses the options available when you want to modify a report.
Modifying Options Available on the Report Window
A few of the options to modify a report are available directly from any active report dialog box:
• Hide Header—Remove the header, or report title section, from the report. Click Show Header when you want it to display.
Tip
Each line on a report can be collapsed or expanded manually. To do this, click the gray arrow in front of any row report detail.
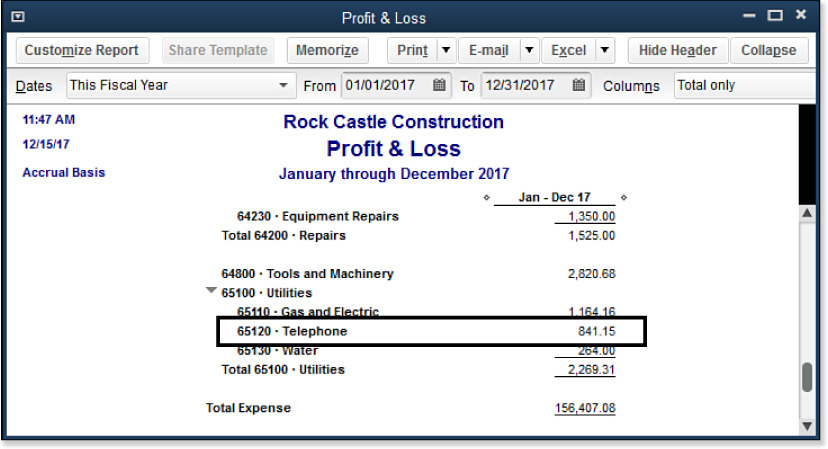
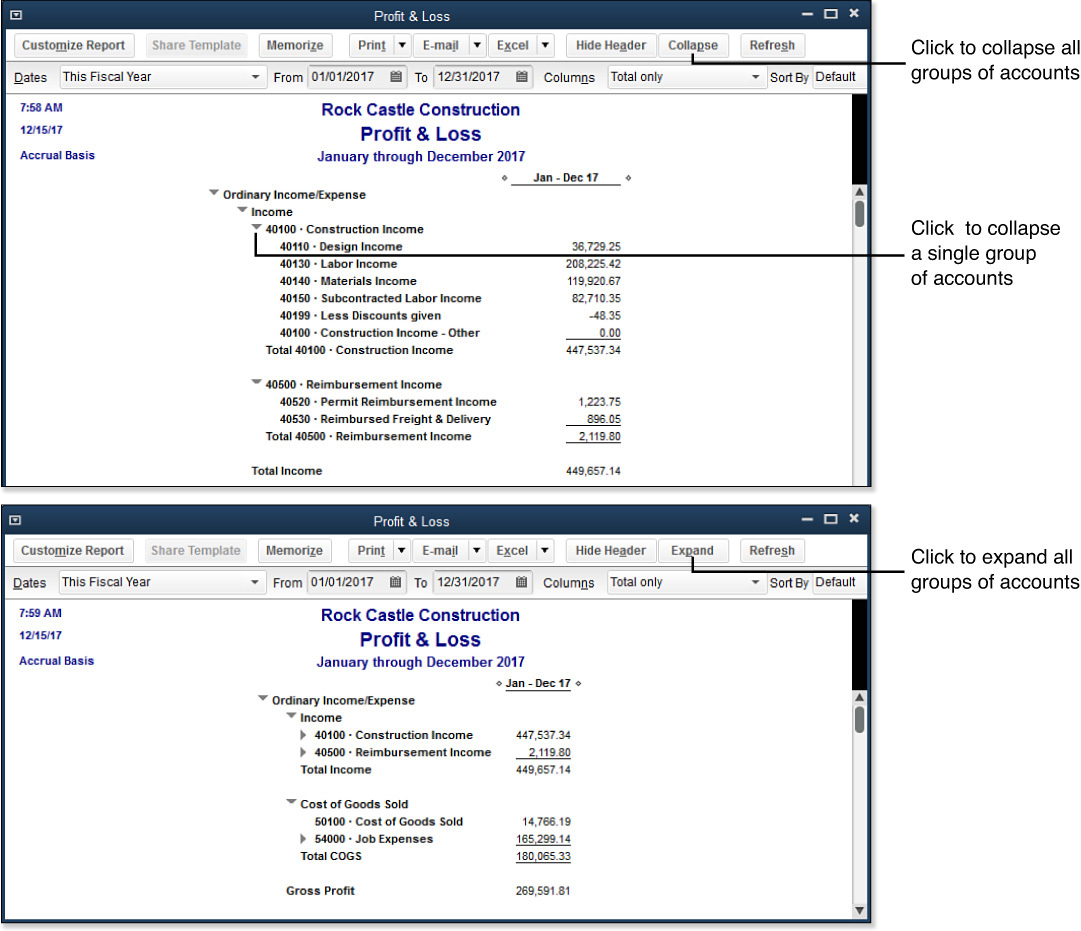
• Collapse—Collapse the information, as shown in Figure 14.11. This enables you to toggle a report between summary and detail views on-the-fly. When you click the Collapse button, QuickBooks removes the subaccount detail from view only.
Figure 14.11. Click the Collapse button on a report to roll up the subaccounts into the main account.
• Columns—For certain reports, enables you to easily control how the data is subtotaled or grouped and to add columns or subcolumns.
• Sort By—Groups the detail in useful ways for your review. I use this frequently, especially when looking at reports with many lines of detail. Your Sort By options will vary, based on the type of report you have displayed.
This chapter also discusses other options on the active report window, including customizing, memorizing, and exporting reports to Excel.
Note
New for QuickBooks 2014, when printing a report you can define the width and size of a report, including setting a large report to fit on a single page.
Customizing Reports
Click the Customize Report button at the top left of the open report dialog box. The options for modifying reports vary by report type. Some reports offer the following choices (others might not offer the same report-modification choices):
• Display tab—This tab opens automatically when you choose to customize an existing report. Depending on the report you choose, some or all of the following options are available:
• Report Date Range—Choose from the QuickBooks predefined date ranges, or set a custom date range for your report.
• Report Basis—Choose Accrual or Cash. This option is not available on all reports. This enables you to override the default preference you might have set in Reports & Graphs preferences.
Tip
Filtering a report is easy and convenient when you want only specific information from a longer report.
If you do filter, you might want to modify your report title so that it identifies what has been filtered. For example, if you are filtering a report to show employee advances detail, you might want to modify the report title on the Header/Footer tab to Employee Advances Detail so that anyone who reads the report will know it is pulling out specific information.
• Columns—This setting is useful for selecting the information you want to see and specifying whether you want it sorted or totaled by a specific field on the resulting report.
• Advanced button—This often-overlooked button enables users to display active, all, or nonzero rows and columns, along with the desired reporting calendar.
• Revert button—With this button, you can undo any changes made to the settings.
• Filters tab—Use these options to filter for specific accounts, names, or transaction types, as well as many other fields.
• Header/Footer tab—Use this tab to modify the report title and the appearance of the information that displays on the report. You can set this information globally for all users; see the section “Company Preferences,” earlier in this chapter.
• Fonts & Numbers tab—Use this tab to specify fonts for specific line text, as well as determine how numbers appear in your reports. You can set this information globally for all users; see the section “Company Preferences,” earlier in this chapter.
Tip
From time to time, I encounter mistake-prone clients. In such instances, I advise them on proper procedures and provide a grouping of reports for them to review prior to my appointment.
Report Groups
Users often overlook report groups, which enable you to run two or more reports in QuickBooks at once. This feature can streamline your reporting process. This section highlights how to create, use, and manage report groups.
Creating Report Groups
For accountants, this feature can save precious time each period you work with your client’s data. You can create a group of reports that you review each time you work with the client’s file.
To create a report group, follow these steps:
1. From the menu bar, select Reports, Memorized Reports, Memorized Report List. The Memorized Report List dialog box displays, showing predefined groups and associated reports.
2. Click the Memorized Report drop-down button at the bottom of the list and select New Group.
3. In the New Memorized Report Group dialog box, provide a name for the group. Click OK to return to the Memorized Report List. QuickBooks places your new group alphabetically in the existing list of report groups.
4. Click the X in the upper right to close the Memorized Report List.
Note
If you work in the file with Multiuser access enabled, select File, Switch to Single User Access before you attempt to move a group of reports on the list.
If you want to create several reports that are included as part of this report group, move this newly created report group to the top of the list. To move a report group, with your cursor, click the diamond in front of the report group name. You must be logged in to the file in single-user mode. As you memorize reports for this group, QuickBooks defaults the report group in the Memorize Report dialog box to the first report group on the list.
When you are done memorizing the reports to this report group (see the next section), you can move the group list item back alphabetically within the rest of the memorized reports or groups either by dragging the diamond as described shortly or by re-sorting the list under the Memorized Report drop-down menu.
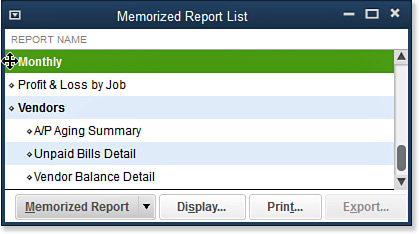
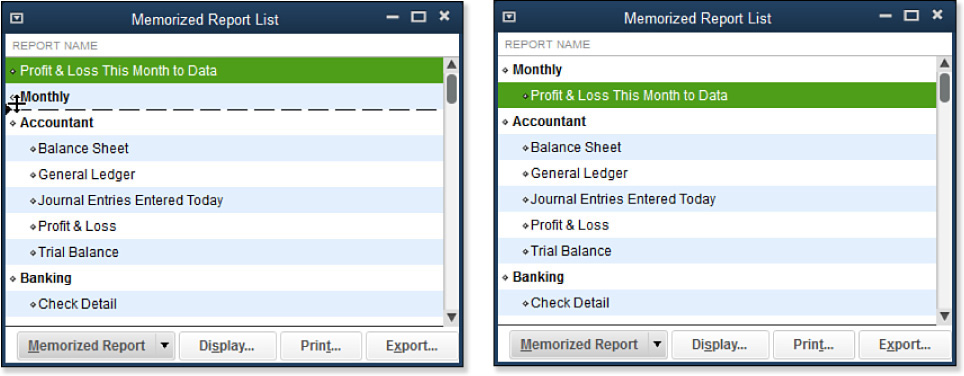
To move a report group up or down the list, place your cursor over the diamond shape in front of the report group name. Keep your left mouse depressed, and drag the item up or down. Figure 14.12 shows the new Monthly Reports group being moved to the top of the list.
Figure 14.12. Create a report group so you can easily display or print multiple reports at one time.
Using Report Groups
The primary purpose of report groups is to simplify displaying or printing multiple reports at one time.
To display a group of reports, follow these steps:
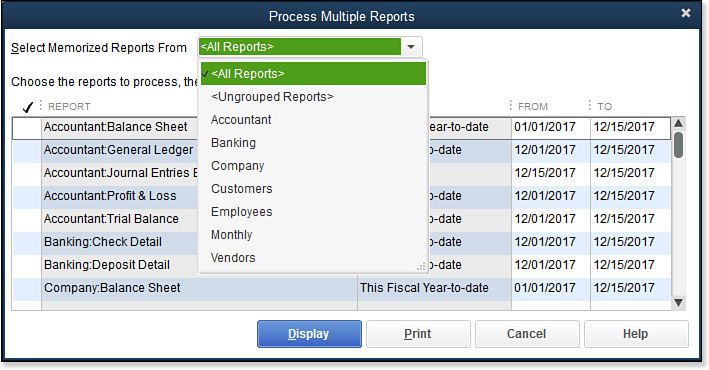
1. From the menu bar, select Reports, Process Multiple Reports. The Process Multiple Reports dialog box displays.
2. In the Select Memorized Reports From drop-down list, select the specific report group you want to create, as in Figure 14.13.
Figure 14.13. The Process Multiple Reports dialog box enables you to choose what group of reports to display or print.
3. Remove the checkmark for any report you do not want to process in the group. Figure 14.14 shows a sample of selected reports.
Figure 14.14. The Monthly report group has been selected, and the reports memorized with this group display.
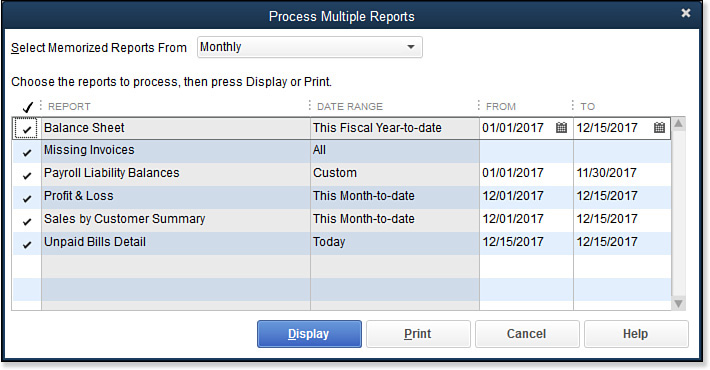
4. In the From and To columns, change the date as needed. Be aware that these changes are not permanent. The next time you create the report group, the original date range stored with the report displays. If you want the new dates to appear next time, you need to memorize the report again and click the Replace button to replace the previously stored report with the new date range.
5. Click Display to view the reports on your computer screen, or click Print to send the selected reports to your printer.
Caution
When memorizing a report that you want to add to a report group, be aware of the date range selected. If you want to generate a report for the current month-to-date, select This Month-to-Date as the default date range. When the report is generated, QuickBooks uses data from the current month-to-date.
If you select a specific range of dates on a memorized report, QuickBooks considers those dates to be a default setting and always generates the report with those specific dates.
Your report group generates the multiple reports for you to view or print. I often create a report group for my clients named either Monthly or Quarterly Reports. In this group, I put certain reports I want them to review before my appointment. This method helps clients help me in keeping their QuickBooks data reporting organized.
Managing Memorized Report List and Memorized Report Groups
To manage a report group, follow these steps:
1. From the menu bar, select Reports, Memorized Reports, Memorized Report List. The Memorized Report List dialog box displays, showing predefined groups and associated reports.
2. At the bottom of the list, click the Memorized Report button to choose the following memorized report list options:
• Edit Memorized Report—Edit the name of an existing report list item or the group it is associated with (you do not edit the date ranges or filters from this dialog box).
• New Group—Create an association of multiple reports, discussed in the previous section.
• Delete a Memorized Report—Manage the list and changes over time.
• Print the List—Create a printed list of your memorized reports.
• Re-sort the List—Return the list to its original order before making any custom changes to the organization of the list items. You won’t need this option often.
• Import or Export a Template—Create and then use reports for multiple client data files.
→ For more information, see “Exporting and Importing Report Templates,” p. xxx.
3. To rearrange your reports, place your cursor on the diamond in front of the report name, and click and drag down and to the right, as in Figure 14.15. Release the mouse button when the report is in the desired position.
Figure 14.15. Click and drag the diamond in front of any report or group to rearrange the list manually.
From the Memorized Report List, you can also export your reports to Excel without first displaying them in QuickBooks. Use these report groups to streamline your data review. You can use the Memorize feature for many of the special reports discussed in this book and place them in a report group for easy and frequent access.
Memorized Reports
After you have created a report group, you can use the report memorize feature to store customized reports for future use. Placing your memorized reports in a group is optional, but using groups helps keep your memorized reports organized.
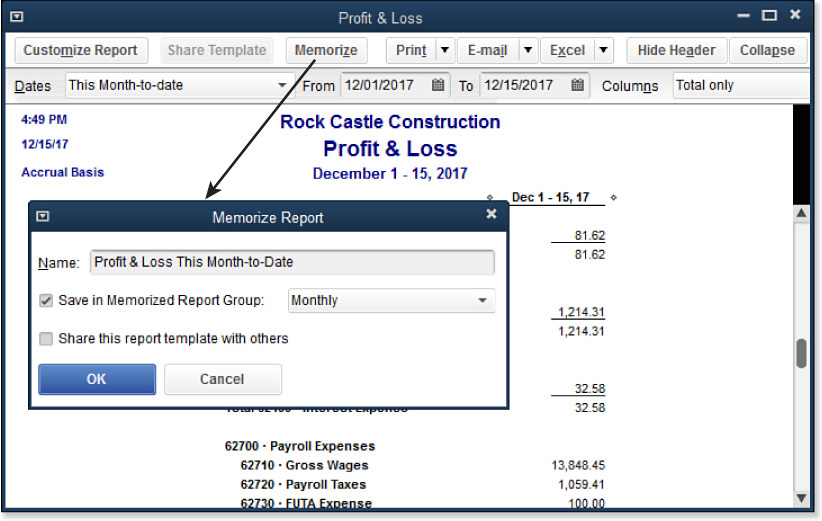
To memorize a report for use later, click the Memorize button at the top of an open report, as in Figure 14.16. QuickBooks requires you to give the report a name and, optionally, lets you assign it to a report group or share it with others (optional). (You must first create the report group so it displays in the drop-down list in the Memorize Report dialog box.)
Figure 14.16. Click Memorize on any displayed report, give the report a name, and (optionally) assign it to a report group or share the template with others.
If you choose not to assign a report group, your memorized reports are listed individually on the Memorized Report List, as shown previously in Figure 14.15.
Exporting and Importing Report Templates
QuickBooks offers the option to export and import report templates. This feature is useful for accountants who want to save time by having several clients use the same report template.
Only the format and filter settings are stored with report templates. If you create a report template and then have several clients use it, then when the client imports it, the desired report is generated with the current client’s data, not the data it was created with.
You can export and import a single report or a group of reports only from the Memorized Report List. Thus, you must first memorize any reports that you want to export.
Caution
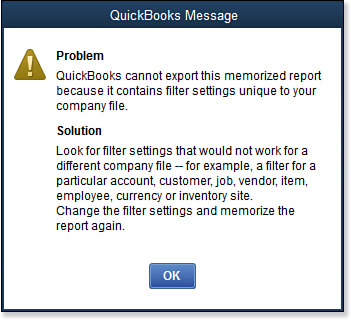
Certain restrictions exist when creating a template for export. For example, if you filter for a specific chart of account or customer name that might not be present in every customer’s file, QuickBooks provides the message in Figure 14.17, warning that this report cannot be exported.
Figure 14.17. If your report has specific filters, you might not be able to export and share it with multiple data files.
Exporting a Report or Report Group Template
To export a report or report group template, follow these steps:
1. From the menu bar, select Reports, Memorized Reports, Memorized Report List.
2. Select the report you want to export, and choose Export Template.
3. The Specify File Name dialog box displays, enabling you to select a location to store the template (.QBR extension). Click Save.
4. Attach the stored report template or report group to an email, or copy it to a removable storage device such as a USB drive to share with other QuickBooks data files.
Importing a Report or Report Group Template
To import a report or report group template, follow these steps:
1. From the menu bar, select Reports, Memorized Reports. The Memorized Reports List dialog box displays.
2. In the Memorized Reports List drop-down list, select Import Template.
3. The Specify File Name dialog box displays, enabling you to select the stored location of the .QBR template.
4. Select the appropriate .QBR report or report group template.
5. Click Open. The Memorize Report dialog box displays for you to assign a name for the report and, optionally, assign it to a group.
6. Click OK to add the report to your memorized report list.
Exporting Reports to a .CSV File or to Excel
Sometimes you want to export your reports to Excel to manipulate them in a more extensive manner than is available within QuickBooks.
Caution
I generally try to discourage exporting to Excel and do my best with a client to find the appropriate report in QuickBooks, simply because any changes you make to your report in Excel do not “flow” back into your QuickBooks data file. However, you can link exported reports so changes made in your QuickBooks data update your Excel spreadsheet.
To export a report to either .CSV or Excel format, follow these steps:
1. From any report window, click the Excel button at the top of the report.
2. Click Create New Worksheet. (If you are updating a previously exported report, select Update Existing Worksheet and follow the prompts to browse to the file location.)
3. The Send Report to Excel dialog box displays with these options:
• Create New Worksheet
• In a New Workbook
• In an Existing Workbook
• Update An Existing Worksheet
• Replace An Existing Worksheet
• Create A Comma-Separated Values (.CSV) File
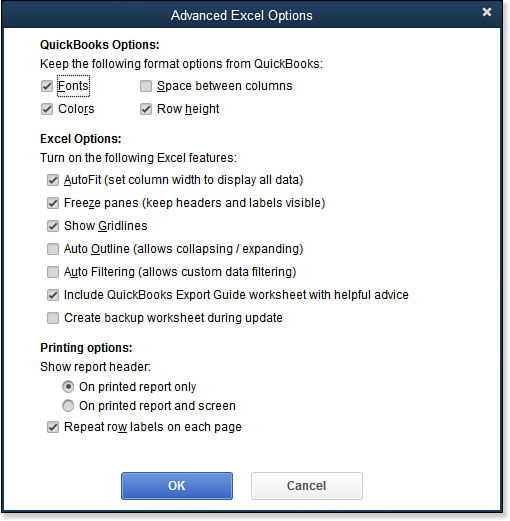
4. (Optional) Click the Advanced tab of the Export Report dialog box for options to preserve QuickBooks formatting, enabling certain Excel features and printing options. Try different configurations of these settings to see what best suits your needs. See Figure 14.18. Changes made to the Advanced tab settings affect future exported reports. Click OK.
Figure 14.18. Advanced Excel Options include automatically formatting the exported QuickBooks report.
5. Click Export to create the exported report, shown in Figure 14.19.
Figure 14.19. Easily convert any QuickBooks report or list to an Excel or .CSV format.

6. Select the QuickBooks Export Tips worksheet tab for additional useful hints in working with exported reports. The Advanced button on the Send Report to Excel dialog box includes an option to turn off creating the QuickBooks Export Tips worksheet.
Remember, however, that changes made in Excel to the exported report details are static—their information is fixed in time. Changes made to the Excel report do not transfer back into QuickBooks.
However, you can send changes in QuickBooks to your Excel report by selecting Update an Existing Worksheet. Another method for updating a saved Excel exported report is to click the QuickBooks tab in Excel’s ribbon interface and select Update Report. See Figure 14.20.
Figure 14.20. Update the saved file from the QuickBooks tab in Excel.
Emailing Reports
You can email reports from within QuickBooks. This can be a convenient way to get information to your customers, vendors, management, owners, and even the company accountant. You can email reports as two types of attachments: individual Adobe PDF files or Excel workbooks.
If you want to set Outlook as your default email, from the menu bar, select Edit, Preferences, Send Forms. Select the My Preferences tab, where you can set the default email application to be QuickBooks or Outlook. You can also choose from other email providers.
To email a report, follow these steps:
Note
If you do not use Outlook or other webmail solutions for your email, QuickBooks sends the email through QuickBooks Business Solutions, which has been available for years. Figure 14.22 shows how the email is created within QuickBooks when Outlook is not your default email program.
1. From the open report, click Email and choose either Send Report as Excel or Send Report as PDF. Figure 14.21 shows how the email appears if you are using Outlook 2010 as your default send method. In this example, Send Report as PDF is selected.
Figure 14.21. You can send reports as PDF or Excel attachments using your own email account.
2. If a security message displays, indicating that sending information over Internet email is not secure, either click OK to continue or click Cancel.
3. If you are sending the report through Outlook as in Figure 14.22, add your email address and any additional comments to the email. Click Send when you’re done. You return to your QuickBooks data file, and the email is stored in your Outlook Sent folder.
Figure 14.22. Send a report as an attachment through QuickBooks (when you don’t use Outlook).
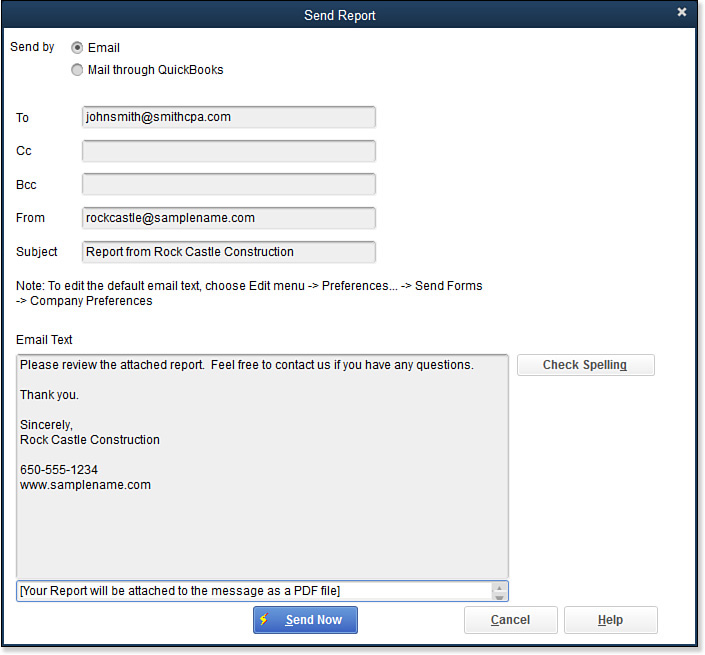
If you are not using Outlook for email, click Send Now (not shown). QuickBooks transmits the email for you though either the QuickBooks servers or your webmail, depending on how you have your Send preferences configured.
As a business owner, learning how to work with reports is valuable and helps you efficiently manage reporting in your QuickBooks file. Next, in Chapter 15, “Reviewing Your Data,” you learn about specific data reviews in your file that can help with management decisions for your company.