
Chapter 12: Debugging and Troubleshooting Mobile and Reactive Web Apps
Often, despite the OutSystems platform aiding in the reduction of errors, we get unexpected behaviors in our applications and we need to find out what is going wrong.
Applications are composed of client-side code and server-side code, and in the case of anomalous behavior or errors at runtime, we may need to troubleshoot one or both contexts.
To perform this analysis, we can analyze logs in Service Center and use the debugger in Service Studio or use browser tools.
In order to allow a solid understanding of these topics, this chapter is divided into the following sections:
- Debugging reactive web applications
- Debugging native mobile applications
- Using Service Center logs to support troubleshooting
By the end of this chapter, we should be able to analyze the behavior of our applications in real time through the debugger, as well as understanding the error logs in Service Center and how to support debugging in order to be more precise in using the debugger.
Now, to better understand how all this works, let's start with debugging reactive web applications.
Debugging reactive web applications
Debugging in our applications consists of pausing the application's execution at breakpoints that we define at specific points, allowing it to run later step by step and with data visualization in use.
But what is a breakpoint?
A breakpoint is a flag that is added to the stream we want to analyze that, when the debugger is running, stops the stream at that same point. We can see it as a traffic light that gives the order to stop.
These breakpoints can be added to any element of our flows.
To add or remove a breakpoint, we first right-click on that element in the module tree. Then, select the Add Breakpoint or Remove Breakpoint option from the context menu, as shown in Figure 12.1:
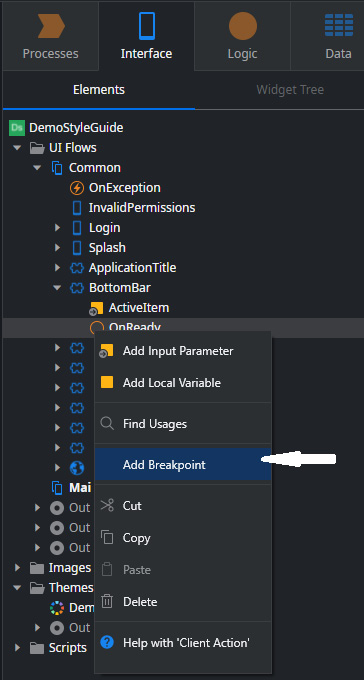
Figure 12.1 – Adding a breakpoint in the module tree
We can also add a breakpoint in the element itself; just right-click on it and select the Add Breakpoint option, as shown in Figure 12.2:
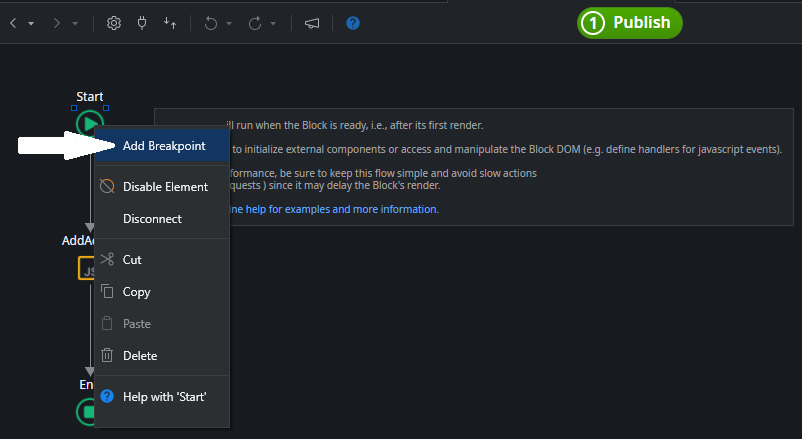
Figure 12.2 – Adding a breakpoint in the element
Or, click on the element to select it and press F8. This shortcut toggles between adding and removing a breakpoint.
The element where the breakpoint was set will show a small red circle:
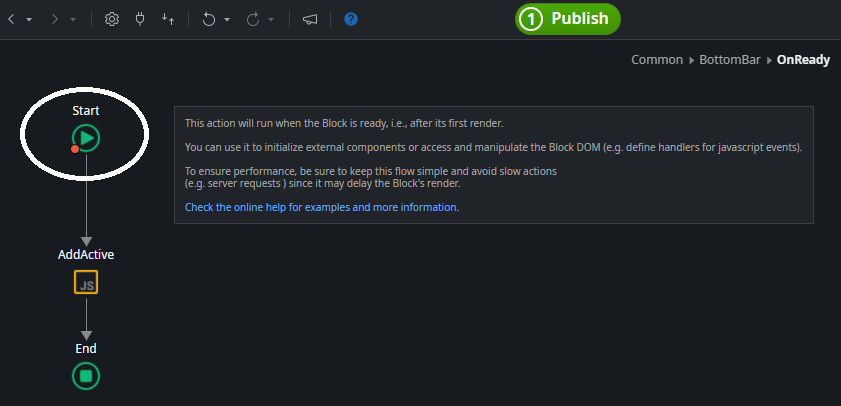
Figure 12.3 – Breakpoint red circle in the element
We can remove a breakpoint in a given element by right-clicking on it and selecting the Remove Breakpoint option, as shown in Figure 12.4:
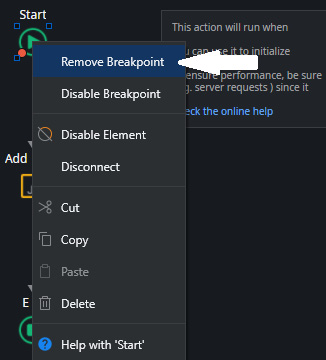
Figure 12.4 – Removing a breakpoint in the element
You can remove all breakpoints at once by selecting the Remove All Breakpoints option from the Debugger menu, as shown in Figure 12.5:
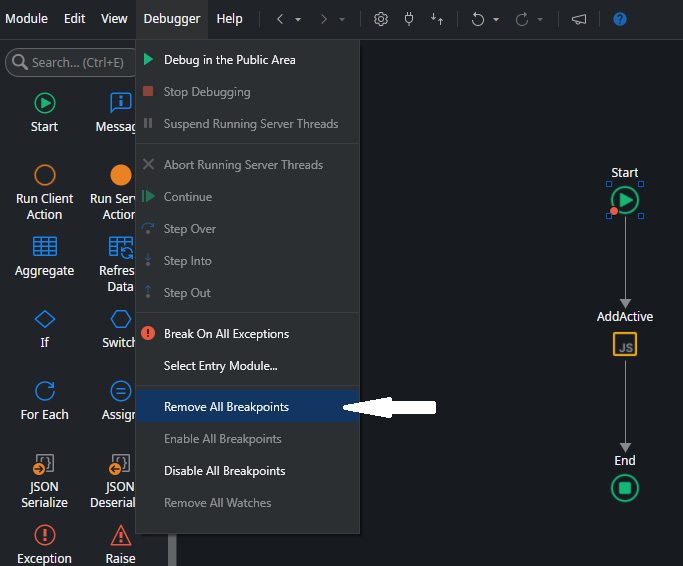
Figure 12.5 – Removing all breakpoints in the Debugger menu
More than adding or removing breakpoints, we can also disable them without removing them.
To temporarily disable a breakpoint without removing it, do the following:
- Right-click on the element (on the canvas or in the module tree) and select the Disable Breakpoint option from the context menu:
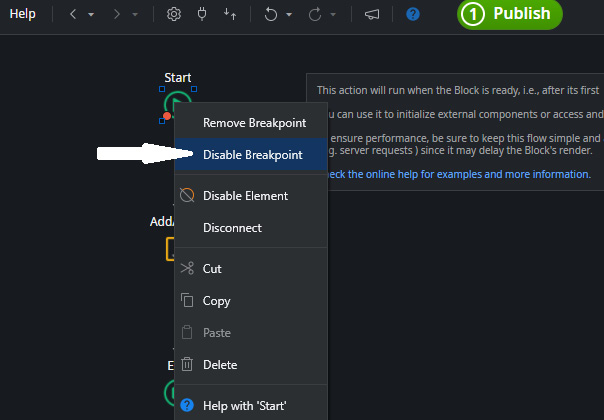
Figure 12.6 – Disabling a breakpoint in the element
- Or, click on the element to select it and press Ctrl + F8. This shortcut toggles between enabling and disabling the breakpoint.
The element where the breakpoint was disabled will show an empty red circle.
Follow the same procedure to reactivate a breakpoint, selecting the Enable Breakpoint option.
You can also disable all breakpoints at once by selecting the Disable All Breakpoints option from the Debugger menu or from the context menu displayed by right-clicking anywhere in the Breakpoints tab area:
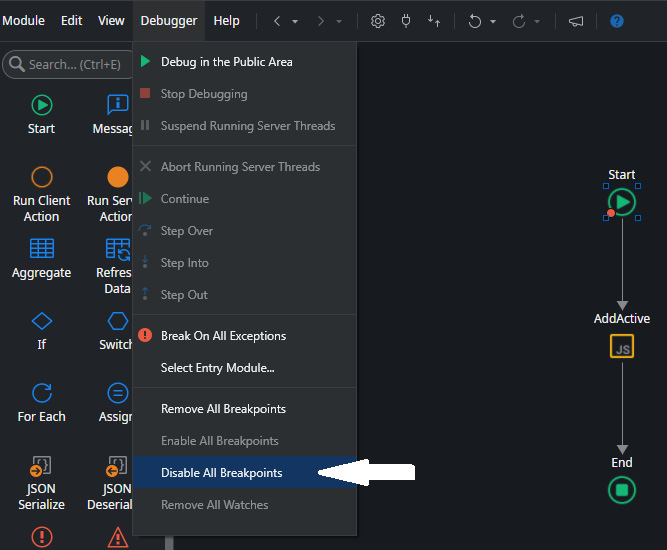
Figure 12.7 – Disable All Breakpoints in the Debugger menu
From here, we can prepare the start of our debug session.
To facilitate and enhance the tool, Service Studio provides a tab that shows us the variables and values at runtime.
In addition, it also transmits the current debug context to us, such as current thread, event name, action UI flow, and screen (the latter two when applicable. We may be debugging a Server Action, a Service Action, or a general Client Action and in this context, there is no screen or UI flow):
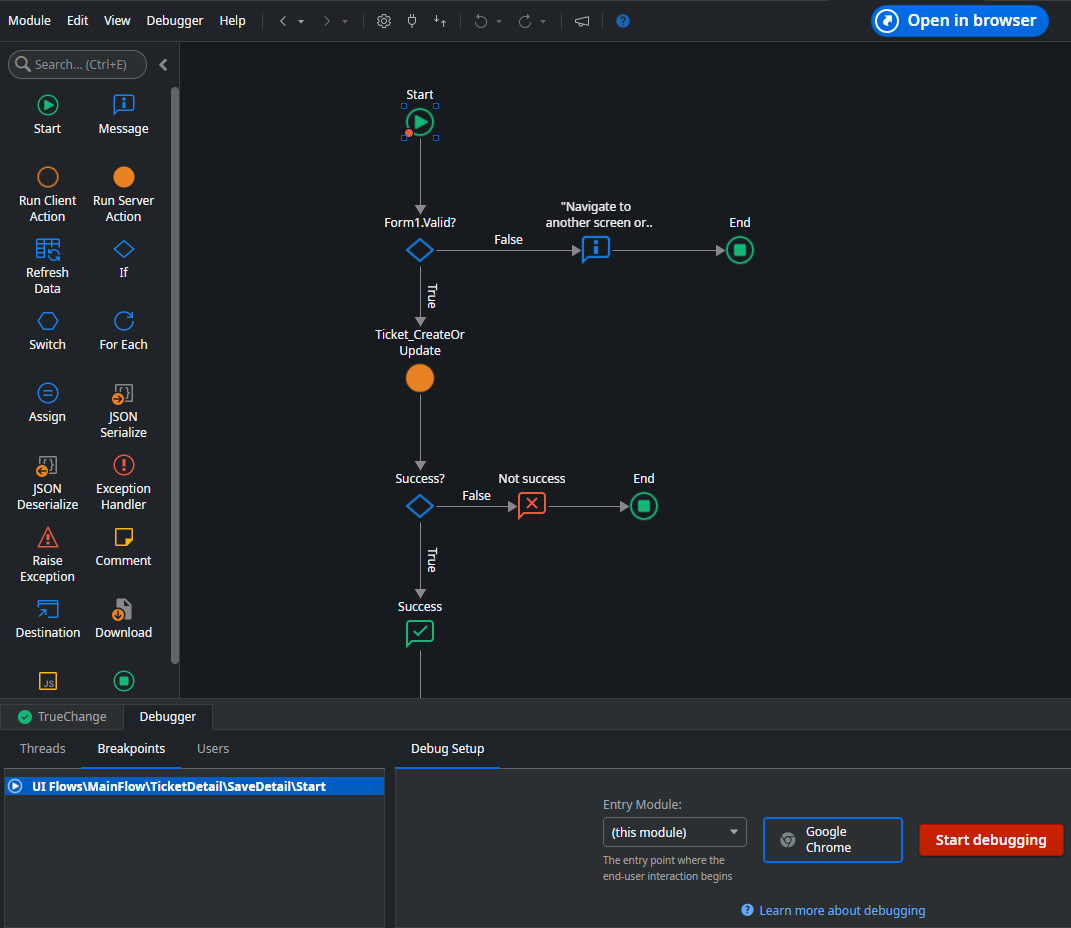
Figure 12.8 – Debug tab before starting debugging
To debug your application, click the 1-Click Publish button to save the latest changes to the module before debugging. Then, set one or more breakpoints in the module you are debugging.
Start the debugger by clicking the Start Debugging button on the Debugger tab or by selecting Debug from the public area from the Debugger menu:
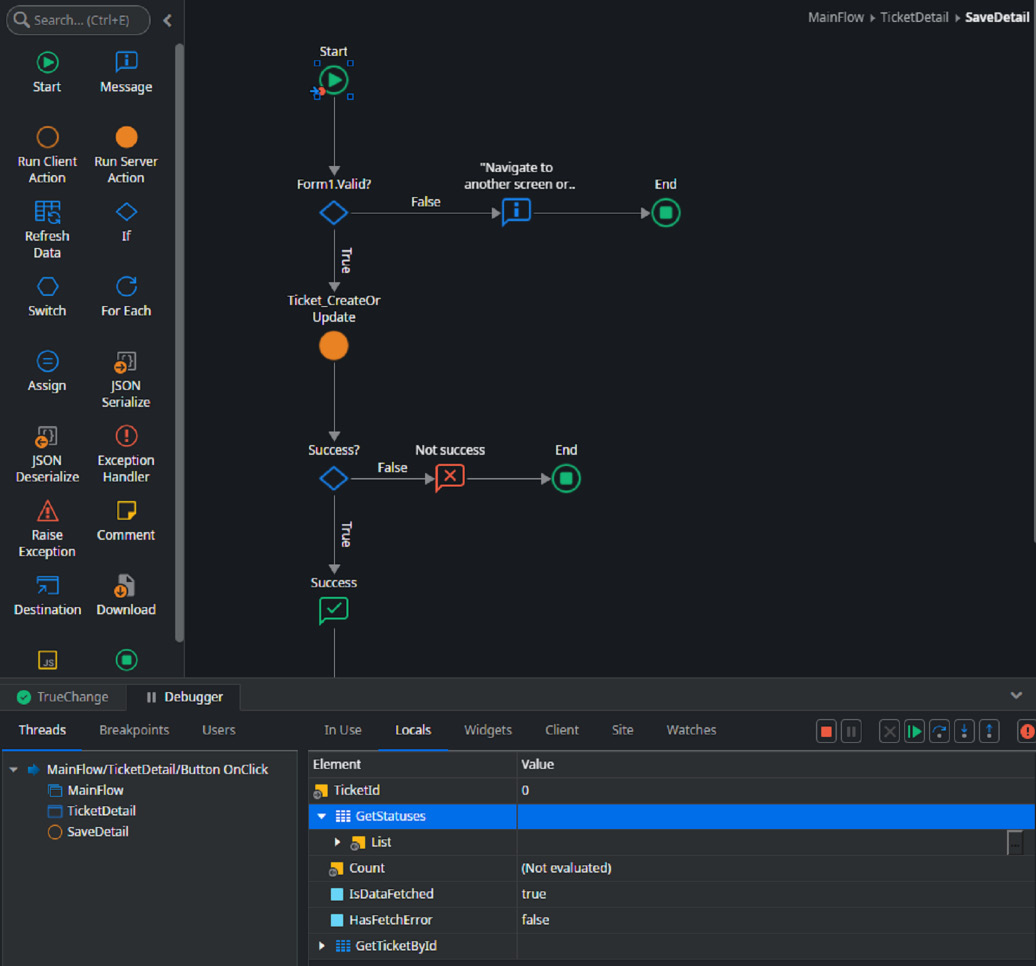
Figure 12.9 – The Debug tab during debugging
Service Studio will open a new browser window with your instance.
Access your application's functionality up to the point where the execution hits a breakpoint and is suspended.
When switching to the Service Studio window, the stream or canvas containing the element with the breakpoint is displayed on the canvas. Service Studio selects the element with the breakpoint and marks it with the debug icon.
The execution context is shown in the Threads tab of the Debugger tab, marked with the current thread icon of the current thread, showing the current execution stack of the module's elements. The Debugger tab also shows additional information that you can explore.
After analyzing the runtime values at this runtime point, you can continue running the application.
Select one of the available commands to advance the execution of the application logic:
- Continue: Resumes the execution and leaves the debugger for the current iteration
- Step Over: Goes to the next element in the same flow
- Step Into: Goes to the next element inside the current element, such as entering each assign inside an Assign node
- Step Out: Goes to the execution trace in the next element in the main level (as shown in Figure 12.10)
The execution point advances according to the executed command.
Right-click on an element on the screen (or in the module tree) and select the Continue To Here option from the context menu. Execution continues until it reaches that element on the screen.
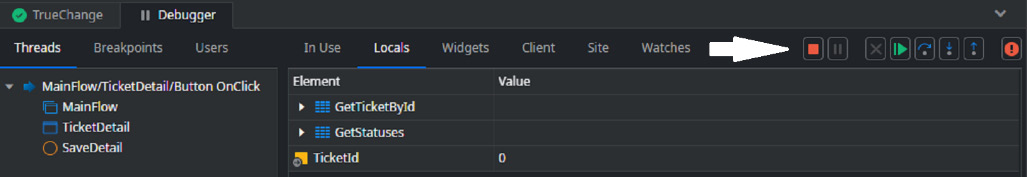
Figure 12.10 – Debugging commands in the Debug tab
In some scenarios, you need to debug some functionality exposed by another module (called a producer module). In these cases, we must select the input module for the respective Action as the final module where the user has contact with the application (frontend module):
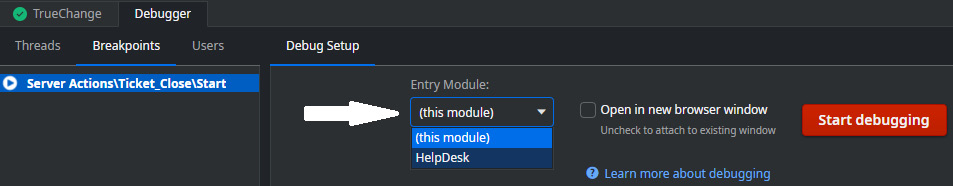
Figure 12.11 – Entry module selection in the Debug tab
This is true for consumers who run the same transactions as producers.
If the producers run in independent transactions, such as Service Actions and REST APIs, we must activate the debugger in both modules, and in the producer module, the entry module must be itself (this module).
This is because they are transactions that take place in their own context (as explained in Chapter 6, Server-Side Logic).
Tip
Also, there is another interesting scenario. Sometimes we need to debug deeper, going beyond the two layers. If the producer module is not being referenced in some way by the final consumer module, we can, through Manage Dependencies, add any reference (it will be something dummy) for the producer module in the consumer module and publish it. From there, in the dropdown for selecting the entry module in the producer module, the intended consumer module will appear.
ATTENTION: When it is no longer necessary, we must remove the dependency of the producer module on the consumer module! You can see more details about debugging producer modules here: https://success.outsystems.com/Documentation/11/Developing_an_Application/Troubleshooting_Applications/Debugging_Applications/Debugging_Producer_Modules.
Through this powerful feature, we can detect unwanted behaviors or harmful trends in our code, allowing us to visualize everything that happens in real time.
As expected (and you probably already understand), the OutSystems platform has great standardization between the reactive web and mobile paradigms, and debugging is no different.
So, how do you debug a mobile application? It's not very different and we'll see it in the next section!
Debugging native mobile applications
As we mentioned before, the debug method in the mobile paradigm is not very different from the reactive web paradigm.
Thus, and in order to simplify the transfer of knowledge, in this section, we will focus on the differences compared to what we saw in the previous section.
Basically, we can debug mobile applications in two ways:
- Emulate the mobile app using the Google Chrome browser on your PC: Use the Chrome browser on your PC to debug your mobile app if you don't need to execute native plugins, as the native plugins can't run on PC. This option is very good to test the logic of the app. However, to check the performance or experience of the mobile app, test your app on a mobile device.
NOTE: Don't forget that if your application depends on native Cordova plugins, you won't be able to test in the web context.
- Install the mobile app on a device: We can test the mobile app directly on a device as our users would run it. It's the best place to test the performance and experience of your app. You can do it on iOS or Android. Generate the native app package for your app in Service Studio using the Debug (for Android) or Development (for iOS) build type, install it on the device, and follow the next steps:
These are the steps to allow your iOS device to debug your application:
- Install iTunes on your PC (needs to be iMac).
- On your device, turn Web Inspector on.
- Connect your device through a USB cable to your PC.
- On your iOS device, allow the PC to debug.
These are the steps to allow your Android device to debug your application:
- Turn USB debugging on your Android device.
- Use a USB cable to connect your device to the PC.
- Allow the PC to debug the device.
To debug, the tab will present three different options: Emulate using Chrome, Android device, and iOS device. Just choose what you want and click on the Start debugging button:
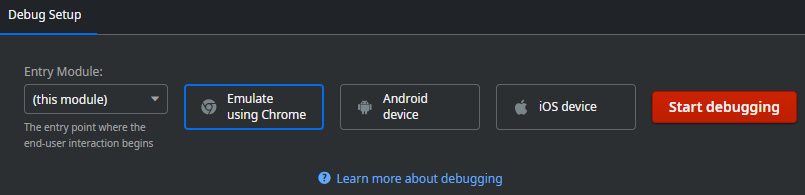
Figure 12.12 – Debug tab for mobile modules
With this knowledge, it becomes much simpler and faster to get the best behavior from our applications, improve the user experience, and fix bugs.
But how do we find the right place to debug and create our breakpoints? Is there any way to get this information in order to speed up the discovery process?
Yes, we can check the error logs in Service Center, which often gives us an indication of where we got the errors and their characteristics. We'll find out how to do this in the next section.
Using Service Center logs to support troubleshooting
We can often get errors and we don't quite know where they occur or where to start investigating.
A very interesting way to have something to start with and be more effective and quicker to find out where the errors are is through the logs generated automatically by the platform.
Remember in Chapter 7, Exceptions Handling, we talked about exception handlers? Well, it is at this point that we thank them for their existence, as if they have the option of Log Error as Yes it will allow us to obtain the error information.
Tip
These errors are caught in the debugger when the flow enters the exception handler and exits the predicted flow. By default, these errors enter the most appropriate exception handler with their context. For example, an error caused by writing to the database is caught in the exception handler dedicated to database exceptions. If it does not exist explicitly, the error is handled by all exceptions.
In order to access the error log, access Service Center via the *yourenvironment*/ServiceCenter URL and click on the Monitoring menu and then the Errors tab:
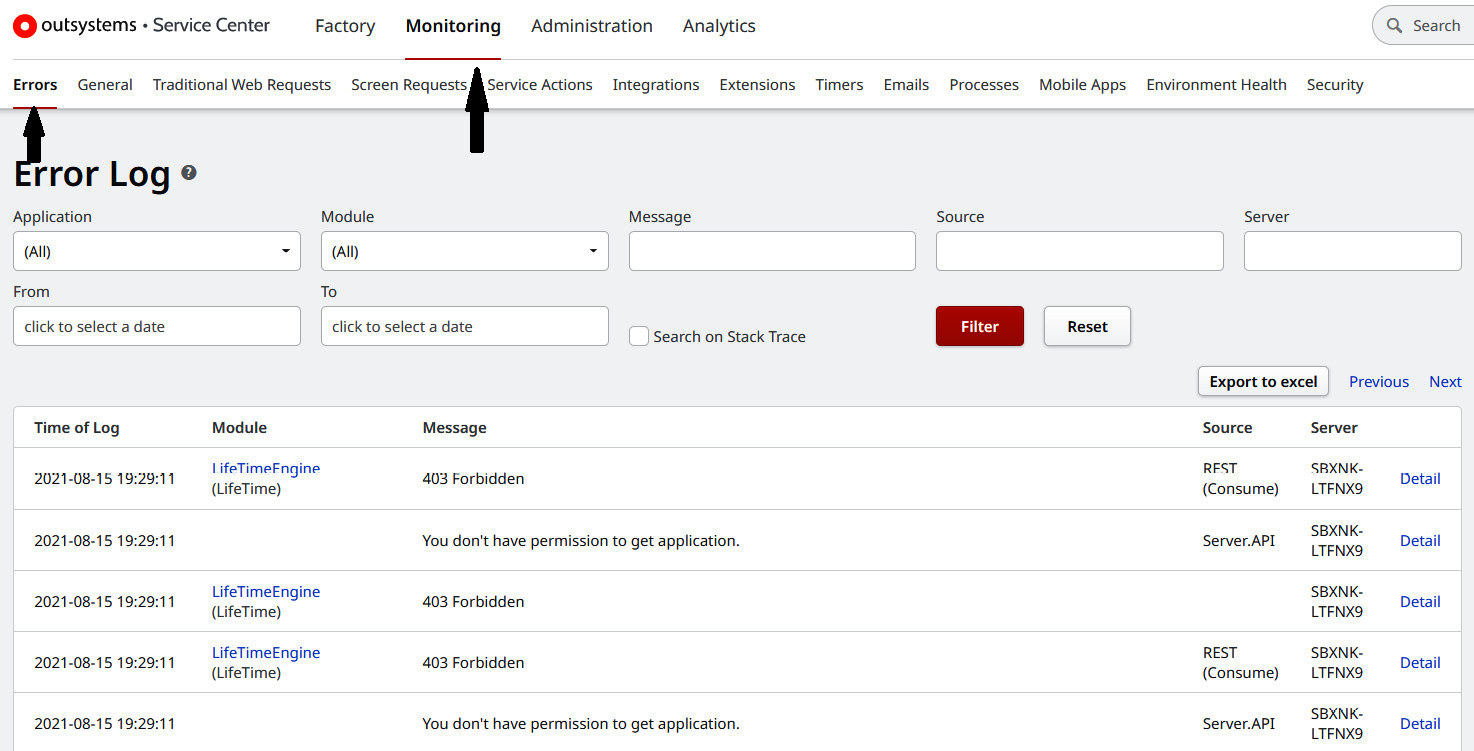
Figure 12.13 – Errors screen in Service Center
In the list of errors that is presented to us, we have already managed to obtain some context for each of the errors logged. However, if we click on the Detail link for the error we intend to inspect, we are redirected to a page with much more detail about it:
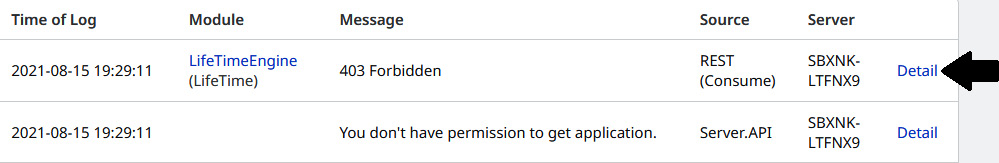
Figure 12.14 – Link to error log details
On the details page, we can get very relevant information about the error:
- Id: Log identifier
- Time of Log: Date and time of log registration (in the time zone of the database server)
- Request Key: Key used to make the log request
- Module: The name of the module that requested writing the error (that is, where the error was handled)
- Tenant: The tenant of the module that generated the error
- User: Registered user in session (if any)
- Session Id: ID of the session in effect when writing the error
- Server: Server where the error occurred
- Source: Source of the error
- Message: Message generated by the exception when the error occurred
- Environment Information: Data obtained from the environment at the time of the error
- Stack: Shows the entire code that ran at the time the error was triggered, always in hierarchical order from the highest point of the call (for example, the Action triggered on a screen) to the lowest (for example, a failed attempt to perform a update of a record in the database).
Through this data, it becomes much easier to see where the error occurred.
In fact, an useful tip is to understand well the information that appears in the Stack field, since there you can often understand or infer the path followed to the very place where the error was generated.
Also, the Message field often conveys a lot of valuable information about the problem.
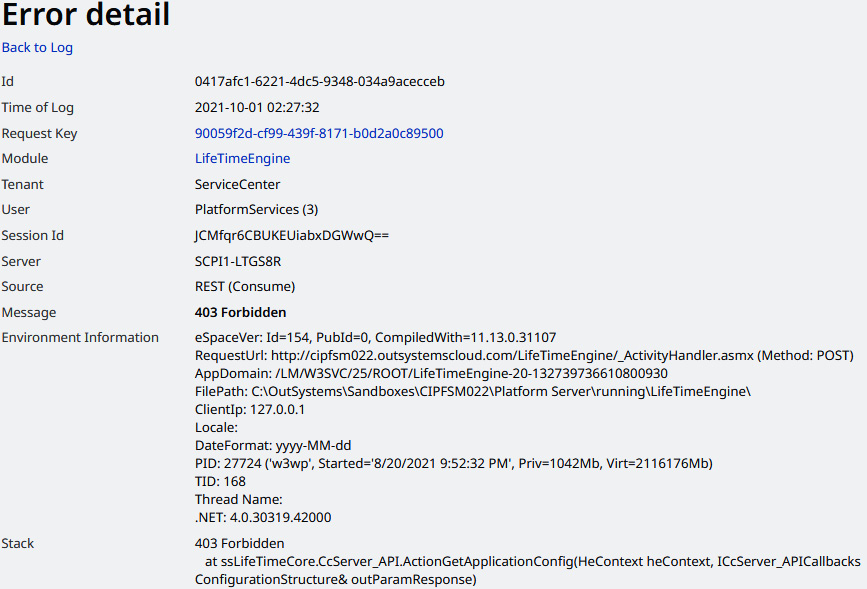
Figure 12.15 – Error log detail example
In addition to the error log, we can rely on other types of logs to inspect unwanted application behavior.
For this, we can access any of the other tabs in the Monitoring section of Service Center, namely the following:
- Errors: What we've seen so far.
- General: In this section, the logs that are created by the LogMessage action, or those of a more general character, such as slow queries, are presented.
- Screen requests: Here, logs regarding the response times to requests from reactive web and mobile applications are presented. With this, we can understand that screens or sections of our applications are taking longer to be processed, allowing us to come up with improvements.
- Service actions: This screen provides information about the execution of Service Actions, such as the time taken to run. The amount of information depends on the logging level of the module where the respective Service Action exists.
- Integrations: Here, we can see information regarding the runtimes and payloads of our integrations, such as SAP, REST, or SOAP integrations.
- Extensions: In this section, all extension actions that run during a request, the caller module, and how long the extension action took to reply are presented.
- Timers: This screen shows information regarding the execution of the existing timers in our applications. Here we can see when they ran, when they were planned to run, how long it took them to run, and when they are expected to run again.
- Emails: In this section, we can see the emails that were sent, their status (successful, error, or pending), and, if they are configured to log content, we can also access the email itself.
- Processes: This screen displays the number of currently active, suspended, and closed instances for each business process. It also shows the number of instances with errors.
- Mobile Apps: This screen displays the list of mobile app packages requested per application, including the native platform for which the package was generated and the status.
Tip
You can see more details about the module logging level here: https://success.outsystems.com/Documentation/11/Developing_an_Application/Troubleshooting_Applications/Troubleshoot_Service_Actions_Using_Logs#how-to-change-the-logging-detail-level-for-service-action.
As we can see, Service Center provides a lot of information that allows us to be more effective and accurate when it comes to correcting errors and anomalous behavior of our applications. With this, we were able to save a lot of time when choosing the correct place to add breakpoints for debugging, and it is often even possible to correct the error without having to resort to this tool (if the log is very specific and we have a lot of context about the code where the failure occurs).
Furthermore, we can use the LogMessage System Action (just add it as a dependency in the Manage Dependencies window) and place it wherever we want in our flow (we can also place it in the exception handling flow) and customize the message that we want to appear, as well as textually defining the module where it occurs.
Summary
In this chapter, we saw that the OutSystems platform provides us with a very powerful feature to handle errors and unwanted behavior in our applications: the debugger. We learned how to use it and got to know its artifacts.
In addition, we learned about its context in reactive web applications and what the small differences in mobile are.
Finally, we realized how we can rely on existing logs in Service Center to better interpret and understand the errors and behaviors of applications in order to be more effective and faster when debugging.
The development of applications may not be, many times, a paradise, but with this knowledge, our work is much easier and going through difficult times is more comfortable.
At this point, we can already look ahead and think about how we can take all this knowledge further and try to figure out how we can extend our platform and how we can design our application architectures to make the most of what we've learned.
Well, we'll cover that in the next chapter, where we'll talk about how to design a well-performing, secure, and scalable architecture for our applications.
Let's talk about the importance of good architecture, in the Architecture Canvas (3 Layer Canvas), the design process, and the types of elements that exist in each of the types of modules. For this, we will rely on information already mentioned in Chapter 4, Using Your Modules to Simplify and Encapsulate Your Code, since the following chapter (Chapter 13, Designing the Architecture of Your OutSystems Applications) is a complement to it.
You're certainly excited, so let's turn the page to the next chapter!