
Chapter 2: Components, Tools, and Capabilities
The OutSystems platform provides a wide range of tools and components so that we can develop, manage, and monitor our applications in a simple and effective way.
In this chapter, we will learn how we can use the platform's development tools to create our applications, and we will utilize the code integrity verification system, which only allows us to publish our code if it is solid. Furthermore, we will learn how these tools are prepared and optimized to speed up our work by using many pre-existing components. In the case of Service Studio, we'll see how OutSystems' visual code development paradigm makes it easier for us to focus on what's important: the business!
We'll also see how the monitoring and configuration tools help us keep the platform healthy and how we can use them to fix our bugs, discover negative application behavior trends, and improve our applications!
This may seem like a lot, but believe me – with OutSystems, everything becomes simpler.
This chapter will cover the following topics:
- Service Studio walkthrough
- Service Center capabilities
- Managing your infrastructure with LifeTime
- Managing end users with the Users application
- Integration Studio walkthrough
Service Studio walkthrough
In order to simplify application development, OutSystems created a highly capable, simple, and intuitive Integrated Development Environment (IDE), giving it the name Service Studio.
Service Studio is the main tool we use to perform the following:
- Create applications and modules.
- Create user interfaces (UIs) for our web and mobile applications.
- Define the data model.
- Define business processes and Timers (asynchronous processes).
- Debug our applications (both server-side and client-side).
When we open Service Studio, we must connect to an OutSystems environment (cloud or on-premises) by providing a server URL (or selecting an existing one from the Environment dropdown) and our developer credentials.
The following screenshot shows the OutSystems Service Studio Switch Environment connection popup:

Figure 2.1 – The Service Studio connection popup
After successfully connecting, we will see an overview of the environment we are connected to. Here, we will be able to observe all of the existing applications for which we have permissions (the subject of user permissions for applications will be covered later in this chapter, in the Managing your infrastructure with LifeTime section). In the Environment tab, we can see options to carry out the following actions:
- Create a new application.
- Install OutSystems Forge applications and components.
- View and access existing applications.
The following screenshot shows the OutSystems Service Studio Environment overview:

Figure 2.2 – Service Studio Environment overview
We can use the search input field in the Environment overview to search for our applications. If we want to open a specific module from an environment, we can use the keyboard shortcut Ctrl + O:

Figure 2.3 – The Service Studio Open from Environment popup
In addition, we can install Forge applications and components (predesigned by community members or by OutSystems itself) to leverage our developments. We can do that by selecting the Forge tab, next to the OutSystems tab as shown in Figure 2.2.
In the Environment overview, we can also click the New Application link to create new applications.
After creating a new application or accessing an existing one, navigate to the app's details screen:
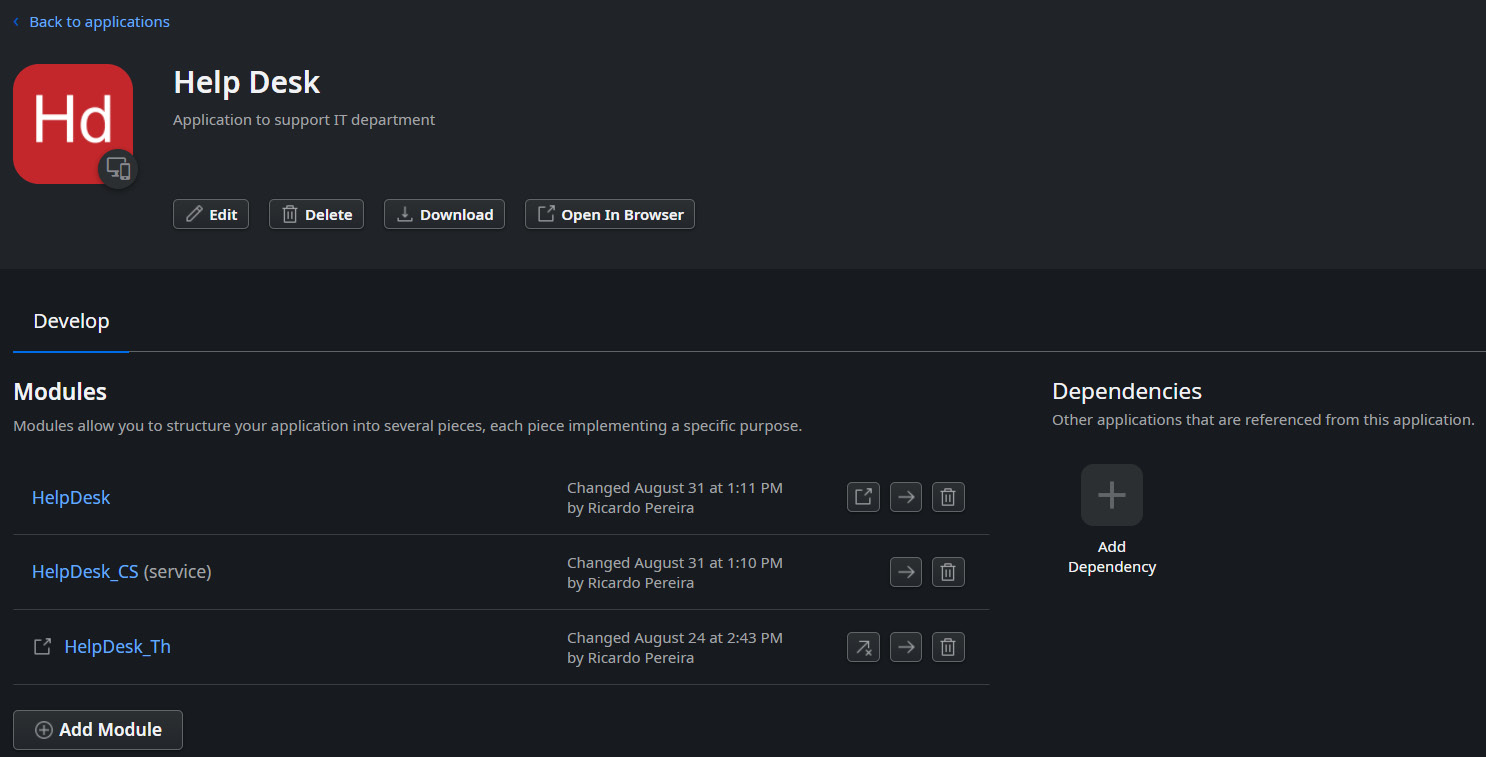
Figure 2.4 – Service Studio application details screen
On the application details screen, you have the following areas as shown in the preceding screenshot:
- App details:
- The Edit button: Click to edit your app's name, description, icon, and main color.
- The Delete button: Click to delete the app from your environment.
- The Download button: Click to download your application as an OutSystems Application Pack (.oap file).
- The Open In Browser button: Click to open your app in a browser (only if the application has a frontend module defined as the application's default module).
- Application tabs:
- The Develop tab: This is where you manage your application modules. You can also see the application's dependencies (that is, other applications or components used by your application).
- The Distribute tab: In this area, you can generate your mobile app for iOS or Android. This is also where you can enable Progressive Web App (PWA)distribution for your application. This tab is only available for mobile apps.
By clicking on one of the modules or creating a new one, we enter its workspace, which is the place where we develop, publish, and debug our code:

Figure 2.5 – Service Studio module development workspace
The areas of the workspace are as follows (as shown in Figure 2.5):
- 1- Main editor: This is the canvas where we can build our visual code.
- 2- Toolbar: This is a set of useful shortcuts for tool operations, such as opening Service Center, opening Manage Dependencies, merging, undoing and redoing, and changing to the previous or following canvas.
- 3- Toolbox: This contains all of the existing widgets and patterns to develop the logic and Screens/Blocks of our modules.
- 4- Development tabs: Here, we have access to the TrueChange tab (where we can see and inspect our module's errors and warnings), the Debugger tab (where we can start and control the debugging of our module, and whenever it is running, inspect the values that pass through all of the debug scope variables), the 1-Click Publish tab (where we can view all occurrences of the publication), and a tab with results of performed searches (where we can view all elements found by a search).
- 5- Application layer tabs: These tabs define the total scope of our module, and are composed of processes, the UI, logic, and data.
- 6- Properties editor: In this section, we can parameterize and edit a selected element from any of the application layer tabs. Each type of element has its own property characteristics.
- 7- 1-Click Publish button: This button is only available if there are no errors in our module. When it is available, it triggers the publishing of our module. In modules with a UI, at the end of the publishing process (if the version of the module that we have open does not differ from the one on the server) the button is replaced by a blue Open in Browser button that opens the application in the browser.
As we have seen in Figure 2.5, Service Studio provides four tabs: Data, Logic, Interface, and Processes.
So, let's get to know each of them in more detail!
The Data tab
The Data tab is where everything related to Database Entities, data structures, and variables that support our applications is located, such as Site Properties, Client Variables, and necessary Resources (such as Excel files for bootstrapping, for example).
Entities and Entity Diagrams
In the Data tab, Data Entities can be defined. These are representations of real database tables, containing all attributes and their respective parameters (data type, size, and requirement), indexes, delete rules, and settings regarding presentation. In the Data section, the Create, Retrieve, Update, and Delete (CRUD) operations that can be carried out on the respective Entities are shown. These operations can be visible in the module itself and in the consumer modules, and we can restrict their use in these modules by defining the Entity as Expose Read Only. If we set it to yes, the only operation available to consumers is Get. To make the other operations available, we must encapsulate them in Server Actions or Service Actions (which are called wrappers), instead of just using the original operations.
In the case of a Dynamic Entity, the operations are as follows:
- Get<Entity name>
- GetForUpdate<Entity name>
- Create<Entity name>
- CreateOrUpdate<Entity name>
- Update<Entity name>
- Delete<Entity name>
In the case of a Static Entity, the operation is as follows:
- Get
But what are Static and Dynamic Entities? Let's remind ourselves.
A Dynamic Entity is a representation of a table in a database on which we can perform the different CRUD operations in real time.
A Static Entity only allows the definition of records in the development environment, and we can only search for the values inserted in them in real time. The purpose of these tables is very similar to the purpose of the well-known enum (the behavior of enumerable, static lists of values that support other pivot data).
In order to facilitate the organization of Entities, we can create folders according to existing concepts and distribute the Entities in them.
During the data model construction process, we can create a data model diagram (or diagrams) and, if necessary, export it.
Structures
In the Data tab, we can also define data Structures. These Structures are representations to be used in memory and allow data organization according to the intended scenarios (performing Actions, for example). Furthermore, these same Structures are used to avoid exposing the data model to consumers of Actions and backend modules (we'll see what Actions are later in this chapter).
In order to facilitate the organization of Structures, we can create folders according to existing concepts and distribute Structures in them.
Client Variables
Client Variables allow you to store data of basic types on the client side (browser), both in web and mobile applications. By default, these variables are used for caching purposes, configurations, and application support (for example, to save a certain value of a filter so that, when we return to the same page, the filter remains). The amount of data that can be saved in these variables always depends on the browser.
These variables have the particularity of being shared between several applications in the same environment (with behavior similar to session variables in some characteristics) as long as the following is true:
- The user provider is the same.
- The applications are running in the same browser.
Whenever a user exits the application or when the application automatically closes, the values are reset to their defaults the next time the user logs on.
It is important to note that since these variables are available on the browser side, sensitive data should not be stored in them.
Site Properties
Another type of object that can be defined in the Data tab is the Site Properties object. Site Properties are supporting variables stored on the server. They are global variables with values that rarely change.
As a rule, it is not advisable to change the value of these variables at runtime, as doing so causes the cache to be invalidated, leading to a drop in performance. The most common practice is to change its value through Service Center, and usually, these values only change between environments (for example, Development/Quality/Production environments).
We must always bear in mind that Site Properties affect all users of the application in which they exist.
Multilingual Locales
The OutSystems platform allows us to add extra languages in which the application can be presented to the client. To do this, just add the desired languages in the Multilingual Locales section in the Data tab. After adding the desired languages, we can define which values we want to translate. We can insert the translations directly in the Service Studio Multilanguage Editor or export all the desired values for translation, importing the translations already made later.
The existence of this functionality depends on the platform version and can come in either a technical preview or the final version (for both reactive web and mobile applications).
Resources
In the Resources section, we locate all the necessary Resources to support a given application. For example, whenever we use Microsoft Excel files to bootstrap data for Entities, the files are saved there, and new ones can be updated or added as needed.
By default, in the modules used for the frontend development, one of the Resources available in this section is the favicon (the icon used in the browser tab to identify our application).
Note that CSS and JavaScript Resources are saved in their own sections (we'll see this in detail later in this chapter).
The following screenshot shows the OutSystems Service Studio Data tab:

Figure 2.6 – The Service Studio Data tab
We must always bear in mind that all the elements present in this tab allow us to preserve the information and data necessary for the correct functioning of our applications.
The Logic tab
The Logic tab is where business rules, data manipulation code, engines, and wrappers are defined.
This is where we make our applications work – it's where we put the necessary actions to fulfill an application's requested features.
For this purpose, OutSystems offers six types of elements:
- Client Actions
- Server Actions
- Service Actions
- Integrations
- Roles
- Exceptions
Let's look at these each in detail now.
Client Actions
Client Actions are logic encapsulations that run on the client side (browser). They can be called by other Client Actions, but never by Server Actions. However, Client Actions can call Server Actions. Note that as a matter of good practice, you should only call one Server Action at most. Why? Each Server Action that is called is a REST (Representational State Transfer) method that is invoked. Note that a Server Action is not a REST API; rather, it is encapsulated in a REST call to the server (that is, if we have two Server Actions to be called in a Client Action, we open two connections to the server using REST). In order to bridge this scenario, it is good practice to encapsulate the Server Actions needed in one Server Action and call this one alone.
Client Actions can have input, local, and output parameters of various types. Furthermore, they can be defined as a function (so they can be used as an argument of a decision logical elements, such as Ifs or switches or by other Client Actions). To be defined as functions, Client Actions must have one and only one output variable. Client Actions can also be defined as public to be consumed by other modules.
Note that these Actions cannot be exposed in the following scenarios:
- An Action has a parameter that is defined through an Entity/Structure that is not exposed.
- An Action has a parameter that is defined from an Entity/Structure that is reused in another module.
Server Actions
Server Actions are simply abstractions and encapsulations of our code. They are similar to functions in other languages such as C# and Java.
Server Actions can have input, local, and output variables. If we want them to be used as functions (so they can be used as an argument of a decision element or other Server Action) they have to present only one output variable. As a rule, when you want to return more than one attribute in a function, Structures are defined in the Data tab with their attributes. The attributes of the Structures are defined according to the needs of the Actions. In this way, you can define input variables, output variables, and local variables with their (the variables) types being matched with the Structures that we create in the Data tab.
Service Actions
Service Actions are abstractions of logic that run in a more coupled fashion. They run as separate transactions from the context in which they are called. As they are considered a weak reference, after 1-Click-Publish they are immediately available to all consumers. Note that this type of Action is only available in Service-type modules.
Integrations
In this same tab, we can perform Web Services implementations, Simple Object Access Protocol (SOAP) and REST, consuming or exposing SOAP web services and REST APIs. With OutSystems, the development of methods and configurations and the parameterization of our REST and SOAP services takes only a few minutes.
When consuming REST and SOAP methods, the OutSystems platform can automatically infer and build all the Structures and parameters necessary for the correct functioning of the methods using Web Services Description Language (WSDL) in the case of SOAP services, or Swagger (a specification for a format describing REST APIs) in the case of REST services.
The platform automatically generates documentation for the exposed SOAP and REST services. This is very useful for developers, who are able to integrate the exposed services and thus save time.
In addition, OutSystems allows the connection to SAP services in a simple and fast way not identical to but as effective as REST and SOAP, inferring SAP Structures and methods (BAPIs) without knowing SAP technology.
Roles
Another out-of-the-box component provided by the platform in the Logic tab is the ability to create permission roles for authorization. In this component, we can create roles according to business needs, and Check, Grant, and Revoke Actions are automatically made available for us to use in our server-side code.
Exceptions
At the bottom of the Logic tab menu, we have the Exceptions folder. Exceptions are used to handle errors or behaviors deviating from the expected flow, taking advantage of native OutSystems error-logging features.
With this feature, it becomes simpler to handle and scale behavior deviations in our application, thus allowing for better control over our code and more efficient tracking of the application flow.
The following screenshot shows the OutSystems Service Studio Logic tab:

Figure 2.7 – The Service Studio Logic tab
The content of this tab is essential for the correct functioning of our applications. That is because all data manipulations and information to be saved in the databases in the Data tab will be done by the elements in the Logic tab. This is where most of the business rules and features of our applications must be implemented because, even if the frontend layer is poorly designed, the logic artifacts are where we validate and process what goes to the Data Entities. In other words, the Logic tab's elements are the gatekeepers of robust and well-formed data.
The Interface tab
The Interface tab is where we will develop our application's UI as Screens or Blocks and all the elements they comprise. To do this, we can build two types of visualization components:
- Screens: Screens are the pages to be rendered by the browser as the final elements of an application interface.
- Blocks: Blocks are reusable abstractions of interface parts and have a life cycle of their own. For example, we could use a Block for a section that we want to show on one screen that can appear on multiple screens, or for a business concept where we want to hide the complexity from the consumer application side.
To define these components in an organized way, Service Studio includes the concept of UI Flows. A Flow is the layer where we associate the related Screens and Blocks.
So, the Interface tab provides the following folders:
- UI Flows
- Images
- Themes
- Scripts
Note that this tab does not exist in Service-type modules.
UI Flows
A UI Flow is made up of a group of Screens and/or Blocks. As a rule, they are organized by their business concept and/or functionality.
When we create a new module, it automatically generates three UI Flows:
- Common: This UI Flow contains Blocks, Screens, and Exception Handlers in our module that are reusable and not business related, such as a menu Block, or login and user info Screens.
- Layouts: This is where the layout Blocks for use in our Screens are defined. If we create a custom layout, we can add it to this UI Flow.
- MainFlow: This is the default UI Flow with which to start creating Screens for our application. However, it can change its designation and we can always create more UI Flows as needed.
Images
The Images folder is where we save and insert the images we need to use in our application. It works as a repository, and we can add and delete images, save a copy on our machine, and even change an image for another. We should always pay attention to the size of the images (in bytes) due to the performance impact that their rendering can have on our application.
These elements are cacheable by browsers, and the OutSystems platform automatically resolves this issue, since it is a built-in component.
Themes
The Themes folder is where the CSS files that define the look and feel of our applications will be available. CSS files can be edited in Service Studio's Style Sheet Editor, giving us all the potential of the CSS language. However, it is advisable for someone with at least basic CSS knowledge to edit CSS files, as poor editing can have negative impacts on the visual behavior of the application. By default, this CSS file is based on the OutSystems UI, which is a predefined library (with code and classes already made) provided by OutSystems with ready-to-use UX/UI patterns and layouts that follow CSS best practices.
Scripts
The Scripts folder is the place to store our JavaScript files!
In this section, we can save our scripts. These scripts can then be used in our Screens or Blocks as required, simply by calling them in the Required Scripts attribute. By doing this, we enable the browser to cache the script, simplifying its use and centralizing the availability of the code across the entire application.
When creating a frontend module natively, a JavaScript file is automatically generated to cover performing all the features provided by the OutSystems platform.
The following screenshot shows the OutSystems Service Studio Interface tab:

Figure 2.8 – The Service Studio Interface tab
The Interface tab is where we will concentrate on the best way to present information, data, and functionality to end users. This is where the put yourself in the user's shoes premise comes to the fore. Developing Screens and Blocks can be easy, but the secret is to realize when we should design a Screen and when we should take the Block approach.
The Processes tab
The Processes tab is where we set up our asynchronous processes. Here, we can define Timers (batch processes) to run certain predefined business logic (Actions) from the Logic tab and send bulk emails, as well as define business process flows (using Business Process Technology (BPT), which we will discuss in detail in a later chapter).
In this tab, there are two folders.
Processes
Processes are business flows defined by various elements, which could be human activities, automatic activities, waiting points, sub-processes, or decisions. This feature allows us to obtain greater simplicity in the construction and maintenance of our application flows, in addition to isolating their complexity from the rest of the application code.
Timers
Timers are batch jobs in OutSystems. We can define a Timer's periodicity, priority, and timeout. With Timers, we can handle data more efficiently, as we can use them to free up processing time in the frontend of our applications. Instead of running the logic directly in the frontend streams, we can associate it with the logic that runs in a Timer and wake that same Timer, passing the logic of that Timer to run asynchronously on the server.
These features allow better optimization of the behavior of our applications, as they prevent unnecessary processing at runtime and allow us to schedule processing for periods of less server usage.
The following screenshot shows the OutSystems Service Studio Processes tab:

Figure 2.9 – The Service Studio Processes tab
So far we've looked at the four Service Studio tabs, which cover the various layers of our application development.
Additionally, Service Center allows detailed visibility of asynchronous processes, since the platform provides an out-of-the-box intelligent logging system that allows the programmer to view different facets of the asynchronous processes. We will discuss this in more detail in the next section.
Service Center capabilities
Service Center is a management console dedicated to a given OutSystems environment.
In this section, we will see that Service Center is a very powerful tool that allows us to manage settings in OutSystems environments, monitor all events logged by the native logging system (and customized logging systems as well) in a very intuitive way, monitor the state of the infrastructure components that make up the environment, and perform analysis on and export analytical data.
In Service Center, the following features are available:
- Factory: This allows us to have an overview of all existing Applications, Modules, Extensions, and Solutions in the environment.
- Monitoring: This allows us to access the various logs registered on the platform, both for events and errors.
- Administration: This allows us to make various configurations for the environment and manage external connections.
- Analytics: This allows us to visualize the analytical data of the platform's behavior and export it for external analysis and treatment.
The Factory tab
The Factory tab has four further tabs within it:
- Applications: In this tab, we can see all the existing applications in the environment and, by clicking on them, we can access their details, such as the modules that are related to them, their dependencies, possible operations, and security settings.
- Modules: In this tab, we can view and access all existing modules in the environment that are the component parts of the applications. By accessing their details, we can view their versions (the OutSystems platform has the ability to version our modules automatically, allowing access to previous versions), their dependencies, and their status, single sign-on definitions, deploy solutions which modules are part of, , its integrations, its tenants, its Site Properties (allowing us to configure its effective value if we want to override the default value), existing Timers (also allowing its configuration), and operations.
- Extensions: In this tab, we can view all existing extensions in the environment and access their details. In the detail of each extension, we can see its versions, what modules are getting integrated, which solutions refer to it, which Actions, Entities, and Structures it provides, the Resources (files) it uses, and, in the Operation subtab, there is an option to activate activity logging.
- Solutions: In this tab, we can view all existing solutions and the details of each solution. By accessing its details, we can view its existing versions, as well as the constituent modules of the solution and the status of its last publication. In addition, on the Solutions listing screen, there is a link to create a new solution, where we can add the desired modules and either download or publish solutions.
The following screenshot shows the OutSystems Service Center Factory and Applications tabs:

Figure 2.10 – The OutSystems Service Center Factory and Applications tabs
Service Center greatly facilitates the finding, accessing, and configuring of modules and applications that exist in our environment. The filtering capability and the way links appear in associations between elements allow faster and more accurate access to the information we need than normally found in the industry.
The Monitoring tab
In the Monitoring tab, we can view events and errors that occurred during the operation of our applications. In addition to the prebuilt logs, we can define our own custom logs and errors, which are also shown on this tab.
The Monitoring area is divided into the following subtabs:
- Errors: This shows all the errors logged by the platform regarding the applications and the platform's core services.
- General: This shows general logs related to the normal functioning defined for the applications and the platform's core services.
- Traditional Web Requests: This shows requests made by frontend applications in the traditional paradigm. The traditional paradigm is the predecessor of the reactive paradigm, having in its genesis the native .NET ASPX technology. This paradigm is gradually being discontinued as it is no longer considered to be a cutting-edge technology.
- Screen Requests: This shows requests made in the functionalities available on the reactive web and mobile application screens.
- Service Actions: This shows Service Action call logs (REST web services abstractions).
- Integrations: This shows logs of requests to consumed and exposed web services.
- Extensions: This shows logs related to calls to existing extensions in the environment.
- Timers: This shows logs related to Timers executed by servers.
- Emails: This shows email logs triggered by our applications. If the Log Content property is set to Yes in the Action flow in which it is called, the email sent is available for download.
- Processes: This shows logs related to existing BPT processes in the environment. The flow and status of each BPT can be analyzed in this section.
- Mobile Apps: This shows logs related to the generation of mobile packages for our mobile applications.
- Environment Health: This is a dashboard with general information on the different areas covered by Service Center, in addition to the general status of each component.
- Security: This shows the logging of blocked addresses and environment security log topics.
The following screenshot shows the OutSystems Service Center Monitoring and Environment Health tabs:

Figure 2.11 – The OutSystems Service Center Monitoring and Environment Health tabs
Whatever metrics we are looking for, we can find everything quickly and fairly comprehensively here. If there is a problem or anomaly, it's easily identifiable thanks to the user-friendly data presentation style (not that it's common for there to be many problems, but the Monitoring tab is always accurate!).
The Administration tab
The Administration tab is where most of the parameters related to our environment are configured. However, over time, most of these settings have been moved to LifeTime (which we'll see more of later in this chapter).
The following tabs are available in the Administration tab:
- Users: In this tab, we can see all the IT users registered in this environment (note, these users are not end users; they are all developers, DevOps users, and other profiles related to application development, infrastructure management, and project management). Management of these users is performed in LifeTime.
- Roles: Here, we can see the current roles for the IT users. These are also managed in LifeTime.
- Environment Configuration: This is where we configure important settings for our environment. We can set the environment name, whether it is productive or not, whether it allows debugging, the date format, the administration email, the number of retries for Timers in case of failure, along with enabling/disabling deployment and reporting features.
- Security: This is where we check and enable/disable security features, such as the use of SSL/TLS, HTTP Strict Transport Security (HSTS), cookie security, and content security policy (CSP) management.
- Database Connections: Remember we said we can connect our platform to external databases? This is where we configure, create, and visualize the connection points.
- Email: To send emails through our applications, it is necessary to configure an email account (sender). In this tab, we configure the email sender data so that the platform can take advantage of this feature.
- Certificates: Here, we can insert and activate the certificates that are necessary for the given environment (for example, authentication certificates).
- SEO Friendly URLs: Here, we can configure our aliases, site rules, and redirects to obtain more user-friendly and intuitive URLs for search engine optimization.
- Licensing: Here, we can check all the attributes related to the licensing of our environment, including the users, application objects, serial numbers, activation codes, license types, end dates, organization names, and editions.
The following screenshot shows the OutSystems Service Center Administration and Environment Configuration tabs:
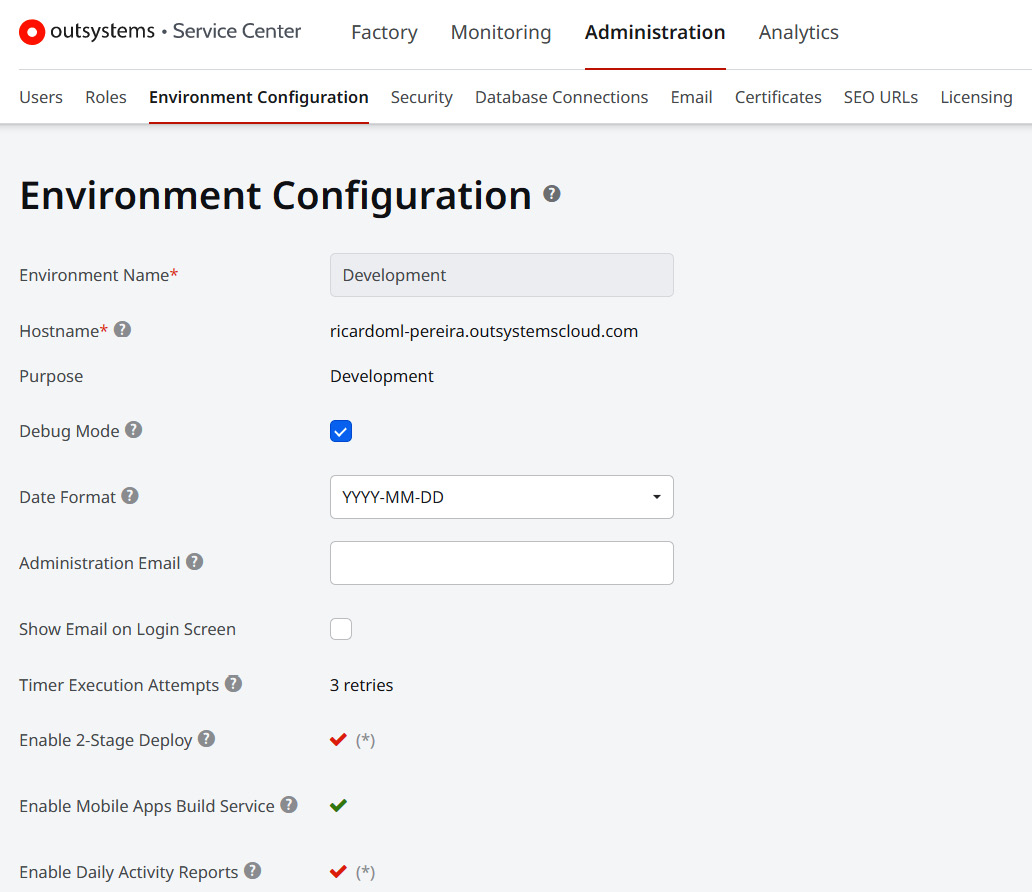
Figure 2.12 – The Service Center Administration and Environment Configuration tabs
Note that the available configurations vary with the type of platform we are parameterizing. By default, Personal Environments have fewer parameterizable fields and, in enterprise accounts, only those who have permissions to do so can configure the environment (that is, the permissions assigned to the IT users in LifeTime).
The Analytics tab
In the Analytics tab, we can obtain or create various reports on the behavior of the environment, such as daily history, or modules that have not been used for a specified period of time.
In the Reports tab, we can generate or obtain the following report types:
- Activity per hour
- Activity per day
- Extension performance
- Screen performance
- Performance of database queries
- Performance of Timers (batch jobs)
- Service Actions performance (internal abstractions of the REST API's platform)
- Integration performance
- Top errors
Typically, much of the analytics data is shown in both Service Center and LifeTime.
The following screenshot shows the OutSystems Service Center Analytics and Reports tabs:

Figure 2.13 – The Service Center Analytics and Reports tabs
However, for a more detailed analysis of the level of performance and trends relating to the frontend layer, OutSystems recommends the use of external tools and, in the Forge, there are already connectors for this.
OutSystems wanted to go further and provide more power to manage DevOps within the platform, such as managing teams and IT users, quick deployment management, and efficiently performing deeper configurations on the platform. So, in the next section, we'll look at a worthy tool for this purpose: LifeTime!
Managing your infrastructure with LifeTime
LifeTime is a centralized console that allows the end-to-end management of the OutSystems infrastructure, including the configuration of its constituent environments, the management of IT users and their roles, application deployment, and security.
In this console, we are able to add plugins such as Architecture Dashboard, a very useful tool in the context of OutSystems architecture.
LifeTime provides the following tabs:
- Applications: In this tab, we can manage the complete life cycle of our applications across environments, check versions, perform deployment plans across environments, and inspect past deploys. Also, it allows you to check whether we have any outdated or broken applications.
- User Management: Here, we can manage IT users and teams and their access profiles across all environments. Roles are highly configurable – that is, we can create custom profiles. In addition, the platform provides the ability to create teams and assign profiles to users based on the teams to which they belong, facilitating the management of permissions within the infrastructure.
- Environments: In this tab, we can view and access the configurations of all the environments that make up the infrastructure. Settings can be modified in an intuitive and practical way related to secure endpoints, adding and removing environments, and creating database users. In addition, access to Service Center for each environment is provided so that we can check the environments' logs.
- Analytics: In this tab, we can inspect performance issues in several layers, and for reactive web and mobile applications, we must use external monitoring tools that integrate with the OutSystems platform via APIs, such as, for example, Elastic RUM (note that this is only available for traditional applications, which are out of scope for this book). In the Forge, there are already connectors to monitoring Reactive web and Mobile applications existing in our platform,, simplifying the integration and adaptation process.
- Plugins: In this tab, we can install existing components (such as Architecture Dashboard), as well as create our own plugins. These tools allow us to extend the capabilities of LifeTime to third parties and/or acquire capabilities for LifeTime itself.
The following screenshot shows the OutSystems LifeTime Environments tab:

Figure 2.14 – The OutSystems LifeTime Environment tab
The OutSystems platform was designed to make it easier to access relevant information about the life cycle of our applications and all kinds of events that allow us to monitor and control the status of our environments, with LifeTime being a perfect example of this. In each of the aforementioned tabs, we can immediately find what we are looking for.
There is a concept that is so important that it is dealt with in a separate application: the end users. We can create and edit them, and assign and remove their roles. Let's see how to do this in the next section!
Managing end users with the Users application
The Users application is where we manage the end users of our OutSystems applications. Here, we can create and edit users, manage their status and role assignment, and unlock them.
To perform these operations, the current user must have the UserManager role, otherwise, they will not have access to the features of this application.
In order to facilitate the assignment of roles to multiple users, we can create teams, where we assign the team its given roles, and every end user added to that team will inherit those roles. This way, we can manage the roles that each user must have in a more practical and streamlined way.
Roles created in our applications through Service Studio are automatically visible in the Users application and can be assigned here or programmatically through code in our own applications.
The Users application provides three tabs:
- Users: In this tab, we can view existing users, access their details (and edit them), view inactive users (and activate them), and export user lists as Excel files. Additionally, there is a link to create new users, redirecting the application to a Create New User screen.
- Groups: Here, we can create groups based on business or permissions concepts. After creating them, we can add the desired roles and their permissions, and associate users with them. This way, it becomes easier to manage the assignment of roles, allowing to add or remove roles to multiple users simultaneously. On this page, we can see all existing groups.
- Applications: Here, we can see all the applications that use OutSystems as user providers and the number of active users with roles related to each application.
The following screenshot shows the Users tab of the OutSystems Users application:

Figure 2.15 – The Users tab of the OutSystems Users application
Note that this application makes all these features available to users registered in the OutSystems default user provider. In more specific and customized cases, we can have applications that use another user provider, and its users are not listed in the Users application.
It is possible to configure delegated authentication methods in this application, including Microsoft Active Directory (AD) and Azure AD.
All this makes a lot of sense if we want to extend our platform and create custom code in C#/.NET, or even integrate with third parties and legacy systems. For this, we use a development tool that, despite being very simple, is extremely powerful, and even allows connection with Microsoft Visual Studio (for custom native code development). We present, in the next section, Integration Studio!
Integration Studio walkthrough
Integration Studio is a tool that allows us to create extensions to our platform, such as creating functionalities in native C#/.NET code. Functions made in C#/.NET are transformed by Integration Studio into Server Actions. In this way, our custom code is available similarly to our application code for consumer modules.
Furthermore, with this tool, we can configure our connections to external databases (after the given connection has been configured in Service Center).
In a way, it's a simpler tool than Service Studio since it offers much less functionality; Integration Studio works in parallel with Microsoft Visual Studio to help us develop our code.
The following screenshot shows the OutSystems Integration Studio popup where we configure the Visual Studio connection:
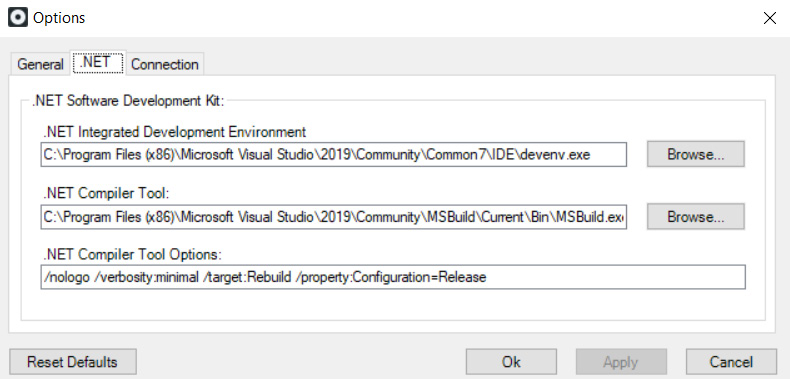
Figure 2.16 – The Integration Studio popup to configure the connection with Microsoft Visual Studio
Integration Studio has fewer layers and features than Service Studio:

Figure 2.17 – The Integration Studio main screen
All sections of the main screen are designed to be visually intuitive and easy to find according to context. In addition, it maintains a pattern similar to (albeit simpler than) Service Studio, so developers won't have difficulty adapting.
Therefore, Integration Studio's main screen is divided into the following sections:
- Toolbar: In this area, you can create new extensions, verify and publish an extension, connect to the Platform Server, and download your extensions.
- Multi-tree Navigator: In this area, you can add and select your Actions, Structures, and Entities (in the Extension tree), and add and select your Resources (in the Resources tree).
- Status bar: This area contains information about the extension, including the folder where the Extension and Integration Framework (XIF) is saved.
- Multi-tab editors: This area contains all the elements (extension, Actions, Structures, Entities, and Resources) that you have selected in the Multi-tree Navigator.
- Specific Editor: In this area, you can edit the extension and its elements: Actions, Structures, Entities, or Resources.
- Server Info: In this area, you can find information about which Platform Server you are connected to and which user established this connection.
In order to facilitate the use of Outsystems IDEs and maintain uniformity between the tools, after completing our development, Integration Studio also provides the 1-Click Publish button seen elsewhere in OutSystems. When 1-Click Publish is clicked, it triggers the entire compilation process and the verification and publication of the code we have developed.
Summary
OutSystems provides a set of tools that covers all the necessary requirements for the easy, fast, and secure development, monitoring, and configuration of infrastructure and applications.
We have two development tools: Service Studio and Integration Studio.
OutSystems also provides three out-of-the-box management tools: Service Center, LifeTime, and the Users application.
Comparing OutSystems tools to native technology tools makes it seem too easy! But that's the way it is – easier to learn, easier to use, and faster to develop with!
In the next chapter, we will learn how to register with OutSystems in order to obtain a Personal Environment and the necessary tools for application development.
Let's get to work! Now it will be even more fun!