
Chapter 15: BPT Processes and Timers – Asynchronous Tools in OutSystems
The OutSystems platform has an extremely useful tool to manage the business Processes integrated into our applications. In this tool, called Business Process Technology (BPT), business Processes are simply referred to as Processes.
These Processes are the flow that a given task or event must respect, having a life cycle independent of the rest of the application logic, and may have manual or automatic activities during its execution. Note that a Process occurs asynchronously.
Furthermore, a Process can run other Processes, which become sub-Processes of the parent Process. The parent Process can then deal with these sub-Processes in different ways, either waiting for the results or continuing to run.
However, this is not the only asynchronous functionality that OutSystems provides. For processing massive data (also known as batch jobs) and for longer operations, we can use tools called Timers. Basically, we configure a Timer to run at a certain time and date with a defined priority, and it runs the logic associated with it at that time (or as close as possible – it always depends on the availability of the server). The logic associated with the Timer is a server action with the logic needed to accomplish what we intend.
In order to fully understand this subject, the chapter is divided into the following topics:
- Process BPT overview
- Timers and how they work
- BPTs versus Timers
- Monitoring Processes and Timers
When we finish the chapter, we will be able to build simple BPT Processes and have knowledge of how we can scale them, such as understanding what kind of artifacts to use and when.
We will also be able to use and configure Timers to Process data, understand the major differences between BPTs and Timers, and how to monitor both in Service Center.
To start, let's take a tour of BPTs, seeing how and where we can implement them.
Process BPT overview
In OutSystems, a Process is seen as a way to carry out all the steps and phases of a task within a company, such as a recruitment Process, handling an order, or a help desk support request.
In order to create the Processes for our application, we have to understand very well the guidelines that they must follow and what kind of activities must take place during them. It is important to define the business rules very well so that the Process runs and guarantees the correct functioning of the application.
To support these business rules, the platform provides a set of visual artifacts, all of them very intuitive and easy to use.
Let's work through the following steps in order to start creating our Process:
- We open the Processes tab, right-click on the Processes folder, and choose Add Process:
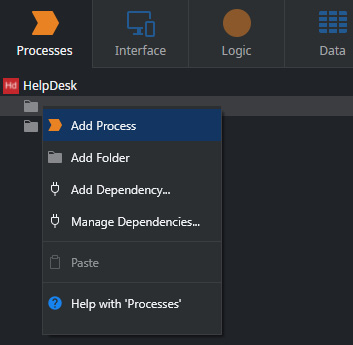
Figure 15.1 – The Add Process option in the Processes tab
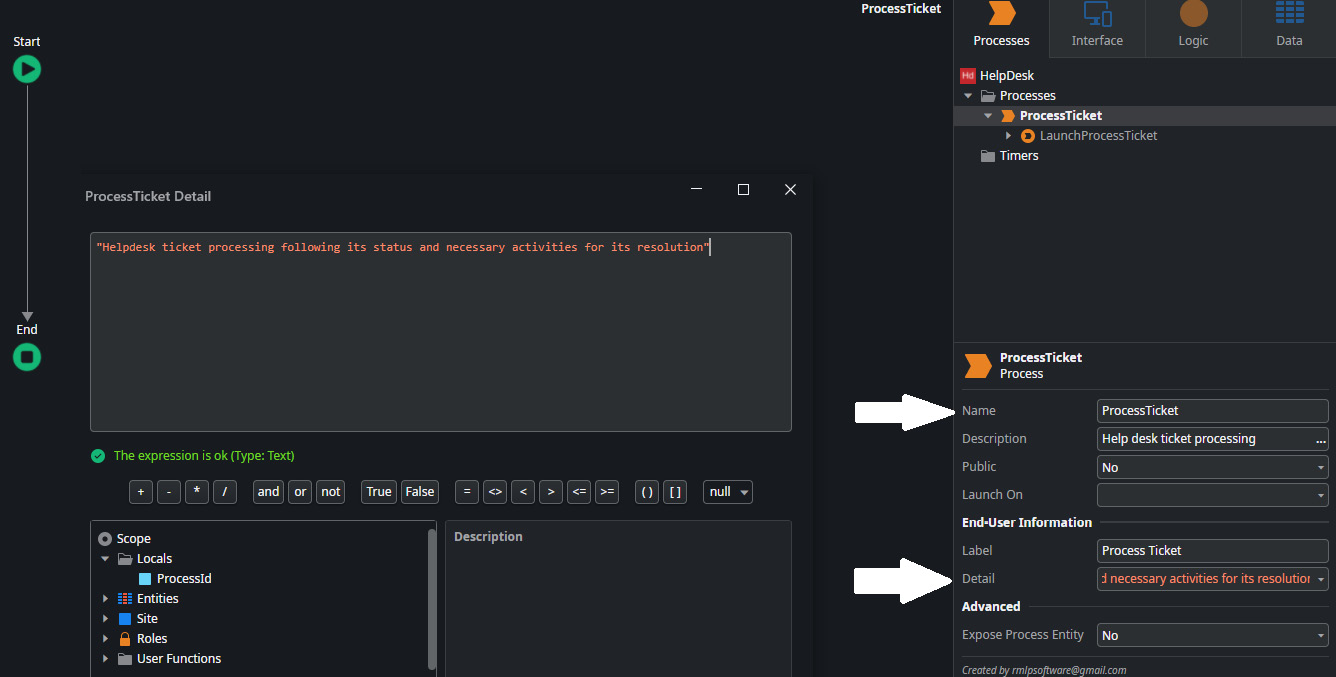
Figure 15.2 – Fill Process name and detail fields
- Then we have to choose how to start the Process. We can start it by setting a CRUD operation in the Launch On field or we can use the Callback Action of the Launch Process in our logic:
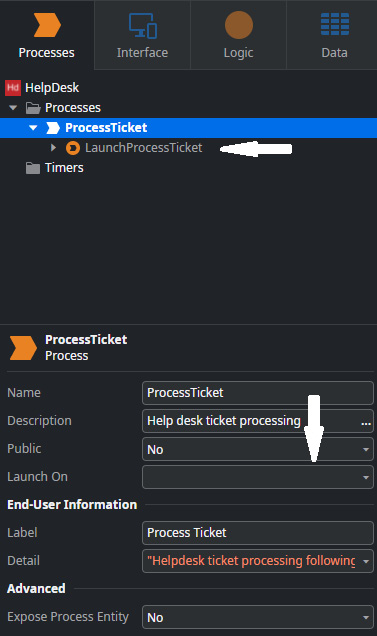
Figure 15.3 – Process launch options
- If we want to expose the Process entity so that we can get information about the Process in our code, we can do it simply by going to the Advanced properties section of the Process and choosing Yes for the Expose Process Entity attribute:
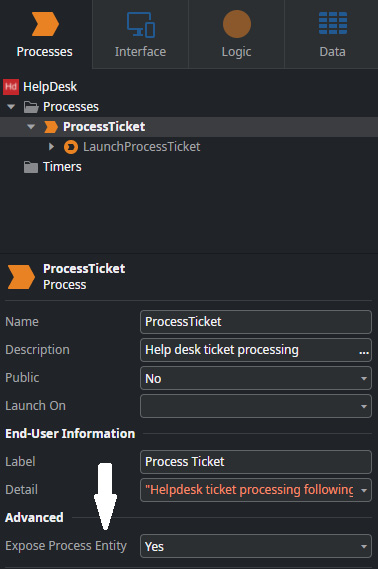
Figure 15.4 – Expose Process Entity
- From this moment on, the Process entity becomes available in the Data tab, which has a read-only property, since the only available method is Get:
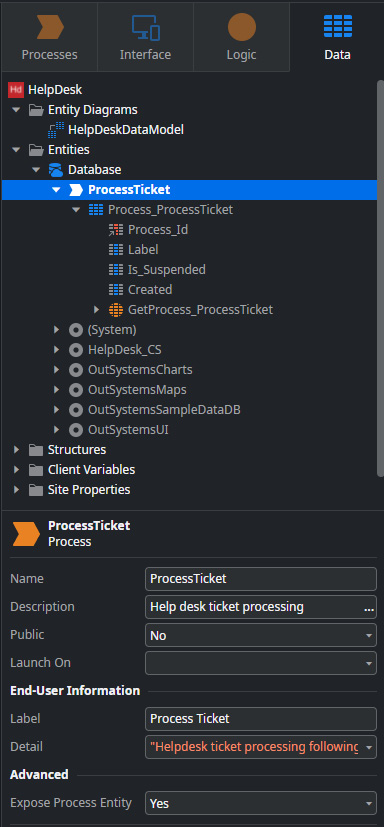
Figure 15.5 – Exposed Process entity in the Data tab
We can use the data of this entity to control the state of our Processes at runtime, for example, if a Process is suspended or there has been an error.
We can also, in more advanced scenarios, use the Id of a Process returned by this entity to terminate a Process.
Then, in order to create our flow, the following visual artifacts are made available:
- Start: This is where the Process will begin. We can only have (as with actions) one node start per Process.
- Conditional start: This is a special start used to initiate alternative flows. You can check the following documentation link to see in what context you can use them: https://success.outsystems.com/Documentation/11/Reference/OutSystems_Language/Processes/Process_Tools/Conditional_Start.
- Human activity: This is an activity that will be performed by a human being on the frontend. It can usually be configured to be performed by a specific user, a group, or all users. You can check in the documentation how this artifact works in general: https://success.outsystems.com/Documentation/11/Reference/OutSystems_Language/Processes/Process_Tools/Human_Activity.
- Automatic activity: These activities are performed automatically without user interaction. They are usually used to automate Processes in repetitive tasks. Via this link, you can check its general use: https://success.outsystems.com/Documentation/11/Reference/OutSystems_Language/Processes/Process_Tools/Automatic_Activity.
- Execute Process: We can run another Process as an activity, these being called sub-Processes of the parent Process. We can investigate this in a little more detail at the following link: https://success.outsystems.com/Documentation/11/Reference/OutSystems_Language/Processes/Process_Tools/Execute_Process.
- Wait: Sometimes we may need to put the Process on hold for a condition to be met. For this, we use the wait artifact. It is parameterized so that it only continues execution when a certain condition is validated. We can find out a little more at the following link: https://success.outsystems.com/Documentation/11/Reference/OutSystems_Language/Processes/Process_Tools/Wait.
- Decision: This artifact allows us to follow different paths of our flow based on the conditions we define for it. We can see it as a switch in the flow where, derived from the verified condition, it follows the corresponding path. We can check its general usage at the following link: https://success.outsystems.com/Documentation/11/Reference/OutSystems_Language/Processes/Process_Tools/Decision.
- Comment: As with our actions, we may have to record something important and in detail. For this, we can use comments.
- Process End: As it begins, a Process must also end. To finish, we use the End node. There can be more than one End node in our stream, as it can have several branches caused by Decisions. We can configure this End node to terminate the Process or not (we should always pay attention to what context this Process is used for, since it can run as a sub-Process in another parent Process and can cause anomalous behavior). We can find out a little more on this at this link: https://success.outsystems.com/Documentation/11/Reference/OutSystems_Language/Processes/Process_Tools/Process_End.
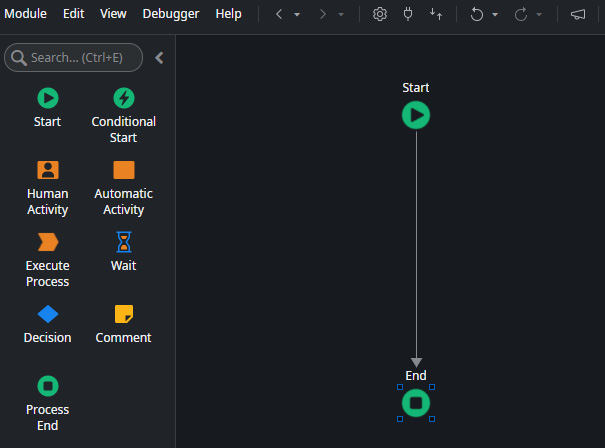
Figure 15.6 – Available artifacts in the toolbox
Each activity generated in the flow of a Process using a Process tool has an independent life cycle.
With the knowledge of these artifacts and how to initialize a Process, we can already begin to understand the implementation part of a procedural flow and make decisions. These tools that we've seen so far allow us to adapt a Process to the applicational need, always keeping everything abstracted and centrally manageable.
Now let's see how to define a Process flow, invoke sub-Processes, and make decisions.
As with almost everything in OutSystems, the visual concept is also applied to Processes.
For that, we have a canvas where we can create our logic, and the way it is done does not differ much between server, service, or client action logic. The big differences are the artifacts that are available, but everything happens in sequence.
Another difference, as already mentioned at the beginning of this chapter (but it is so relevant that it won't hurt to go back to remind yourself), is that Processes occur asynchronously.
The canvas is the central area of the Service Studio workspace where you drop tools from the Process Flow Toolbox to define your Process logic.
To see the properties of a Process activity, select it in the Content View and the properties will be displayed in the Properties window.
To define the flow of a Process, connect elements in the Content Screen starting from the Start element – there can only be one Start node in our Process flow. To finalize a flow path, use the End element – depending on the elements you use in the Process flow, you can have one or multiple paths.
Within a Process flow, you are allowed to use other initialization tools to define alternative flows to handle specific events:
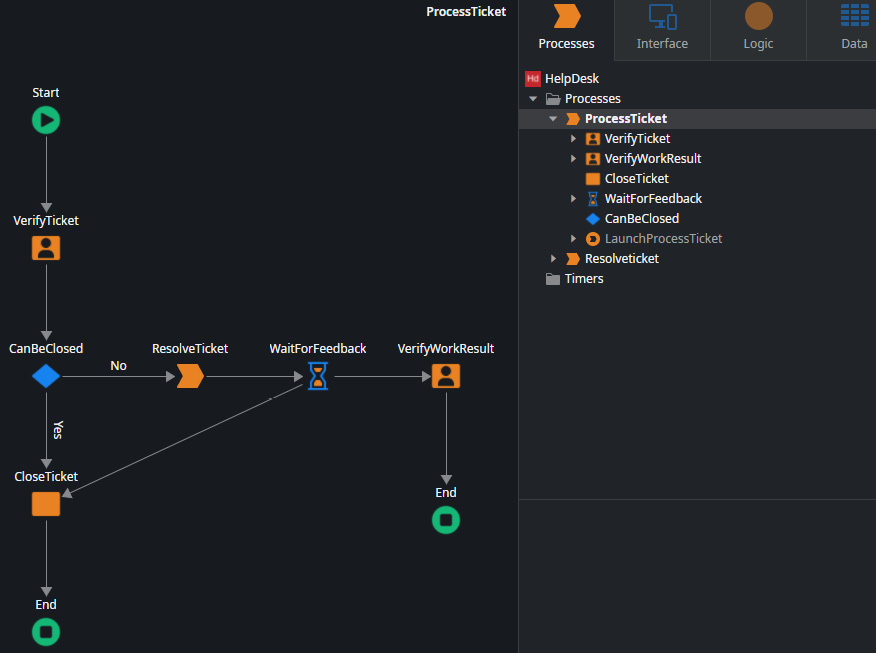
Figure 15.7 – Process flow example in the canvas
While designing the flow of our Processes, we can introduce validation rules for their execution. If for some reason we need to block or give up on the Process, we can do it using the callback actions. How do we do this?
In the module tree, under Processes, right-click on the Process element, choose Add Callback Action, and pick one of the available actions:
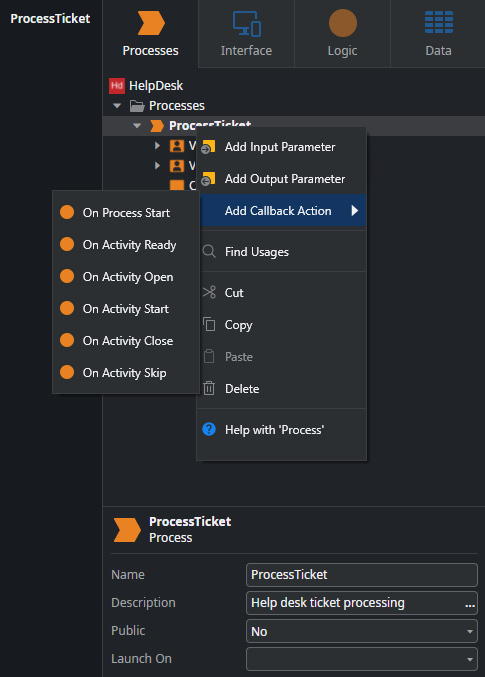
Figure 15.8 – Available callback actions in a Process
Some of the callback actions are at the Process level and some are at the activity level, as shown in Figure 15.9:
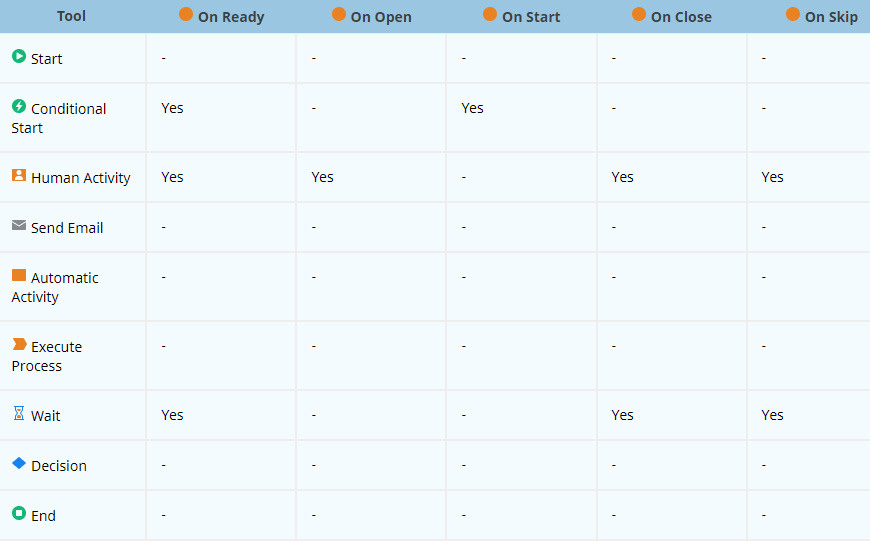
Figure 15.9 – Activity (artifact) callback actions
We may come across scenarios where we repeat multiple business rules in multiple callback actions for different activities during our Process flow. In these scenarios, we must then change the common rules to a single callback action, but this is done at the Process level, as we can see in Figure 15.8. We must add the callback action to the Process and develop the business rules in it, thus centralizing the code and allowing it to be better maintained, also avoiding repetition.
Otherwise, we can create the callback action at the activity level:
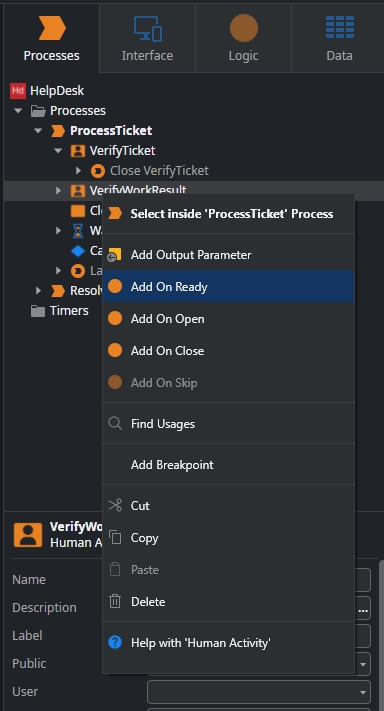
Figure 15.10 – Add a callback action at the activity level
Info
The sub-Processes that are defined in our Process flows do not inherit the Callback Actions. Basically, each Process has its own scope for the callback actions. BPTs have a variant for cases where we need data-driven Process management and have no need for human intervention. This variant is called Light BPT and allows more threads simultaneously than traditional BPT. In this case, while traditional BPT only allows 10 threads, Light BPT allows 20 as shown in Figure 15.11
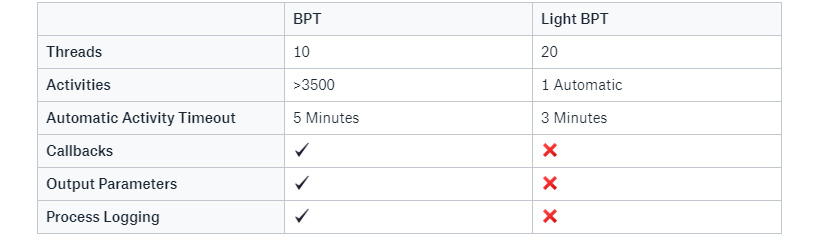
Figure 15.11 – BPT and Light BPT differences
How can we create a Light BPT?
First, the Process we created can have one and only one automatic activity and no other activities of any other type. Also, it can only be triggered through a database event and never by the Process Launch Action, otherwise it will run like a traditional BPT Process:
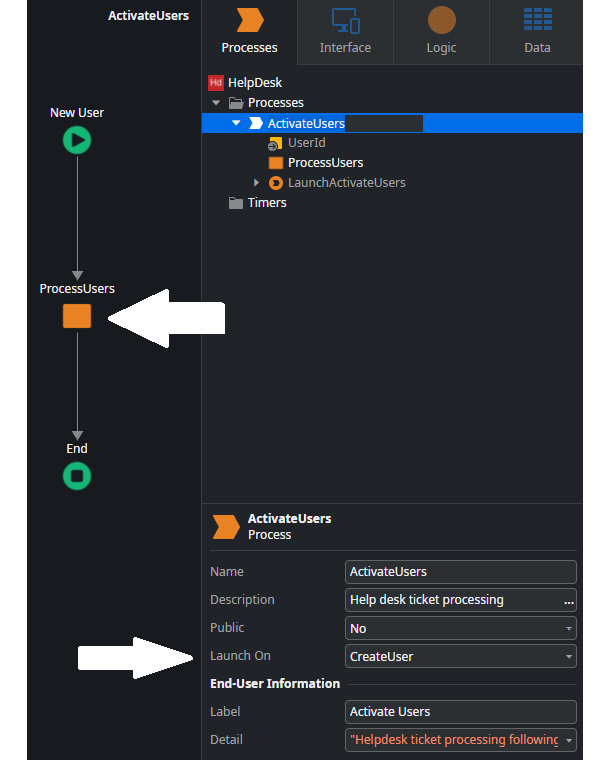
Figure 15.12 – Add only one automatic activity and define the Launch On property for the Users entity event
The next step is to enable the Light BPT in the module settings in Service Center. In the module definitions inside the Operation tab, activate Light Process execution:
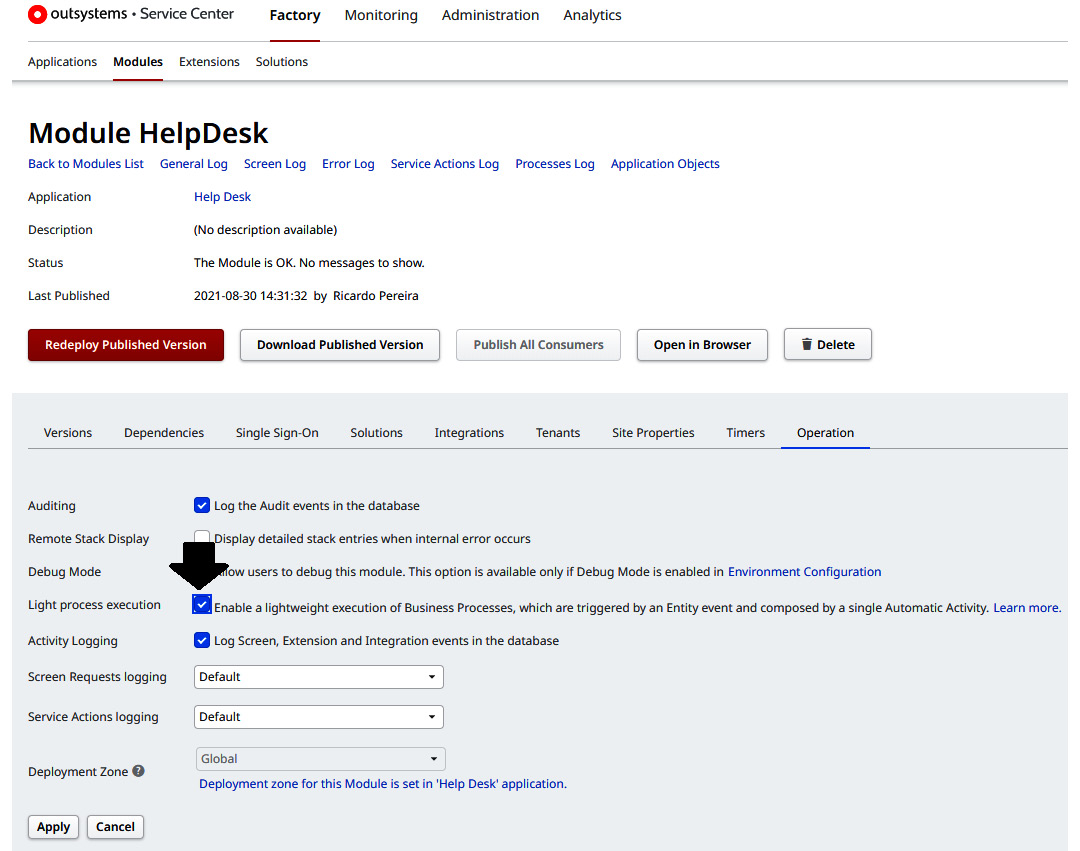
Figure 15.13 – Activate Light BPTs in Service Center
After these steps, we click on Apply. Then we must publish the module again, which can be done through Service Center or Service Studio.
Now the Process is enabled to run lightweight Processes.
Remember that just one trigger by a database event runs the Process as a Light BPT. Starting the Process using the Start Process action runs the Process as a traditional BPT.
OutSystems has another tool for asynchronous events. In this case, this tool is used to run Processes at a certain date and time, despite allowing its execution through its call in our code. This is the Timer.
Timers and how they work
Timers are tools that allow us to run logic periodically at a scheduled date and time, and this event is usually called a batch job. It can also be invoked from application logic, via the Wake event.
There are a set of elements on the platform related to Timers that allow us to have a better understanding of their context:
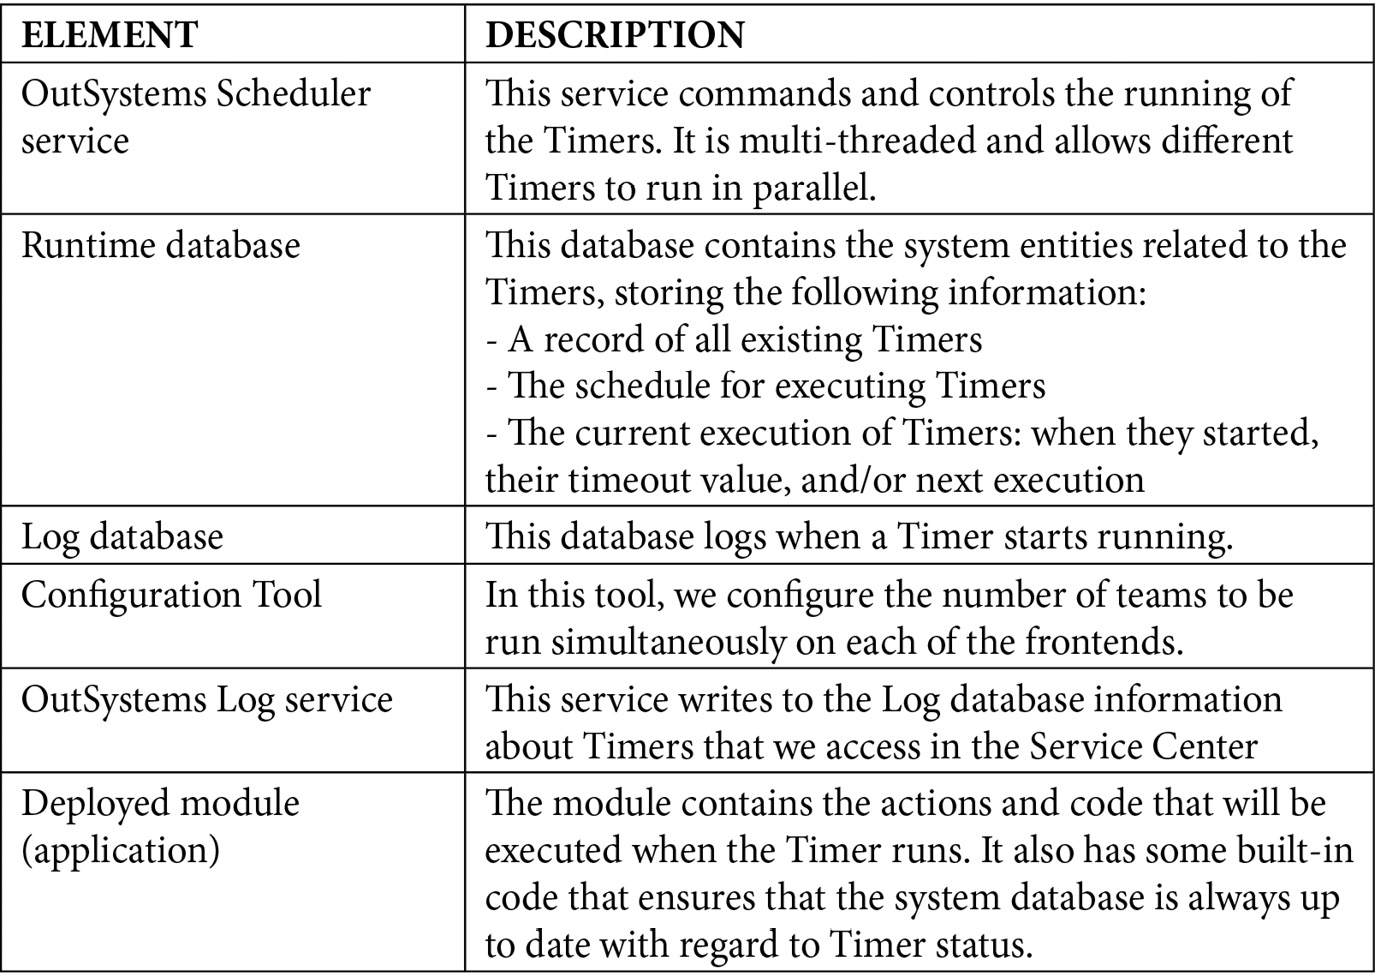
Figure 15.14 – OutSystems elements related to Timers
With this information, we will be able to understand the following further examination of this topic.
To create a Timer, work through the following steps:
- Click on Service Studio's Processes tab, right-click on the Timers folder, and select the Add Timer option:
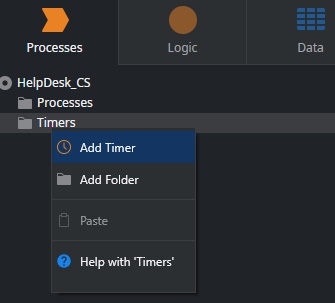
Figure 15.15 – Create a Timer in Service Studio
- Then we select which server action will be executed when the Timer runs. Alternatively, we can choose the New Server Action option, thus creating a new server action where we can create our logic:
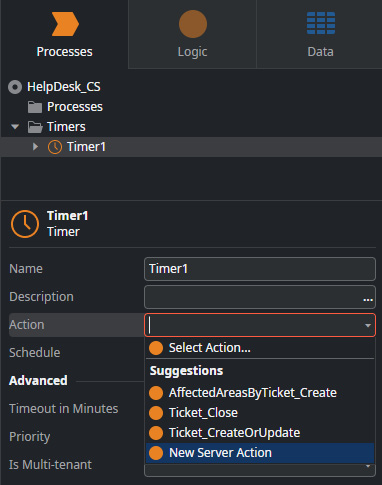
Figure 15.16 – Selecting the action to be run with our Timer
If there are input parameters, their values must be defined when the Timer is created and, if there are output parameters in this same action, their values are not accessible after its execution.
- The next step is to adjust at what point in time the Timer should be run in the Schedule attribute:
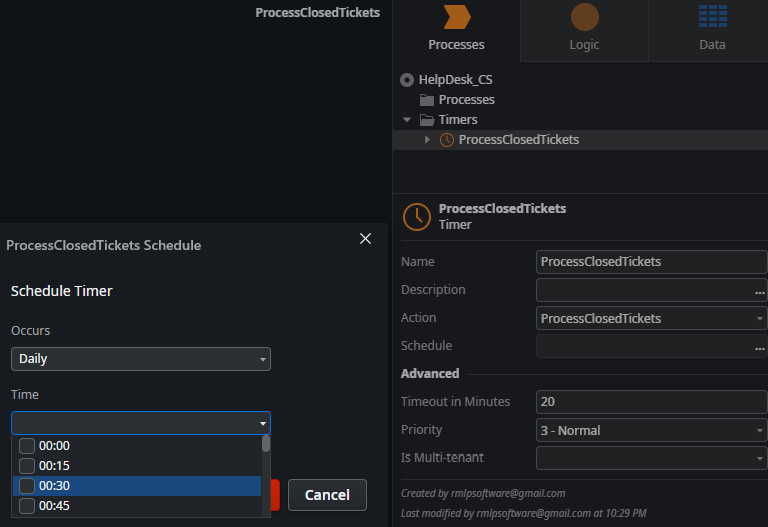
Figure 15.17 – Defining the schedule for the Timer in Service Studio
Info
The effective schedule of the Timer is defined in Service Center. If you set the Timer schedule when designing the app, the first schedule will be ignored. This ensures that you can customize the Timer schedule when deploying an application in another environment, without having to change the application itself.
Another way to run the Timer is to call it directly in our application code, via the built-in Wake action:
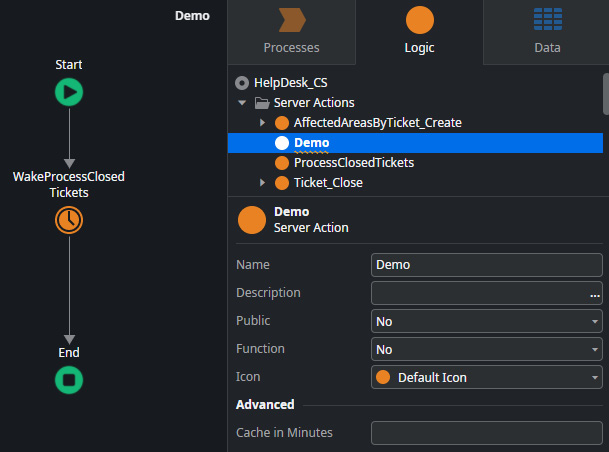
Figure 15.18 – Calling the built-in Wake Timer action in a regular server action
If we explicitly need to run the Timer at any time, we can do it through Service Center by accessing the Timer and clicking on the Run Now button:
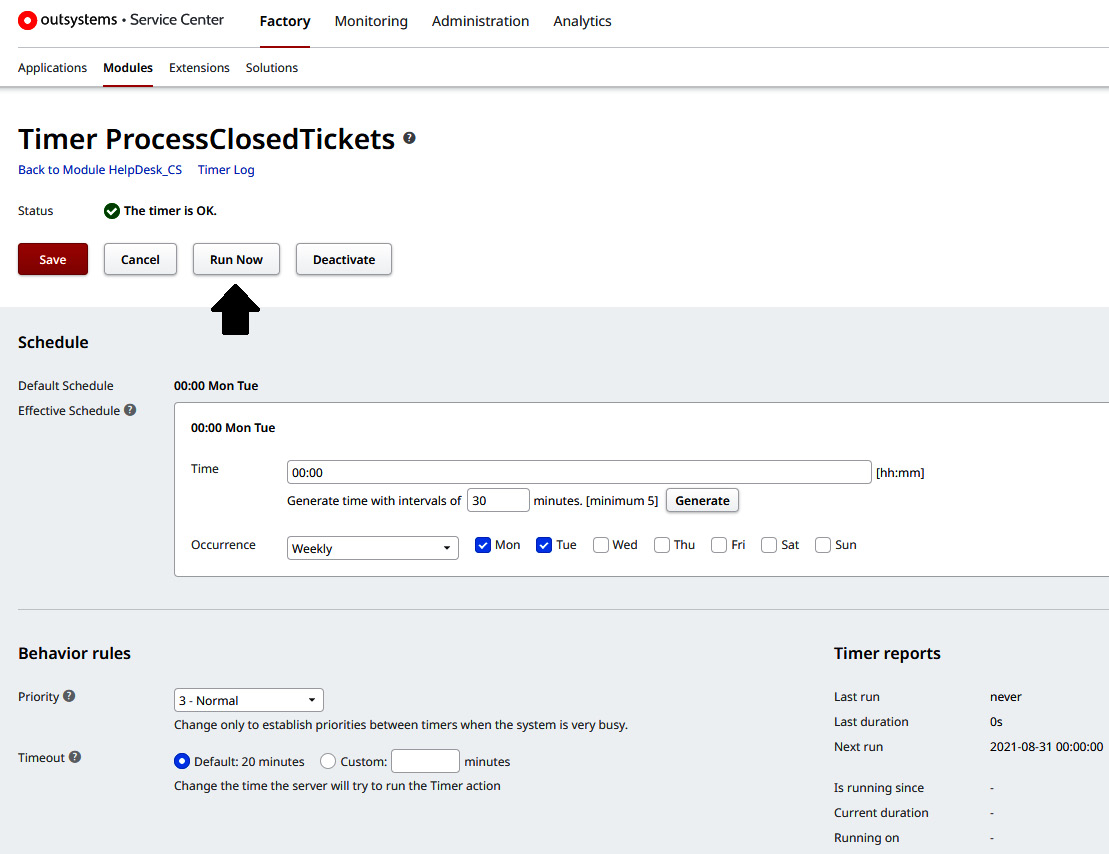
Figure 15.19 – The Run Now button in Service Center to explicitly run a Timer
Another attribute that we must consider is Timeout (default 20 minutes). Essentially, the value defined here is the time in minutes that the Timer is given to run. If the operation does not finish within this defined time, the Timer returns an error, and will try again later. Note that Timers only make three execution attempts. If on the third attempt it fails again, it will only run again on the next schedule.
In addition, we also have the Priority attribute, which can take one of four possible values: Low, Normal, High, and Top.
What is Priority for? If there are several Timers set to run at the same time, which one will run first is defined by this attribute: the higher the priority, the sooner it starts running in relation to its competitors.
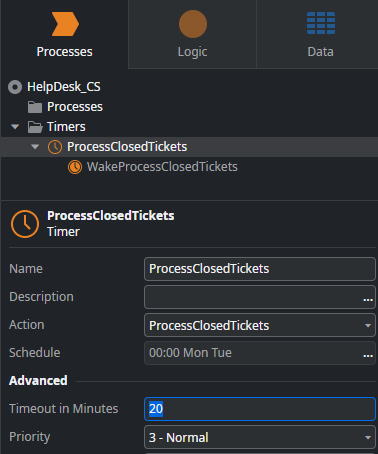
Figure 15.20 – Timeout and Priority attributes are defined in the Timer properties
Tip
You can see more details about Timers here: https://success.outsystems.com/Support/Enterprise_Customers/Maintenance_and_Operations/OutSystems_Platform_Timers_and_Asynchronous_Processes.
Timers are a useful tool when it comes to longer and/or massive processing of information. Furthermore, there are techniques being developed to Process Timers that run actions with very high processing load Process and heavy access to databases, with these Timers being called heavy Timers.
There are guidelines on how to act to handle these cases, and how to solve each of the possible bottlenecks that can result. We can introduce techniques such as having a "soft timeout" (a control variable that allows the Timer to finish before reaching the predefined timeout and can call itself (the Timer) starting from the point where the previous iteration ended) or using a history file.
Tip
You can see more details about heavy Timers here: https://www.outsystems.com/training/lesson/1749/odc-2018-heavy-Timers.
With all this information, you most likely understand the pros and cons of BPT and Timers, and when and why to use each of them. When choosing which to use, it is best to compare them side by side, taking into account the benefits of each to better adjust our choice to the solution we need. In the next section, we'll consider BPTs versus Timers.
BPTs versus Timers
Although both BPTs (both light and traditional) and Timers are asynchronous tools, their purposes are not that similar.
Factors such as parallelism and competition differ between the types of Processes.
By default, there are 20 threads per frontend to run Light BPT Processes, 10 threads for traditional BPT Processes, and 3 threads for Timers.
Furthermore, BPT Processes are driven by database events, while Timers are triggered by a programmed schedule (they can also be triggered in the application code with Wake, but a Timer is not an event focused on a database event).
Also, while the Timer makes three attempts to run successfully, BPTs try until they succeed or until someone cancels them in Service Center.
All these factors have to be considered when deciding on the ideal tool to use; that is, in practical terms:
- Timers are recommended for massive or time-consuming processing of data that is not oriented towards a specific database event but more for scheduling or application background processing such as sending emails.
- Traditional BPTs are recommended for automation of database event-driven Processes with or without human intervention, but with the definition of several procedural steps that lack logging.
- Light BPTs are recommended for database event-driven processing, which needs speed and does not need logging mechanisms (Light BPTs do not use the log mechanism of traditional BPTs). Also, they are the right choice when we need thread-level parallelism.
As already mentioned, Light BPT does not support the logging mechanism of traditional BPTs. However, it is useful to understand what logging is done and how we can use Service Center to check them and monitor our Processes. In addition, we also have the Timer logging component to understand and how it also helps us to monitor the Timers of our applications.
Monitoring Processes and Timers
The monitoring of asynchronous tools, like all other tools, is done in Service Center. All logs are recorded in the database and can be searched in the Service Center window related to the type of tool in question.
To monitor the Timer logs, we open Service Center, and in the Monitoring tab, click on Timers:
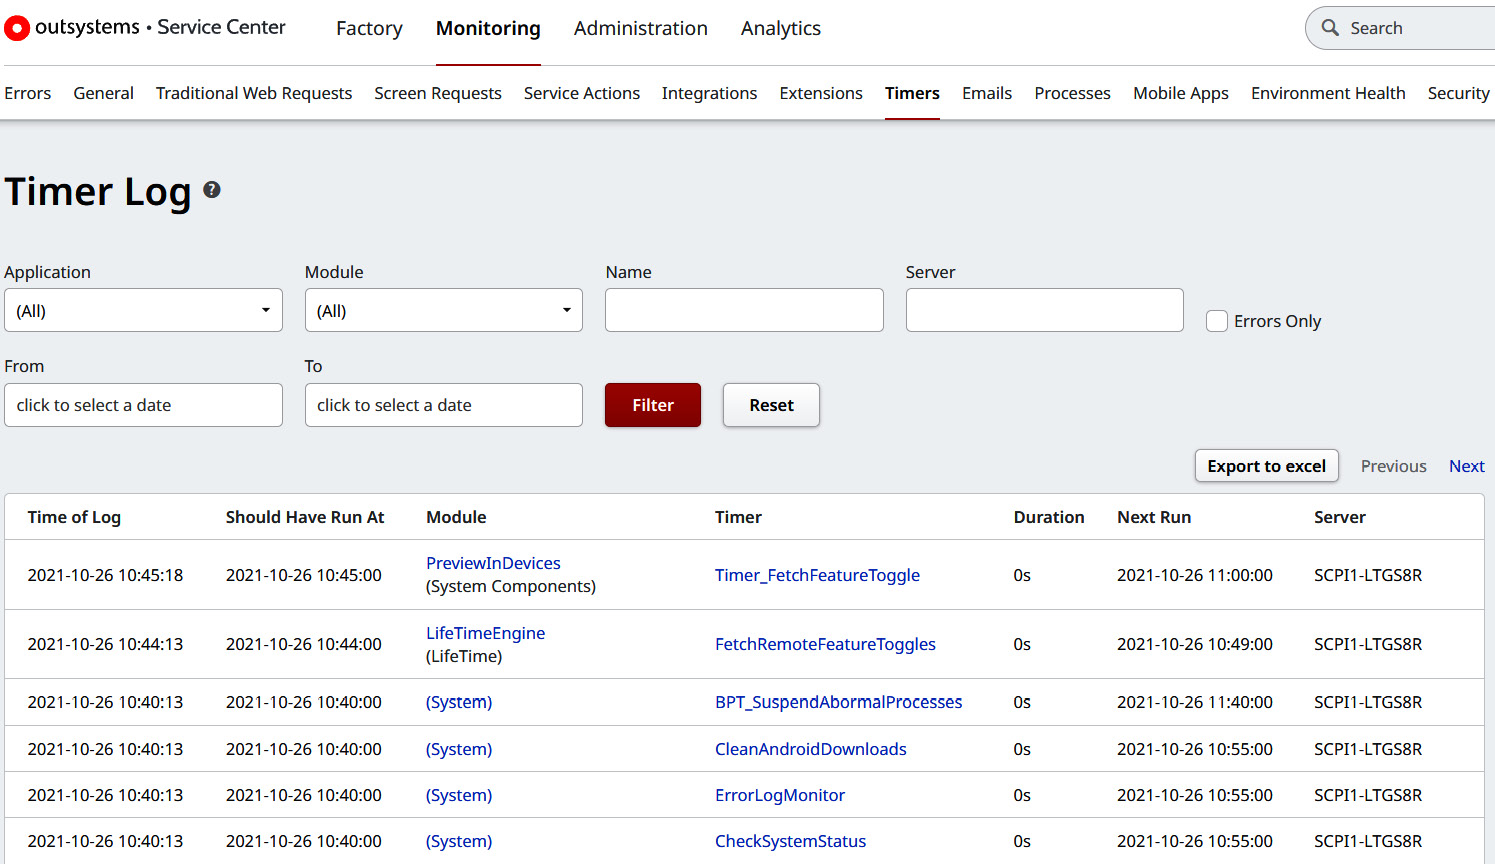
Figure 15.21 – The Timers monitoring tab in Service Center
In this tab, we can find out the following:
- The date and time the log was created
- The expected date and time when the Timer should have executed
- The module the Timer belongs to
- Which Timer was executed
- Timer run duration
- The scheduled date and time for the next run
- Which frontend server the Timer was run on
We can also find useful information regarding Timers in the Environment Health tab in the Monitoring section:
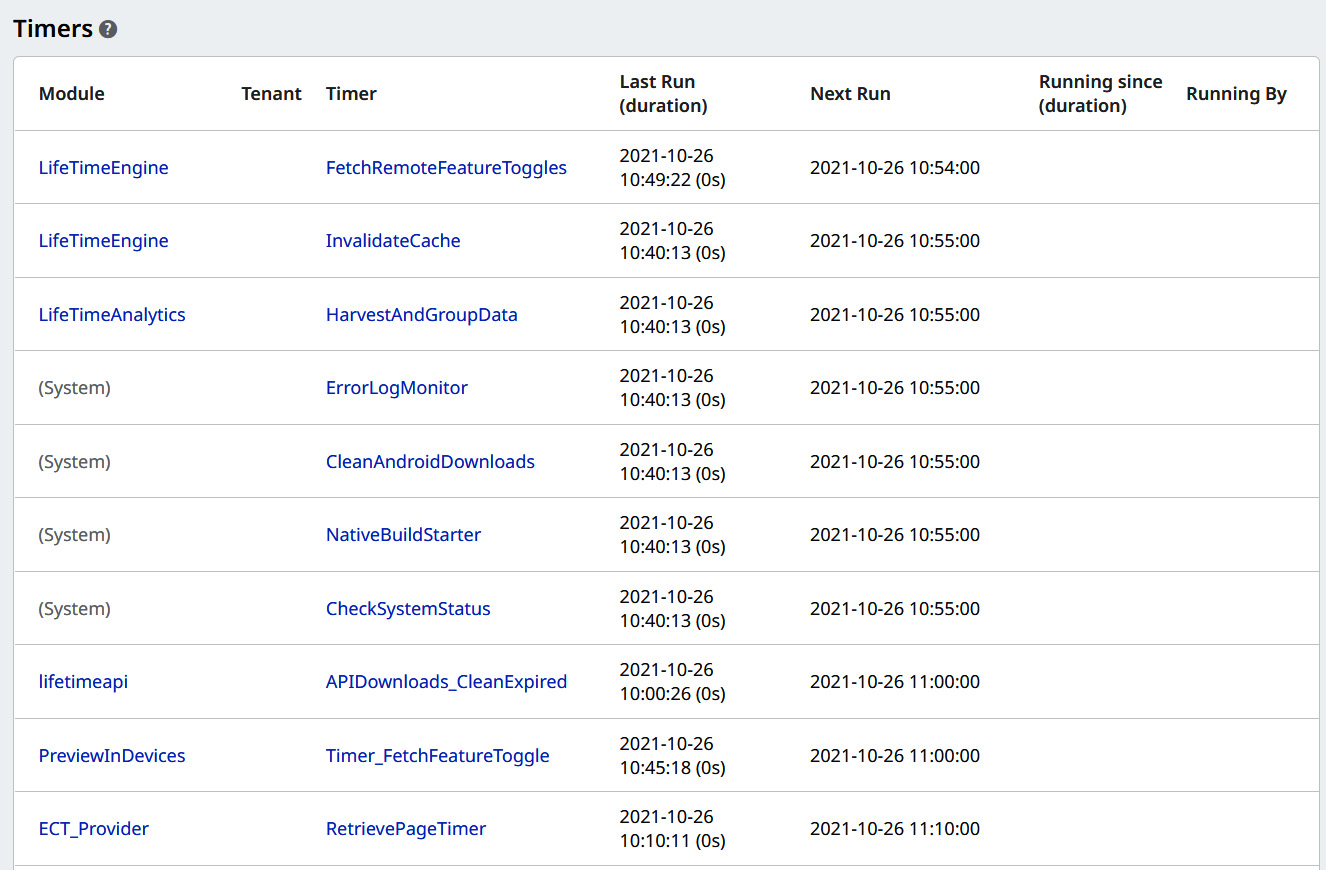
Figure 15.22 – Timer monitoring info in the Environment Health tab
An interesting point in this section is that we can see information about Timers running at the respective moment of the query, both their duration and which server is running them.
Errors that occur in Timers, as with all aspects of the platform's error log, are shown in the Errors tab of the Monitoring section, and we can access their details by clicking on Error.
To monitor our BPT Processes, we access the Monitoring section and click on the Processes tab:
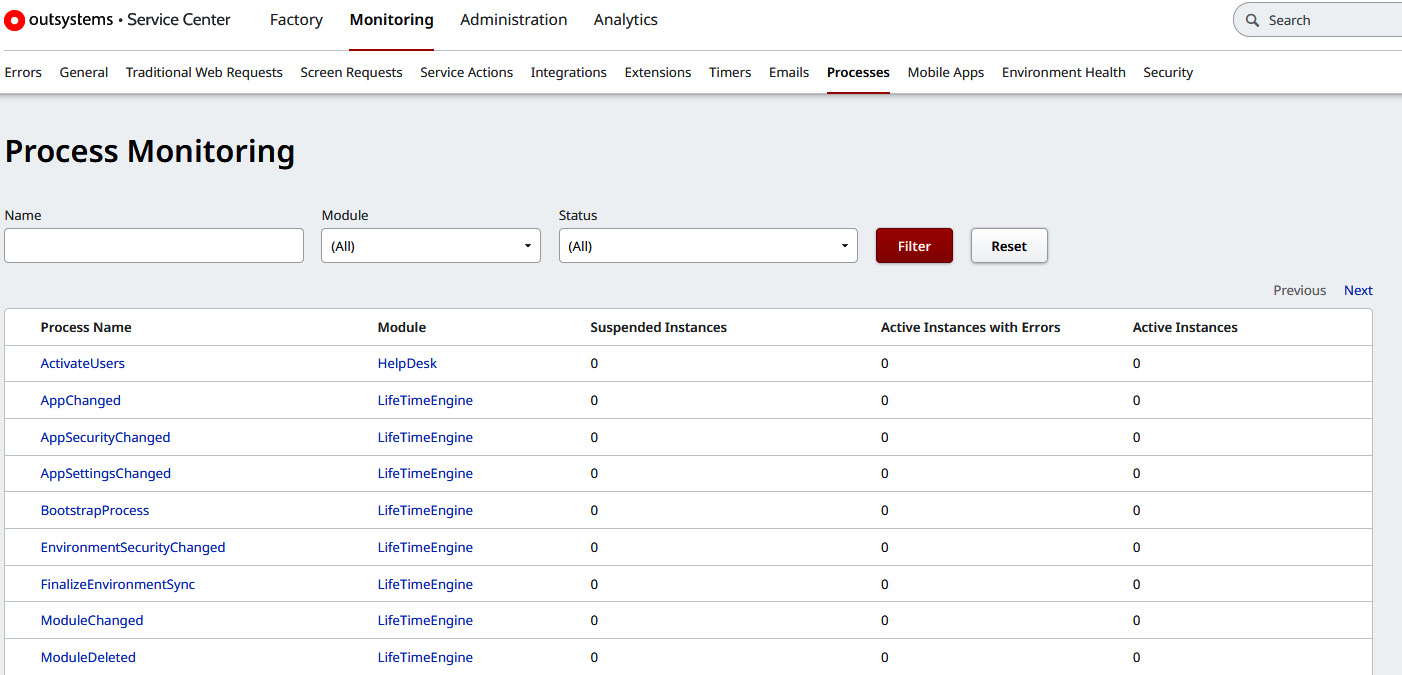
Figure 15.23 –Processes monitoring tab in Service Center
On this page, we can check the following fields:
- The name of the Process
- The module to which the Process belongs
- How many instances are suspended
- How many instances are active with errors
- How many instances are active
When we click on the name of the Process, we are directed to a page that shows us the details of that Process, which instances have taken place and are taking place, along with their status.
Also, on this page we can lock the Process, preventing further activities from occurring.
If the Process is already locked, the Unlock functionality is available.
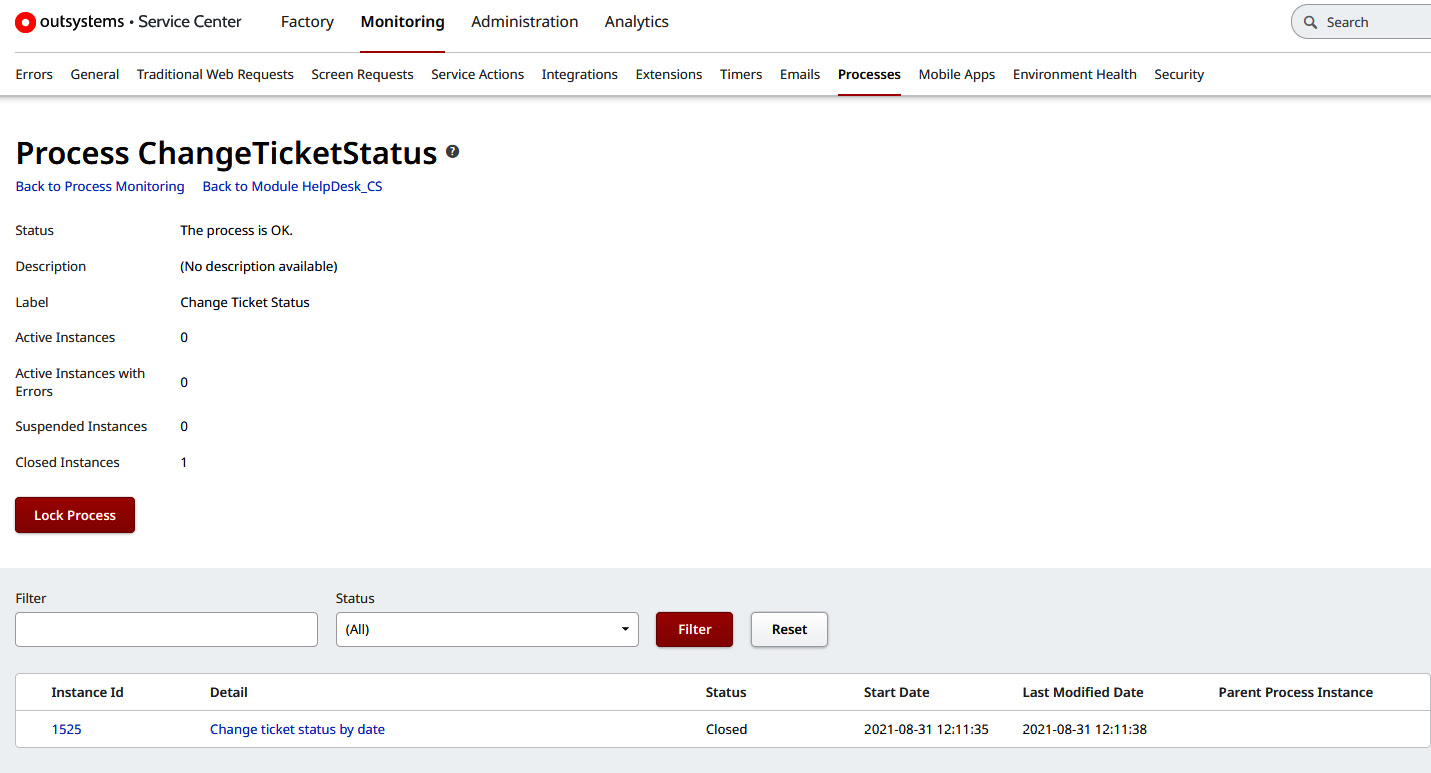
Figure 15.24 – Process detail in Service Center
If we click on an instance of a Process in the table on a Process's detail page, we can follow the entire event history of that instance, including what activities occurred, when they occurred, and what their status was. In addition, here is an example of the information of the Process instance identifier generated in the database:
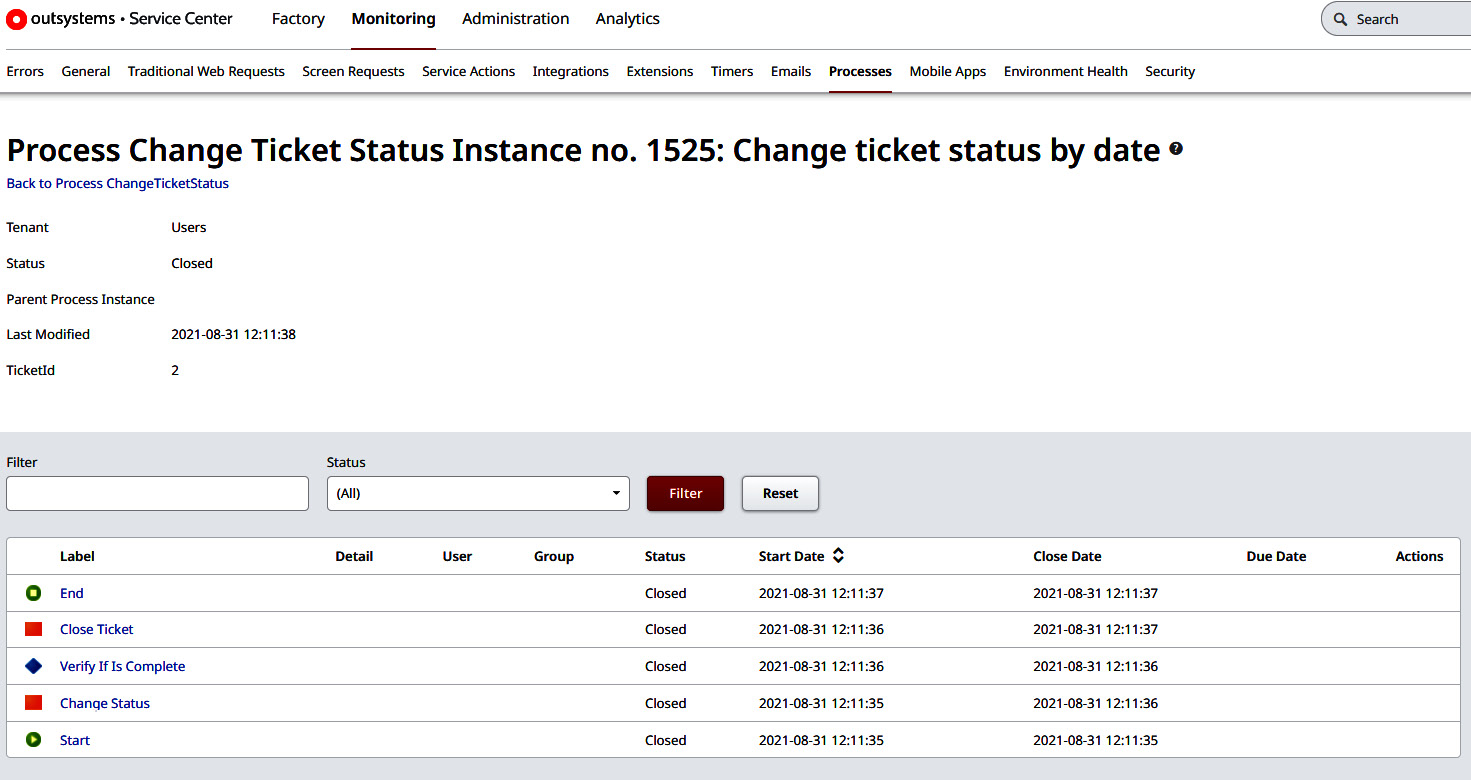
Figure 15.25 – Example of instance details in Service Center
Worthy of note here is that if any Process generates an error, we can visualize in which instance and activity it occurred by consulting the pages we've covered here. Errors generated in the application logic executed by the Processes are logged in the Errors tab of the monitoring section.
In order to add more monitoring capability, OutSystems' R&D team created an application called Business Activity Monitoring, available for download from OutSystems Forge at https://www.outsystems.com/forge/component-overview/132/business-activity-monitoring.
The monitoring capability can go even further in the case of custom logs, since we can always use the LogMessage server action in our code to generate logs adapted to the scenarios we are developing, therefore allowing for more effective monitoring.
We can see that in terms of monitoring, asynchronous Processes follow the same method as the rest of the platform (apart from the specificity of the BPT technology), always following a very transversal path of checking the logs and generated information related to BPTs and Timers.
Summary
In this chapter, we had an overview of how BPTs and Light BPTs work, as well as how to implement each of these models.
We also saw the functioning of Timers and their implementation.
Furthermore, we realized that all of these three models are asynchronous activities, that is, they do not occur at runtime; rather, each of them requires a trigger to run.
We detailed the main differences between them and what their purposes are, and got a brief idea of some scenarios in which each one of them should be used.
In the final part, we saw how we can monitor Processes and Timers in Service Center and what information is available to us.
The purpose of this chapter is to highlight that we do not need to process all the information in real time if this is not necessary, thus improving our control of Timers and Processes life cycles, performance, and data robustness.
The asynchronous capabilities of the platform were left to the end of this book because it is a more complex topic, and also because the tools explained here are the target of continuous improvement and optimization, both by developers and by OutSystems itself.
I hope this book has given each of you the motivation, foundational knowledge, and context to start your career in OutSystems (for those who are starting now), along with the necessary clarification of your doubts about any topic even if you're already working with OutSystems.
I always advise doing some additional reading of the OutSystems documentation (https://success.outsystems.com/Documentation), as well taking their online courses (https://www.outsystems.com/training/paths), which are full of objective, high-quality information.
May it be the beginning of something good, and I hope I have contributed to your journey of becoming a Jedi!