No matter what business you are in, regardless of whether you are a "Not for Profit", "For Profit", or "No Profit but Want to Make a Profit" organization, you need cash to operate; no exceptions. You need cash to pay your staff, buy office supplies, buy inventory, rent your office space, pay utilities, and so on. We could write a list with hundreds of items on it for which we need cash. How closely do you monitor your cash? How often do you reconcile your account with the bank? If cash is the "life source" of our businesses, we need to keep close tabs on it with bank reconciliation.
Many years back, before safe pay (GP module) and positive pay (bank service) were popular, a company that used GP found a fraudulent activity while reconciling the bank account. An employee at the company was changing the amounts on the check before cashing the checks. This was found quickly as the company reconciled that bank account every week. What if they had waited until the end of the month, or worse, didn't reconcile at all? How long would it take for you to find this kind of discrepancy? Cash is too important to all businesses for it to be ignored.
What we will build:
- Bank balances with the last reconciliation date
- Where the money goes
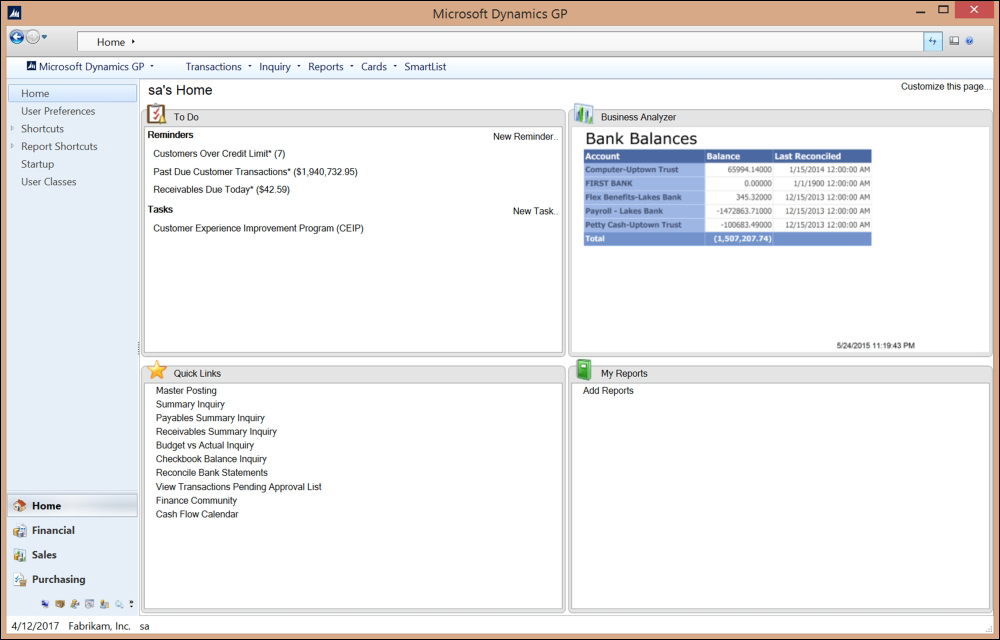
The first report we will build is bank balances with the last reconciliation dates.
This report is for all companies. All companies have bank accounts, therefore, all companies need to know how much money is in the bank.
Every manager and business owner needs to see how much cash is in the bank. Usually, this person is not the one who is responsible for reconciling the bank accounts to the bank, so I would like to add the last reconciliation date (not the date it was actually reconciled, but the date it was reconciled through).
We realize there is a very nice Business Analyzer report that shows the cash position compared to previous periods. We really like this report, but it does not show us when the bank account was last reconciled, nor does it give us a breakdown of how much cash is in each bank account.
For this report, we choose to use SQL Report Builder 3.0, so we will access this report in Microsoft Dynamics GP Business Analyzer.
There are two parts to these steps. The first part is technical, containing steps that involve work in SQL Server. The second part is the actual building of the report. You may choose to obtain assistance with the technical part, especially if you do not have access to SQL Server.
We have warned you before: This first part involves working in SQL Server. If you are not experienced in working on Microsoft SQL Server, request help from your IT department or ask your Microsoft GP partner to assist you. You can corrupt your data and completely break your system if you are not careful. You should also have an appropriate SQL Server password.
- This entire report is a great introduction to build reports in SQL Server Reporting Services. We are using the Report Builder rather than Visual Studio, so the nontechnical steps are only minor league programming.
- Download the most recent version of SQL Report Builder for your version of SQL Server. You can find it by searching Bing with the phrase SQL report builder download.
Let's prepare and connect to the data
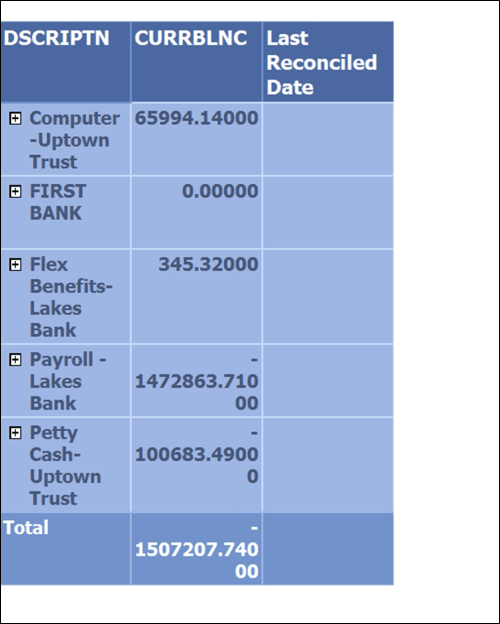
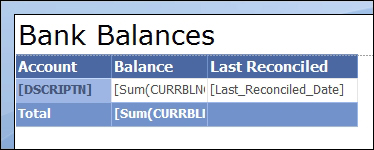
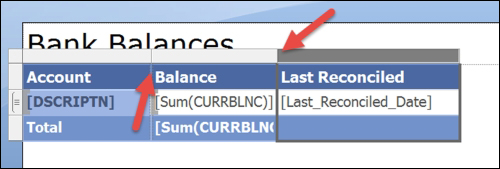
Know what you want. We've already completed this step, as shown in the following screenshot:

Tip
As always, we must know what we want our end result to look like before we start. Draw it on a paper or perform a mock-up in Excel. Starting with the end in mind will save you many, many hours of time. We'll say this over and over again because it's that important! The preceding screenshot is what we want our report to look like.
Let's make a connection to the GP data:
- We'll start by opening SQL Server Report Builder 3.x (it should have been downloaded for you in the Technical Matter steps).
- When you first open Report Builder, the New Report or Dataset window will open. If it does not open, click on the Report Builder icon in the top-left corner of the ribbon and select New to open it:
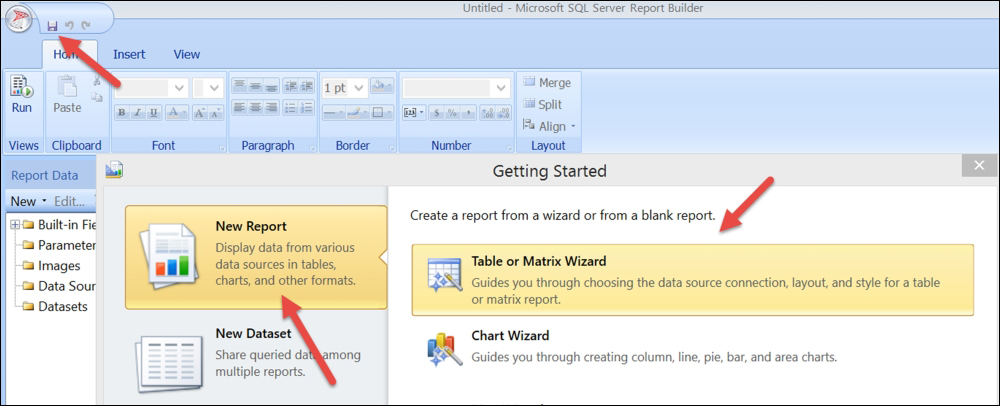
- In the New Report or Dataset window, select New Report, and then select Table or Matrix Wizard.
- The next screen is to choose a dataset. The Create a dataset option is marked by default. Click on Next.
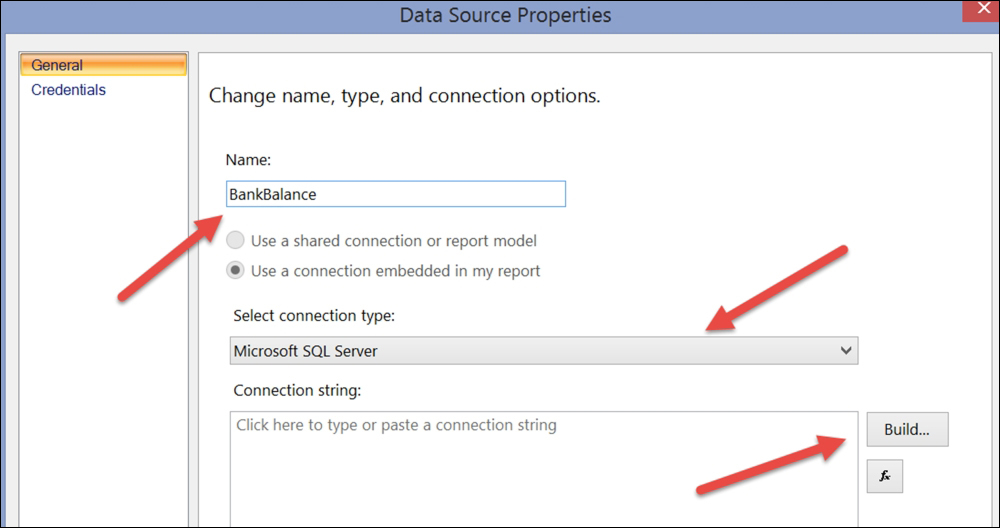
- The next screen is to choose a connection to a data source. Click on the New button, and the Data Source Properties window will open.
- Give this data source the name BankBalance, keep the connection type Microsoft SQL Server, and click on the Build button:
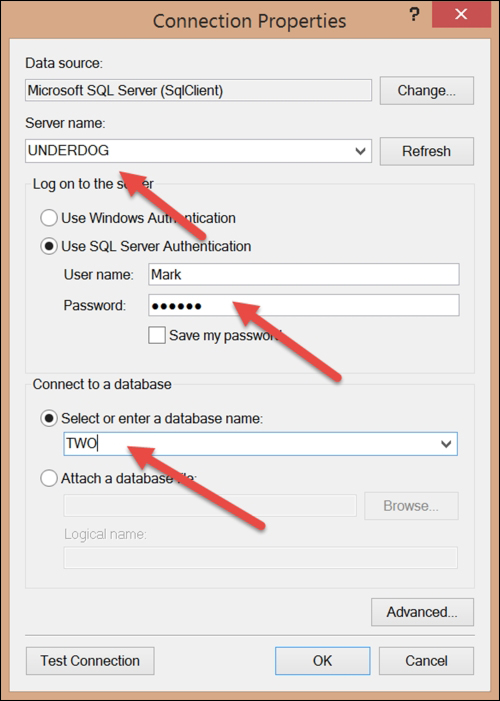
- Then, the Connections Properties window will open.
- Enter the name of your Microsoft SQL Server, your GP user ID as the User Name along with the GP password, and the database that this report is for. Then, click on OK to close the Connection Properties window:
- Click on OK to close the Data Source Properties window.
- Click on Next in the New Table or Matrix window.
- On the Enter Data Source Credentials window, enter your Network or AD login and password, and click on OK.
- We are now prompted to Design a query. Fortunately for us, all the information we need is included in a view that Microsoft includes with Dynamics GP, so it is just a matter of selecting the correct view. Click on the plus sign next to Views in the Database View pane, find CM00500, and select it by checking the box:

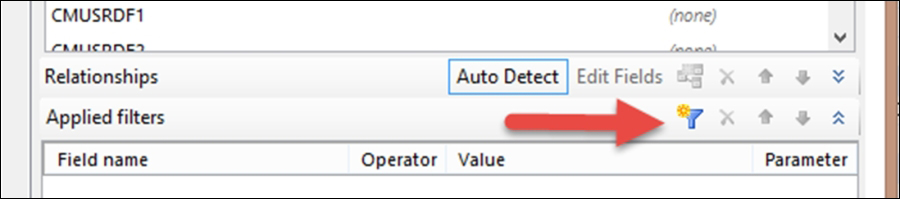
- Now that we've selected the view, we want to make sure that only active bank accounts appear on our report, so we'll need to enter a filter. Click on the add filter icon, and the first field will show up in the Applied filters pane:
- Now we'll need to edit the filter, as we want to filter on a different field. Click on the field name, in this case it is CHEKBKID, and a drop-down list will appear:
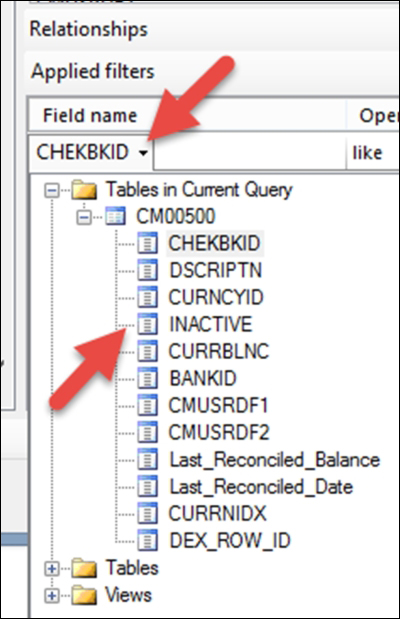
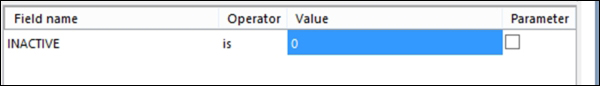
- Select INACTIVE and the drop-down list will be closed. Make sure the Operator value remains as is, and click on the Value field and enter a 0. Here, "0" means active and "1" means inactive. Click on Next and the Arrange fields window appears. Click on Next to close the New Table or Matrix window:
Let's build the Report:
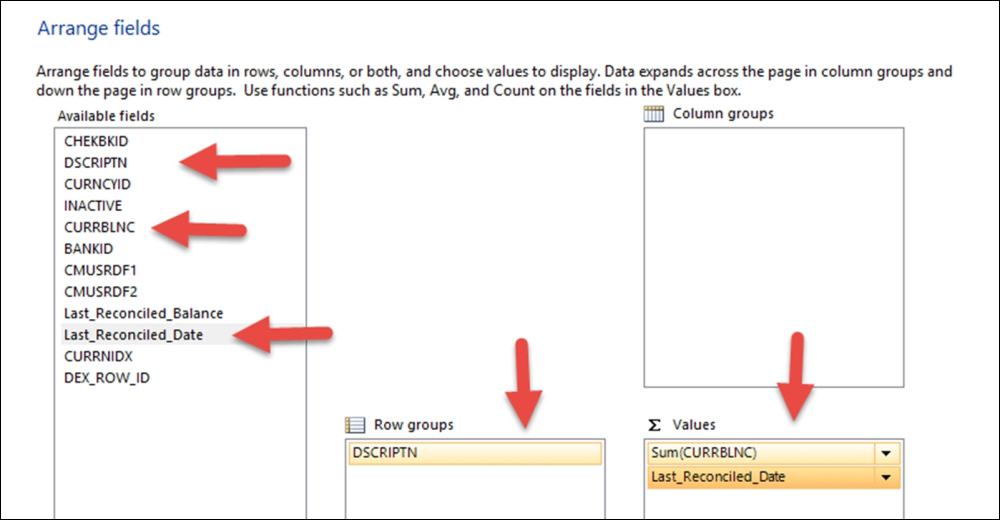
- Drag DSCRIPTN to Row groups and both CURRBLNC and Last_Reconciled_Date to the Values area. CURRBLNC in the Values area will appear with Sum() on it and that is fine. Click on Next:
- On the Choose the layout window, change nothing, leaving Show subtotals and grand totals and Expand/collapse groups checked. Leave the Blocked, subtotal below option marked. Then, click on Next.
- The Choose a style option is about fonts and color schemes. Feel free to change it for your report. We're leaving the default of Ocean selected. Then, click on Finish.
- Time to save your work. Click on the Save icon in the top-left corner. For now, save it as you would do with an Excel file.
Let's edit and format the report:
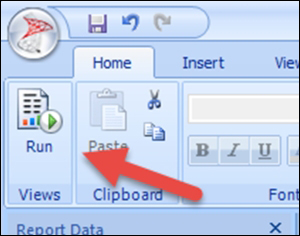
- Now that we've connected the data and started building, let's take a look at what the report looks like so we know what formatting we need or want to do. In the top-left corner, click on the Run button. When prompted, enter your GP user ID and password:
- Your report should look like the following screenshot:
- There is a lot wrong with this report: we have no title, the column headers are not easy to read, the fields are not formatted correctly, and the date does not appear unless we open the account by clicking on the + sign. To fix these items, click on Design at the top-left corner, and we'll be back to the pasteboard (or the report design area).
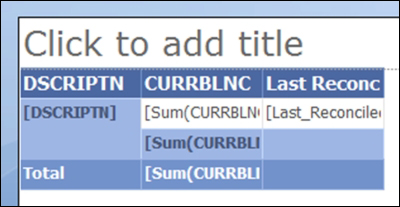
- Where it reads Click to add title, click on it and enter Bank Balances and press the Tab key:
- Double-click on the DSCRIPTN column header and enter Account and press the Tab key:
- Click on the CURRBLNC column header and enter Balance. Click on the Last Reconciled Date column header and remove the word date at the end.
- Save the file as a precaution by navigating to File | Save.
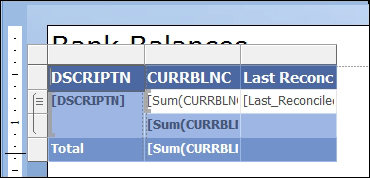
- Click on the row between DESCRIPTN and Total, right-click and delete row. It should now look like the following screenshot:
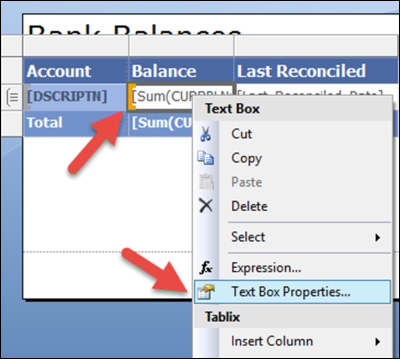
- Right-click on the Balance field in the body of the report and choose Text Box Properties:
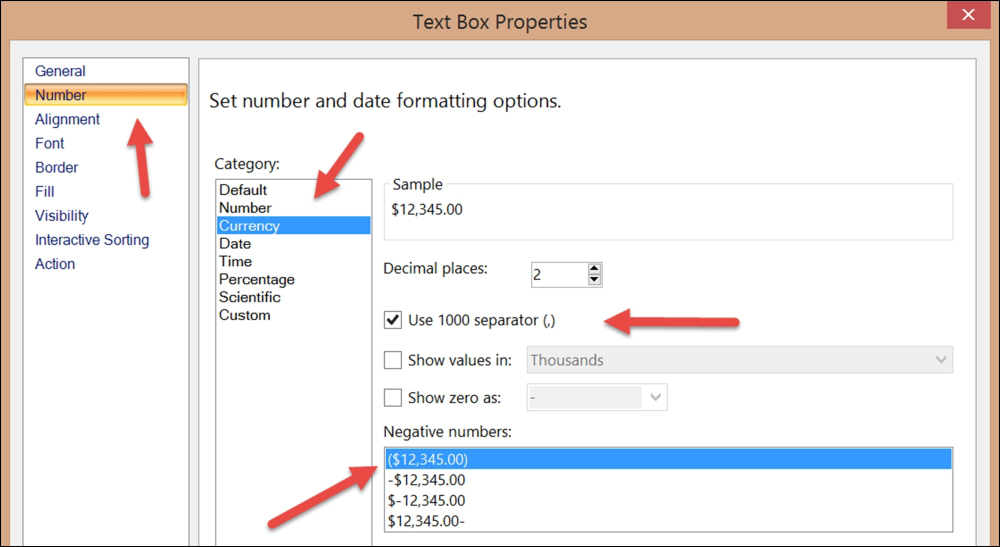
- In the Text Box Properties window, select Number, and then select Currency from the Category section. We want 1000 separator and our negative numbers to have ( ) around them. Click on OK:
- Right-click on Last Reconciled Date in the body and select Text Box Properties.
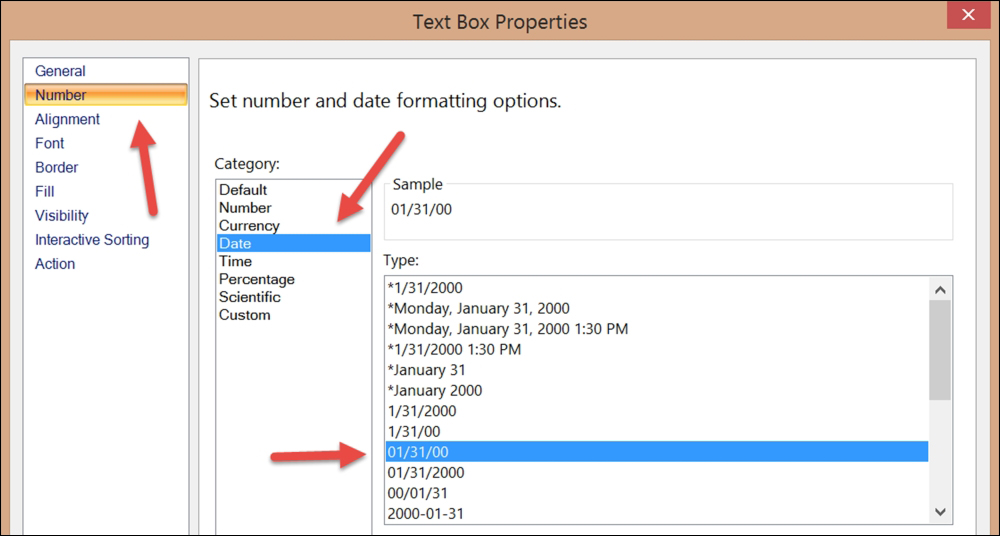
- In the Text Box Properties window, select Number, and then select Date from the Category section. Select the date format you like; we prefer XX/XX/XX. Click on OK:
- Right-click on CURRBLNC on the total line and repeat the preceding steps where you right-clicked and chose Text Box Properties, formatting as a currency.
- Save the file as a precaution by navigating to File | Save.
In theory, the report is complete. You may want to resize the fields in the body, depending on where you choose to deploy the report. We chose to make our columns wider and the print date and time larger and bold. We resized our fields by clicking on the table and then clicking on the line between the columns; resizing as we would in Excel. We changed the font of the print date by clicking on the [&Execution Time] field in the bottom-right corner of the report and then selected font options in the ribbon.
Format for use in Business Analyzer (GP reporting tool):
- Run the report again, as we did earlier, to determine what remains to be formatted:

- To format this report to display in the Business Analyzer tool or Dynamics GP home page, we'll first need to resize the report. Click on the Design button in the top-left corner to pull up the designer window again.
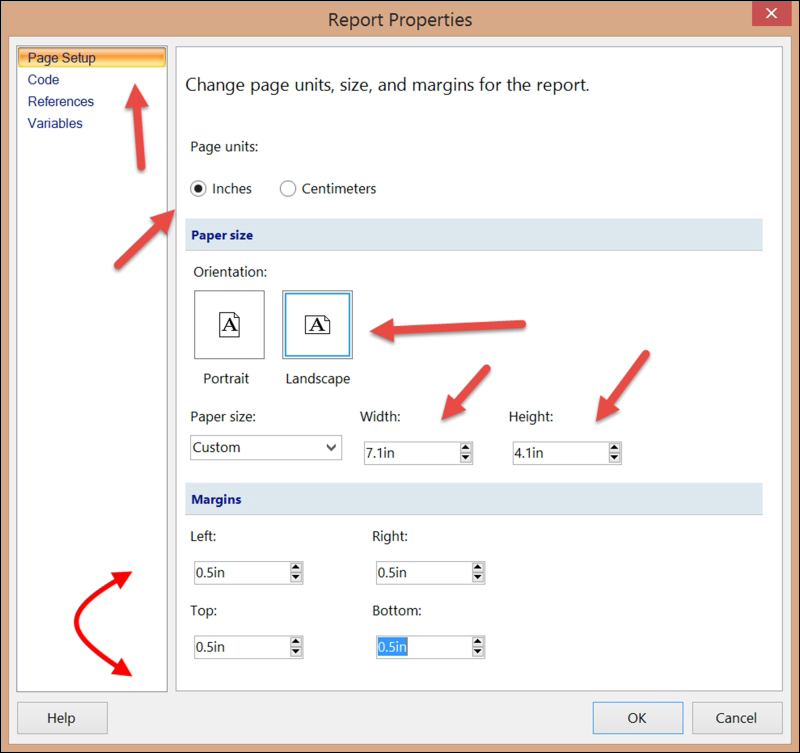
- Open up Property Pages in Report Builder. You'll find the icon in the Properties pane on the right-hand side of the screen:

- We set up our page as landscape with a width of 7.1in and a height of 4.1in, with a margin of only 0.5in on all sides. Failing to make adjustments like these will make the report appear very tiny and unreadable in Business Analyzer:
- This report is now ready to upload to your ReportServer, where you have your other Dynamics GP SSRS reports deployed: