
The same company from the previous sections needs to be able to review sales by their product manufacturer. This same BI reporting can be used for any information that is tracked in inventory categories.
This company sells all across the U.S., and sells products from a variety of manufacturers. They have a direct sales force, a physical showroom where customers can purchase in person, and a web presence where customers can place orders directly via their website.
They use inventory item category 1 to store the manufacturer of each item. This field is used because they can either purchase items directly from the manufacturer or a wholesale distributor. Although the vendors change, the item's manufacturer does not.
Some higher-end manufacturers require their customers to sell a certain amount of product(s) to maintain the privilege of selling their product(s). This being said, although monitoring sales by customers, salesperson, and individual items (or their item class) is important, we cannot ignore the need to monitor by yet another criteria.
The reason why class is not used here is that this company uses the item class to organize items by GL account numbers or common groups. An example of this: if we sold dairy products, we would group together yogurt as a class, even though we purchase yogurt from many manufacturers.
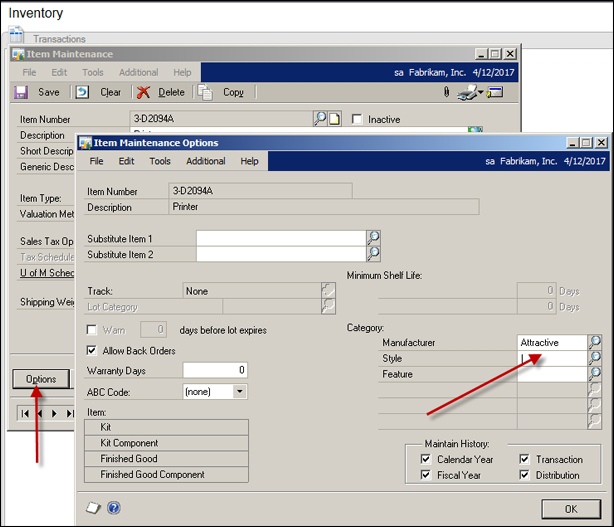
So, we use Item Category in the Item Maintenance Options window:
We will be using Excel and PowerPivot for this report as well. This information exists in the view we created previously, and can simply be added to the same Excel workbook as another worksheet. Every time the PowerPivot data is refreshed for the previous SOP reports, data for this report will be updated as well.
Because we've done the bulk of the work earlier in this chapter, we'll simply be building on that at this point.
If you created the previous two reports, then there is nothing to do here. We will be using the SQL view that includes the historical documents. If you did not create the previous reports, then you will need to create the SQL view as described earlier in this chapter.
Let's begin; connect and prepare the data.
Know what you want. We've already completed this step and have included a screenshot here:

Let's make a connection to the GP data:
- From the Excel menu bar, select PowerPivot. Then, select Manage from the ribbon.
- The PowerPivot for Excel – Book1 window will open. On the PowerPivot menu bar, select From Database in the Get External Data area of the ribbon. On the drop-down menu, select From SQL Server.
- The Table Import Wizard window will open. Perform the following steps:
- In the Friendly connection name field, enter TWO01_SOP_TRX (replace TWO01 with your company's database name). This was identified previously. You can also create an entirely new name. The goal here is to identify the database and view being used. Since we are using the view that has both Open and History, we are just using TWO01_SOP_TRX; if you are using the view for only the History transactions, you may want to use TWO01_SOP_HistTRX.
- In the Server name field, enter your server name, which has also been identified previously.
- Select the Use SQL Server Authentication button and enter your SQL/Network or AD login ID and password.
- In the Database name field, enter your company's database name (the same that you used previously).
- Click on Next.
- In the Table Import Wizard – Choose How to Import the Data window, select the button for Select from a list of tables and views to choose the data to import. Then, click on Next.
- In the Table Import Wizard – Select Tables and Views window, select the view you created that shows historical documents named View_BI_SOP_DOCS or View_BI_SOP_HISTDOCS.
- If you are using View_BI_SOP_DOCS, let's go ahead and filter out the open documents before bringing the data into PowerPivot. Then, click on Preview & Filter:

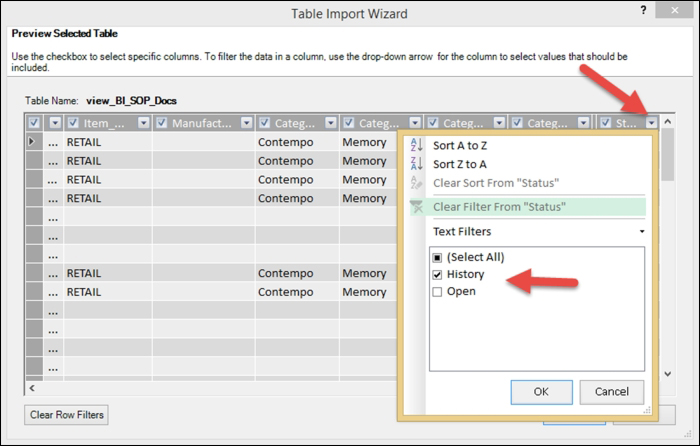
- The Table Import Wizard – Preview Selected Table window will open. Scroll to the far right and choose the filter option for the last field named Status. Unselect the option for Open, so only History records will remain. Then, click on OK twice to close both windows. If you are using the view with History only, skip to the next step:
- Click on Finish to close the Table Import Wizard, and import the data into PowerPivot. Then, click on Close.
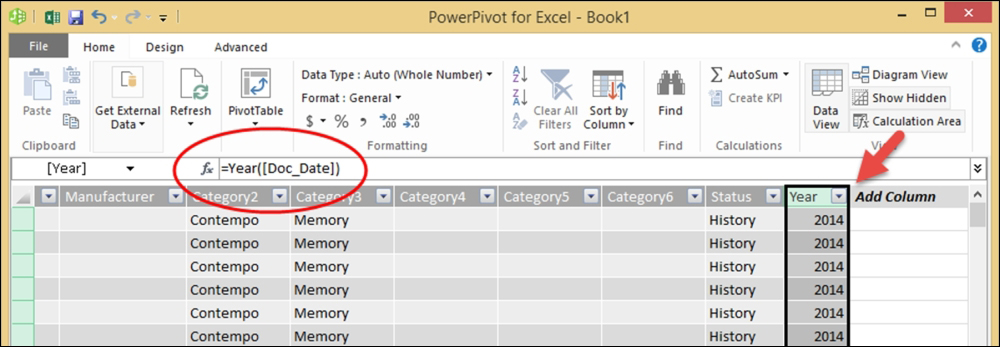
- Scroll all the way to the right-hand side in the PowerPivot for Excel window. The header of the first blank column will be labelled Add Column. Click in the first blank cell of this empty column. In the address line, type the following command:
=YEAR([Doc_Date])After you enter =Y, you'll see the command for YEAR appear. Click on the down arrow to highlight, and press the Tab key to select or manually enter it. Then, as soon as you enter [D, the same will happen for Doc_Date. Do not forget ) at the end! After you finish the command, press the Enter key. The formula will both calculate and copy for every record (row) in PowerPivot.
- Double-click on the field that reads Add Column and change the column name to Year:
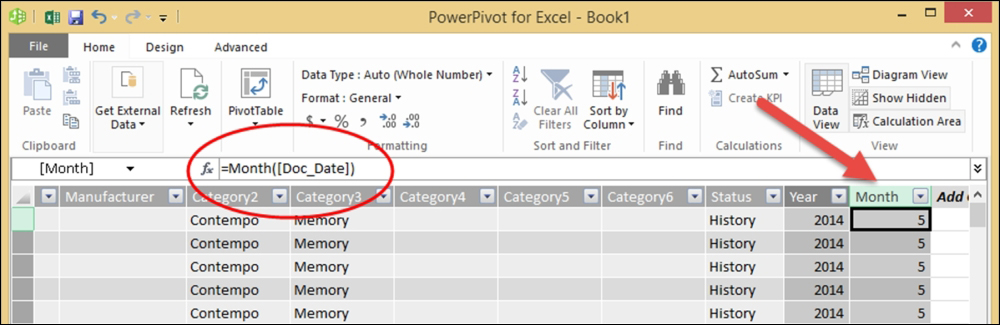
- Click in the first blank cell of the next empty column. In the address line, type the following command:
=Month([Doc_Date])After you enter =M, you'll see the command for MONTH appear. Click on the down arrow to highlight, and press the Tab key to select or manually enter it. Then, as soon as you enter [D, the same will happen for Doc_Date. Do not forget ) at the end! After you finish the command, press the Enter key. The formula will both calculate and copy for every record (row) in PowerPivot.
Double-click on the field that reads Add Column and change the column name to Month:
Let's build the first PivotTable report:
- From the PowerPivot for Excel window, select PivotTable. If you click on the icon, you will now get the drop-down list. From this list, select PivotTable:
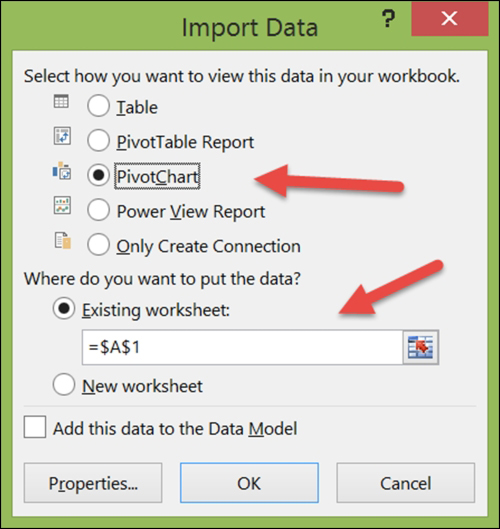
- When the Insert Pivot window opens, select New Worksheet. Then, click on OK.
- Save the file as a precaution; navigate to File | Save.
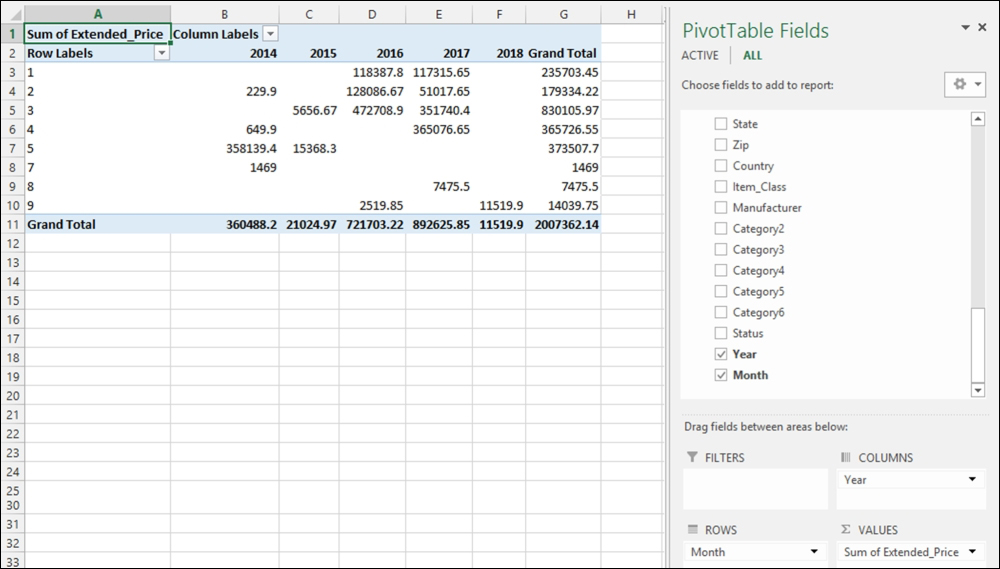
- On the PivotTable Fields list, open the view to see the fields.
- Scroll to the bottom and you'll see the two new fields we just created in PowerPivot. Add Year to the COLUMNS area, Month to the ROWS area, and Extended_Price to the VALUES area.
- Format the values to represent currency, as we did in previous examples:
- Click on the PivotTable, and then on the ANALYZE tab in the PivotTools section of the Excel menu bar. On the Excel ribbon, in the Tools area, select PivotChart.
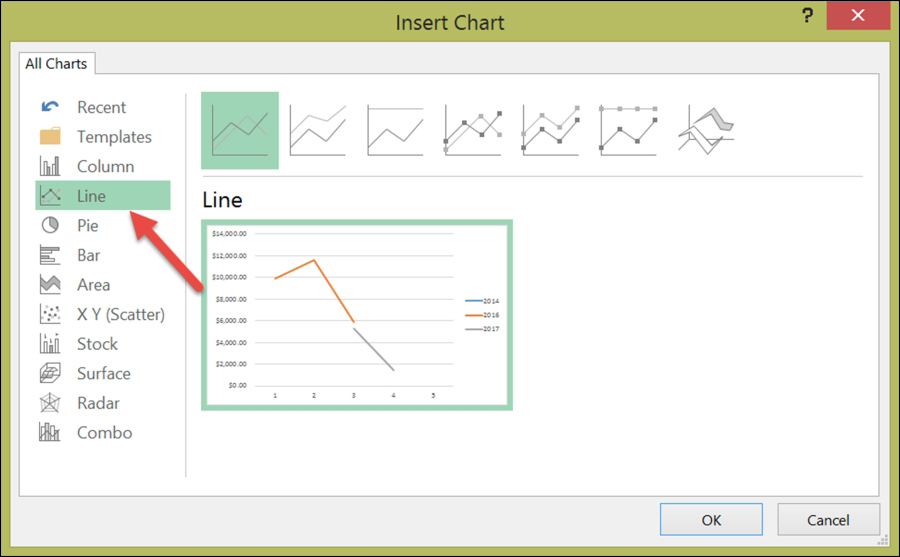
- When the Insert Chart window opens, select the Line chart and click on OK:
- Click on the PivotTable, and then click on the ANALYZE tab in the PivotTools section of the Excel menu bar. On the Excel ribbon, in the Filter area, select Insert Slicer.
- When the Insert Slicers window opens, select the box for manufacturer and click on OK.
- Drag the chart, table, and slicer around until they are organized as you desire. Add a logo if you like.
- We edited our styles and colors and ended up with the following as our final result:
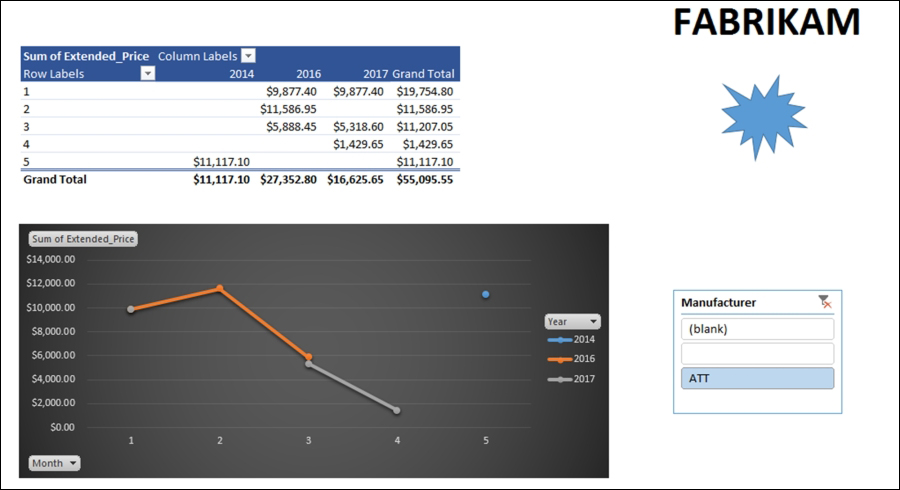
By monitoring the sales by manufacturer on a monthly basis, this company can make sure that they are achieving minimum sales requirements, and it allows them to spot trends to take advantage of marketing dollars. An interesting use of this would be to replace sales information with gross profit, and year with manufacturer. Then, you could see which products are making you the most money and when are you making it.