
In theory, inventory adjustments and variance transactions should never need to be done except for occasional damaged item. The reality is that most users of the inventory control module make adjustments on a regular basis. Even the stock count feature generates variances for discrepancies between the actual count and the count in GP. If everything were entered completely correctly, with no timing issues (for example, an item being shipped between the time the stock count report was created and the user counted the stock), GP would always be completely accurate and completely in balance with the General Ledger. Unfortunately, we live the real world, where stuff happens and people get sidetracked and make mistakes.
Microsoft Dynamics GP introduced Reason Codes in GP 2013. These reason codes enable GP users to explain why an adjustment or variance is made, even using different GL account numbers to record the entry.
Since we end up making adjustments and we can now track the reasons for these adjustments, we should look at entries and see whether there is any information we can obtain. We'll be looking for anything that costs us more than it should and/or revenue opportunities.
This report is for a distribution company that sells big-ticket items. These are low-margin items (about 20 percent), so if they lose a single item, they will have to sell four more just to break even.
The owner has noticed that there are a lot of inventory adjustments, both increases and decreases. It has been difficult to tell whether these result from items being shipped while counts are occurring, or some items are slipping out the back door. We use a two-step approach to get a better handle on the inventory. First, we identify the items that have the most adjustments. Then we perform more frequent inventory counts for those items.
We will be using a basic PivotTable to access the data directly from GP. A timeline filter will be used to allow us to select a single period or a range of periods.
There are two parts in these steps. The first part is technical, containing steps that involve work in SQL Server. The second part is the actual building of the report. You may choose to obtain assistance with the technical part, especially if you do not have access to SQL Server.
Create the following view in SQL Server:
CREATE VIEW View_BI_Inv_Adj As
SELECT dbo.IV30300.DOCTYPE,
 RTRIM(dbo.IV00101.ITEMNMBR) AS Item_Number,
 RTRIM(dbo.IV00101.ITEMDESC) AS Item_Desc,
 CASE IV30300.DOCTYPE
 WHEN 1 THEN 'Adjustment'
 WHEN 2 THEN 'Variance'
 ELSE 'Other'
 END AS Trx_Type,
 dbo.IV30300.DOCDATE AS Trx_Date,
 dbo.IV30300.DOCNUMBR AS Trx_Number,
 dbo.IV30300.TRXQTY AS Quantity,
 dbo.IV30300.UOFM,
 dbo.IV30300.TRXLOCTN AS Site_ID,
 dbo.IV30300.Reason_Code,
 dbo.IV30300.DOCNUMBR + 'IV30300LNSEQNBR' AS Trx_Key
FROM dbo.IV30300
INNER JOIN dbo.IV00101 ON dbo.IV30300.ITEMNMBR = dbo.IV00101.ITEMNMBR
WHERE (dbo.IV30300.DOCTYPE < 3)
GO
GRANT SELECT ON View_BI_Inv_Adj to DYNGRP
Know what you want, draw it, and create your requirements.
Let's establish a connection to the GP data:
- Open a Blank workbook in Excel. From the menu bar, choose DATA. In the Get External Data portion of the ribbon, choose From Other Sources. Then choose From SQL Server as the source.
- Enter your Server name and network or AD login credentials. Click on Next.
Tip
Here's a reminder: the GP login credentials are the user name and password you use to log in to GP. If you are not a GP user, you'll need a security set up for yourself in SQL Server. See the technical part of the first report in Chapter 2, Business Intelligence for the General Ledger for more details.
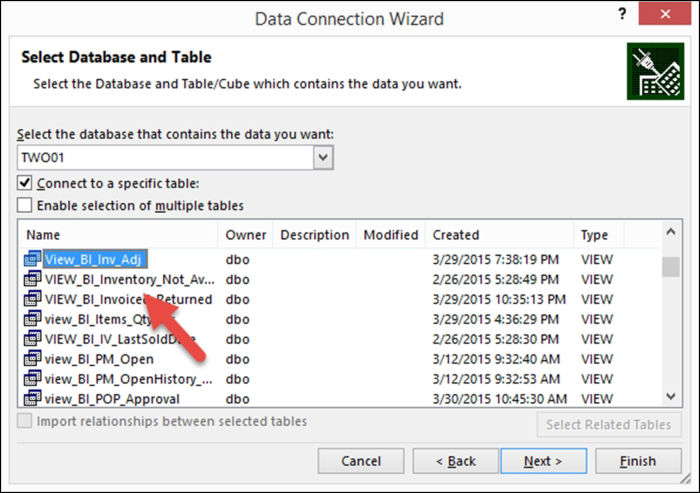
- Select your database from the drop-down list. Select view_BI_Inv_Adj. Then click on Finish:
- On the Import Data window, select PivotTable Report. Make sure that you are putting the data in the Existing worksheet option in the =$A$1 cell. Then click on OK. The PivotTable canvas will appear.
Let's build the foundation of our PivotTable report:
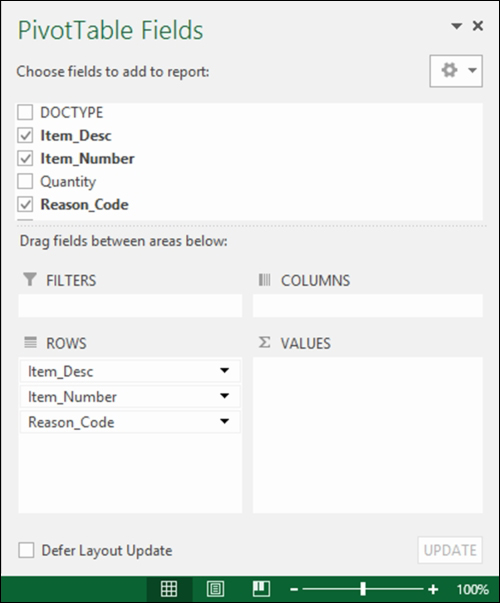
- In the PivotTable Fields list on the right, drag the following fields into the ROWS area: Item_Number, Item_Description, and Reason_Code:
Tip
We are putting Reason_Code in our table; you could put it in a slicer, as we'll do with the type (adjustment or variance), if you want to easily and frequently change the report to show by Reason Code.
GP 2013 had a new feature: adding a Reason or Reason Code to make an inventory adjustment or variance. If you have an inventory, this is worth the upgrade alone.
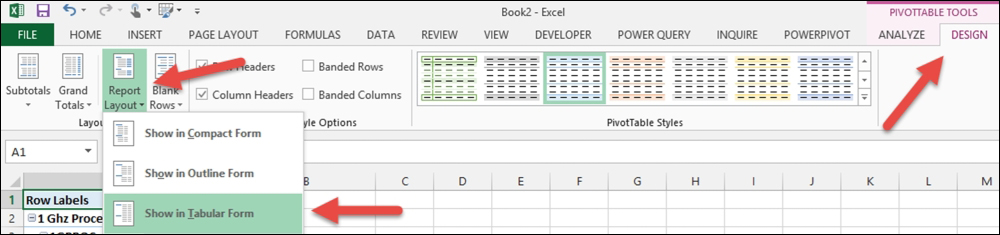
- In the Design tab under PIVOTTABLE TOOLS, choose Report Layout in the Layout section of the ribbon. Select Show in Tabular Form:
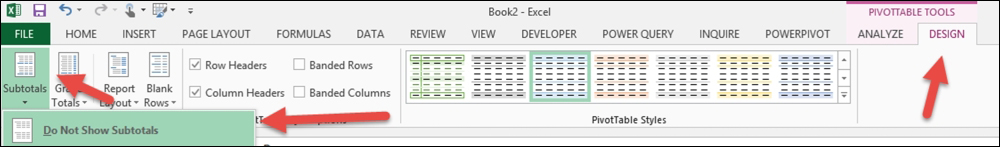
- In the Design tab under PIVOTTABLE TOOLS, choose Subtotals in the Layout section of the ribbon. Select Do Not Show Subtotals:
- In the PivotTable Fields list on the right, drag the Quantity and Trx_Number fields into the VALUES area:
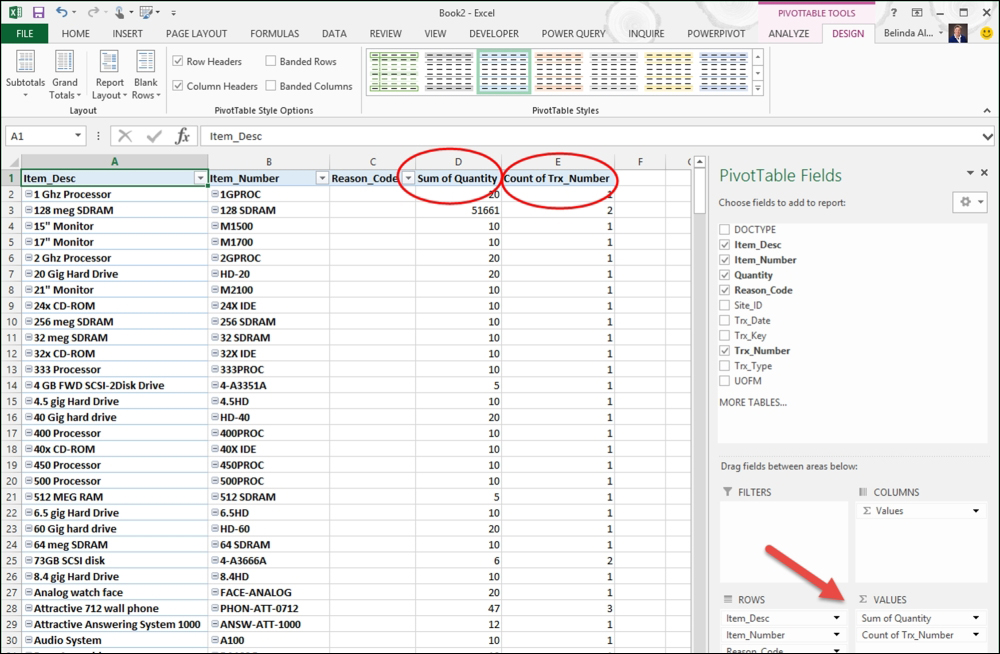
- Quantity should appear in the PivotTable as a sum, while Trx_Number should appear as a count. If these are not correct, we can correct them when formatting the fields.
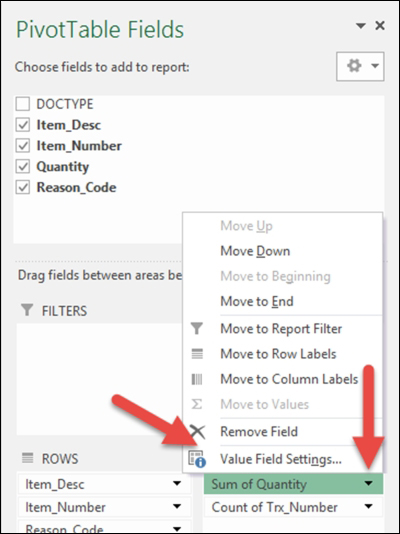
- In the PivotTable Fields list, in the VALUES area, click on the drop-down list for the Quantity value. Select Value Field Settings:
Tip
Quantity is the actual number of items that were adjusted, while Trx_Number represents each occurrence of the adjustment. Trx_Number is a unique string field (a text field even if it contains only numbers). By counting this field, we can know how many adjustments were made, regardless of how many items were adjusted.
- In the Value Field Settings window that opens, make sure that Sum is selected as the Summarize value field by option. Click on Number Format. The Format Cells window will open. Change Category to Number. Select how you want your values to be displayed, and then click on OK for each window to close it.
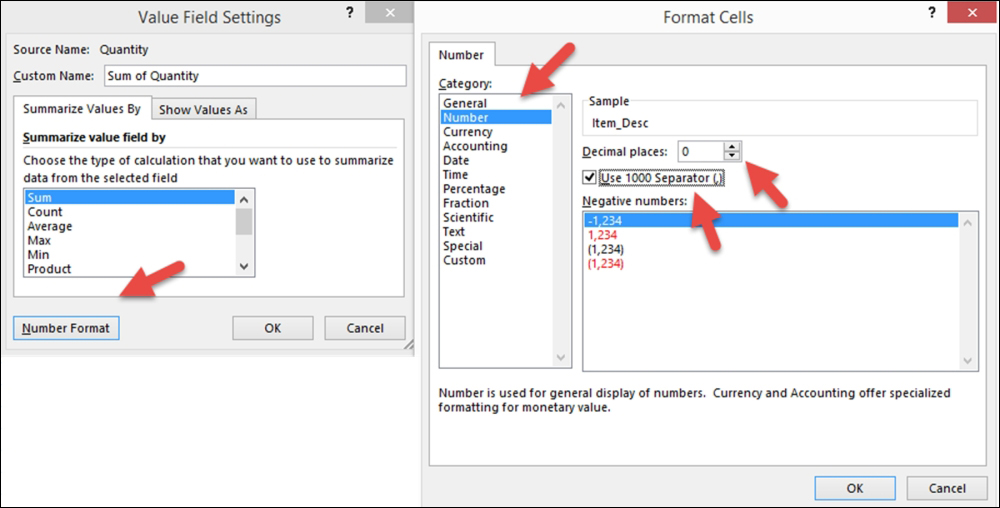
- If Trx_Number is not set to Count, change Value Field Settings for that value as well.
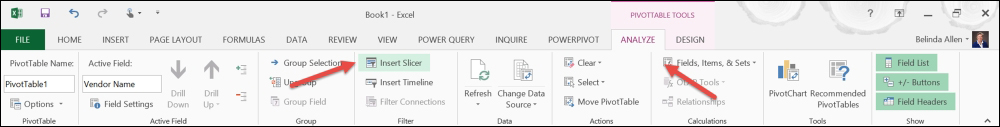
- On the ANALYZE tab under PIVOTTABLE TOOLS, choose Insert Slicer in the Filter section of the ribbon:
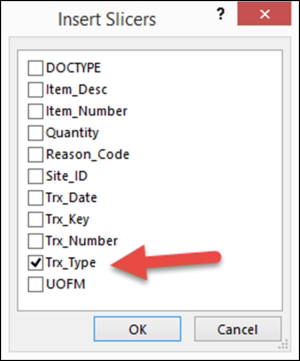
- In the Insert Slicer window, select the checkbox for Trx_Type. Then click on OK:
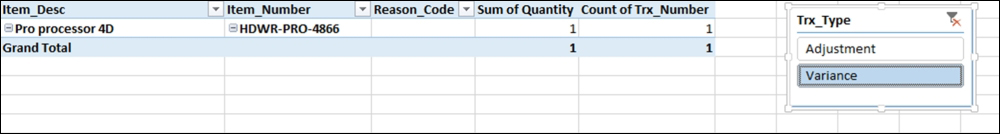
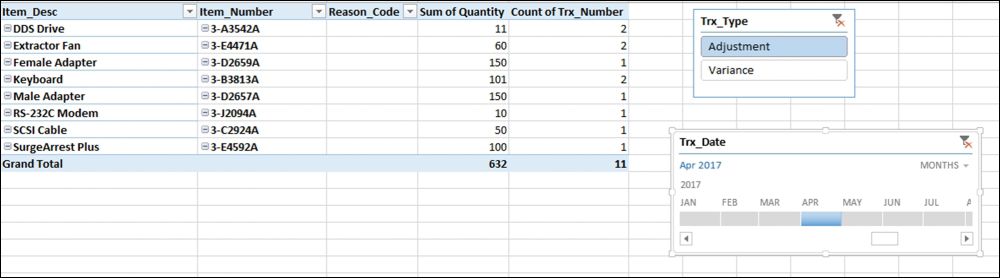
- Drag the slicers to the right of your PivotTable. You can shrink a slicer by clicking on the handle and dragging it over empty space:
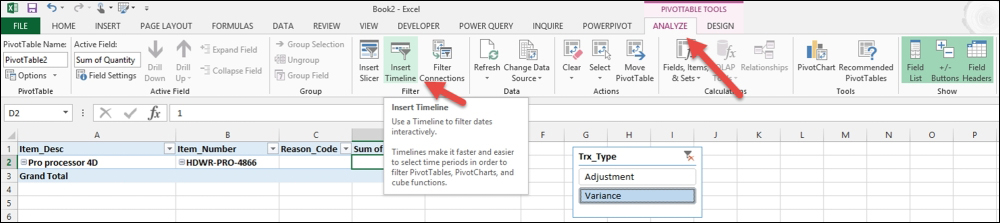
- Another addition you may want to make is a Timeline filter on the report. The report will calculate for whatever time period you select. On the ANALYZE tab under PIVOTTABLE TOOLS, choose Insert Timeline in the Filter section of the ribbon:
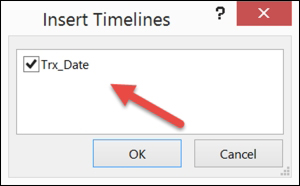
- In the Insert Timeline window, select the checkbox for Trx_Date. Then click on OK. Note that this window will only give you options for date fields:
Now your report can be pulled using date filters and/or transaction type filters.
- Another powerful option might be to add an inventory site (Site_ID) as a slicer:
- Add a logo and any text you like. To refresh the data from GP, click on Refresh All under the Data tab.
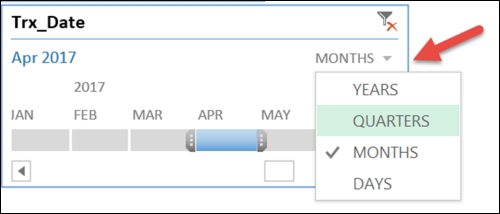
An easy variation of this report has Timeline set in YEARS:
- Add a slicer for Reason_Code and remove it from ROWS.
- Remove Trx_Number from VALUES.
- Add Trx_Date to COLUMNS.
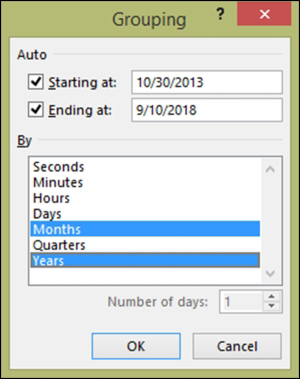
- Right-click on the first date in the first column and choose Group:
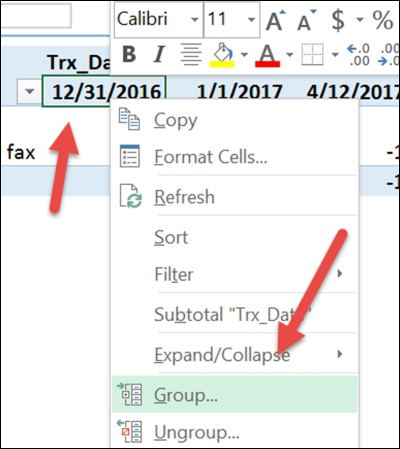
- In the Grouping window, click on Years, so both Years and Months will be selected. Click on OK:
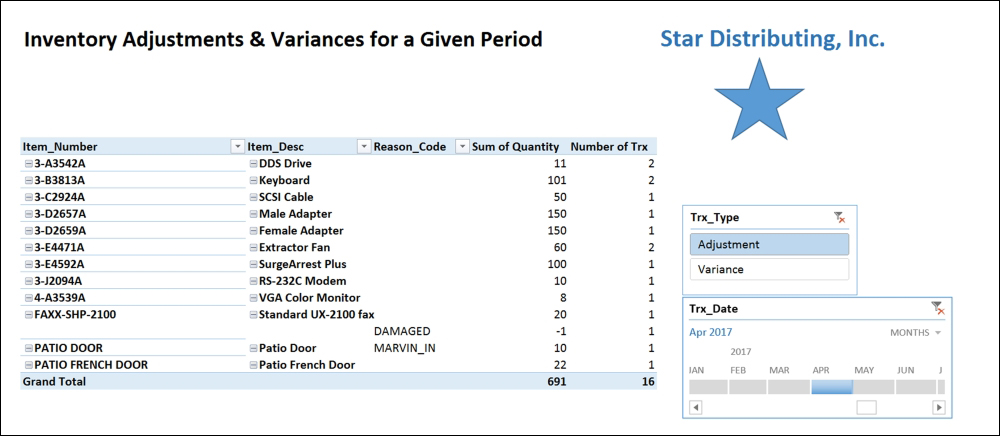
Our final report looks like this:

By using this report, this company can easily see which items are getting adjustments made and which quantity is being changed. In the final report, we can see that there are three damaged items from 2016 and 2017 adjusted. Is this normal for these items? Did we return them to our suppliers for a credit or did we break them? So many questions, so little time!