
This chapter is all about creating reports to make managing inventories easier. We've seen that companies with incorrect inventory on the books face a significant loss or gain in the accounting numbers when the inventory valuation is corrected. The impact is not only on taxes but on the appearance to lending institutions as well. They might believe that perhaps, your business is not being as well managed as it could be. Fortunately, you can avoid this type of situation by knowing when your inventory changes and why.
The name of this module is inventory control. It's meant to help you take control of your inventory. It is not called Inventory "Set It and Forget It". As inventory managers, control is critical, as both the Sales Order Processing module and the Purchase Order Processing module can affect your inventory with increases and decreases. If those users make an error, it affects your quantities and valuation.
There is no magic pill for managing inventory. It takes consistent and regular monitoring. When done right, it provides a wealth of information that can help you make decisions that result in more profitability.
We will build the following reports in this chapter:
- Rolling 12-month turnover report
- Items on which you most frequently adjust quantities
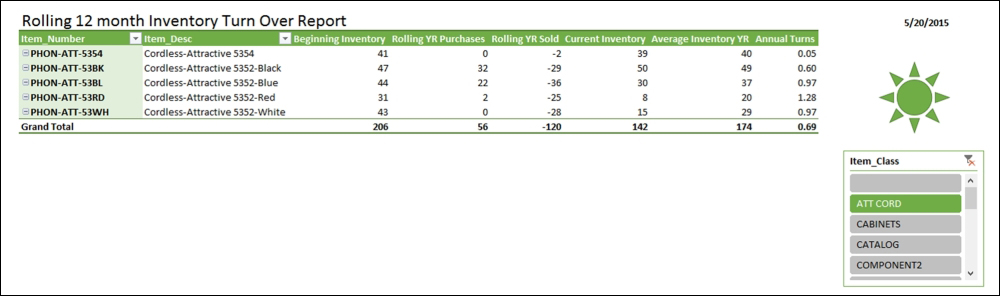
We all understand that too much inventory can tie up cash. To help improve cash flow while keeping enough inventory to fulfil orders, many companies use a turnover report to see how much cash they have invested in their inventory. This report can also review items in stock to help answer many questions, including some of the following: Are these items selling? Are they selling regularly throughout the year or more seasonally? Should we try to discount them to clear them out of the inventory and generate cash flow? Are the items with expiration dates selling fast enough to prevent write-offs and returns?
This report was built for a distribution company that sells food items. Although all the food items they sell are prepackaged with a long shelf life, they want to keep the product on their shelves for the shortest period of time they can so that their customers can keep them for a longer period of time.
Although GP has a nice turnover report right out-of-the-box, it only calculates YTD, so for the first couple of months of the year, the report is not as wide-ranging as they require. They would also like the warehouse manager to run this report, and currently he does not have access to GP.
There are two parts to these steps. The first part is technical, containing steps that involve work in SQL Server. The second part is the actual building of the report. You may choose to obtain assistance with the technical part, especially if you do not have access to SQL Server.
Create the following view in SQL Server:
Tip
For directions on creating a view, follow the technical matters step for the first report in Chapter 2, Business Intelligence for the General Ledger.
Create View view_BI_Items_Qty_Trx
as
SELECT dbo.IV00101.ITMCLSCD AS Item_Class,
 RTRIM(dbo.IV00101.ITEMNMBR) AS Item_Number,
 RTRIM(dbo.IV00101.ITEMDESC) AS Item_Desc,
 dbo.IV00102.QTYONHND AS Qty_On_Hand,
 dbo.IV00102.QTYINUSE + dbo.IV00102.QTYINSVC + dbo.IV00102.QTYRTRND + dbo.IV00102.QTYDMGED AS Qty_Not_Available,
 0 AS Qty_Purchased,
 0 AS Qty_Sold,
 0 AS Qty_Adjusted,
 0 AS Qty_Assembled,
 dbo.IV00102.LOCNCODE AS Site_ID,
 GETDATE() AS Trx_Date,
 'NA' AS Doc_Number,
 0 AS Line_Item_Seq
FROM dbo.IV00101
INNER JOIN dbo.IV00102 ON dbo.IV00101.ITEMNMBR = dbo.IV00102.ITEMNMBR
WHERE (dbo.IV00102.LOCNCODE <> ' ')
UNION
SELECT dbo.IV00101.ITMCLSCD AS Item_Class,
 RTRIM(dbo.IV00101.ITEMNMBR) AS Item_Number,
 RTRIM(dbo.IV00101.ITEMDESC) AS Item_Desc,
 0 AS Qty_On_Hand,
 0 AS Qty_Not_Available,
 CASE IV30300.DOCTYPE
 WHEN '4' THEN (IV30300.TRXQTY * IV30300.QTYBSUOM)
 ELSE 0
 END AS Qty_Purchased,
 CASE IV30300.DOCTYPE
 WHEN '5' THEN (IV30300.TRXQTY * IV30300.QTYBSUOM)
 WHEN '6' THEN (IV30300.TRXQTY * IV30300.QTYBSUOM)
 ELSE 0
 END AS Qty_Sold,
 CASE IV30300.DOCTYPE
 WHEN '1' THEN (IV30300.TRXQTY * IV30300.QTYBSUOM)
 WHEN '2' THEN (IV30300.TRXQTY * IV30300.QTYBSUOM)
 ELSE 0
 END AS Qty_Adjusted,
 CASE IV30300.DOCTYPE
 WHEN '7' THEN (IV30300.TRXQTY * IV30300.QTYBSUOM)
 ELSE 0
 END AS Qty_Assembled,
 dbo.IV30300.TRXLOCTN AS Site_ID,
 dbo.IV30300.DOCDATE AS Trx_Date,
 dbo.IV30300.DOCNUMBR AS Doc_Number,
 dbo.IV30300.LNSEQNBR AS Line_Item_Seq
FROM dbo.IV00101
INNER JOIN dbo.IV30300 ON dbo.IV00101.ITEMNMBR = dbo.IV30300.ITEMNMBR
WHERE (dbo.IV30300.DOCDATE > DATEADD(yy, - 1, GETDATE()))
GO
Grant select on view_BI_Items_Qty_Trx to DYNGRP
Guess what the first step is? If you guessed: "Know what you want", you are a winner! We've already completed this step, and have included a screenshot here:
Let's establish a connection to the GP data:
- Open a Blank workbook in Excel. From the menu bar, choose DATA. In the Get External Data portion of the ribbon, choose From Other Sources. Then choose From SQL Server as the source, like this:

- Enter the Server name and your network or AD login credentials. Click on Next:

Tip
Just a reminder: if you are building this for someone who does not have access to GP, refer to the first report in Chapter 2, Business Intelligence for the General Ledger, to see how to set up security.
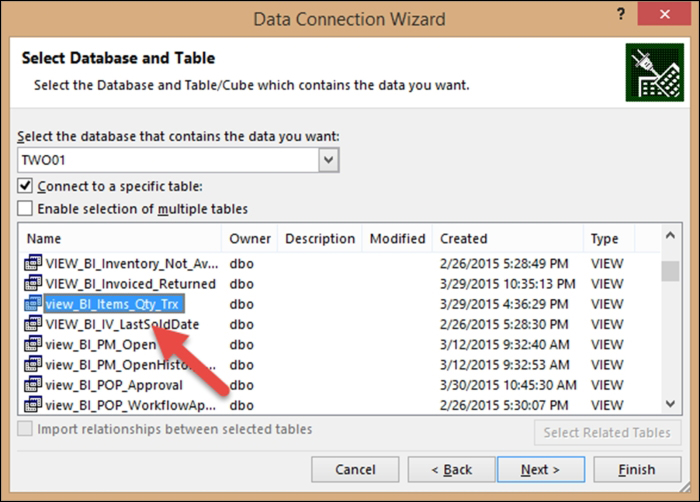
- Select your database from the drop-down list; select view_BI_Items_Qty_Trx. Click on Finish:
- On the Import Data window, select PivotTable Report. Make sure that you are putting the data in the Existing worksheet option in the =$A$1 cell. Then click on OK. The PivotTable canvas will appear.
Let's build the foundation of our PivotTable report:
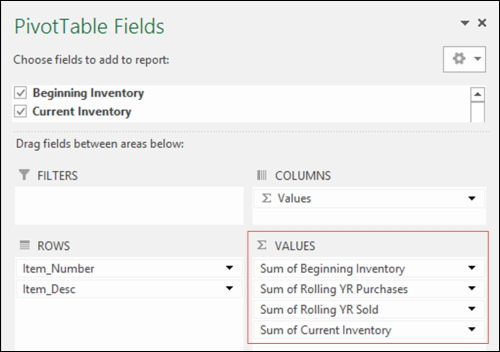
- In the PivotTable Fields list on the right, drag the Item_Number and Item_Desc fields into the ROWS area, as follows:

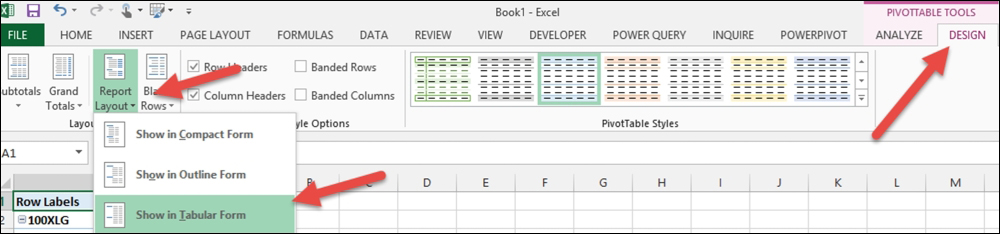
- Click anywhere on the PivotTable, and new menu options will appear, called PIVOTTABLE TOOLS. On the Design tab under PIVOTTABLE TOOLS, choose Report Layout in the Layout section of the ribbon. Select Show in Tabular Form:
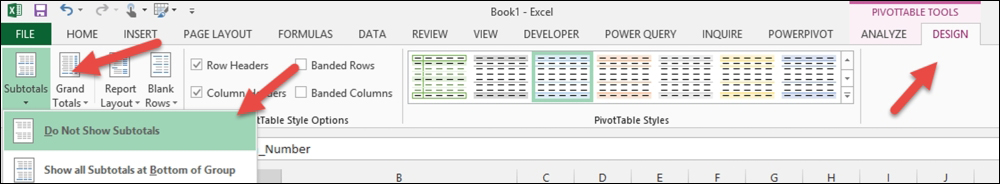
- Again, click anywhere on the PivotTable, and new menu options will appear, called PIVOTTABLE TOOLS. From the Design tab under PIVOTTABLE TOOLS, choose Subtotals in the Layout section of the ribbon. Select Do Not Show Subtotals:
Let's add the custom calculations:
- From the ANALYZE tab under PIVOTTABLE TOOLS, choose Fields, Items & Sets in the Calculations section of the ribbon. Select Calculated Field:

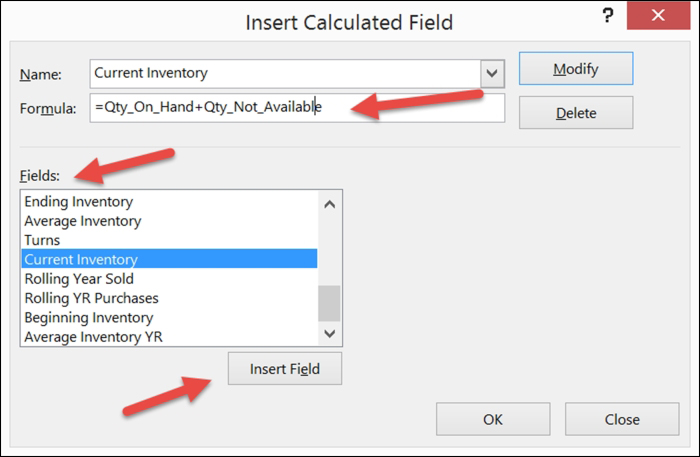
- In the Insert Calculated Field window, in the Name field, enter Current Inventory. Populate the Formula field by selecting Fields and clicking on Insert Field. From the view we created earlier, we'll need the following: Qty_On_Hand and Qty_Not_Available (this is everything in use, in service, returned, and damaged in GP). We'll put these fields together, creating the following: Formula: = Qty_On_Hand + Qty_Not_Available. Click on OK:
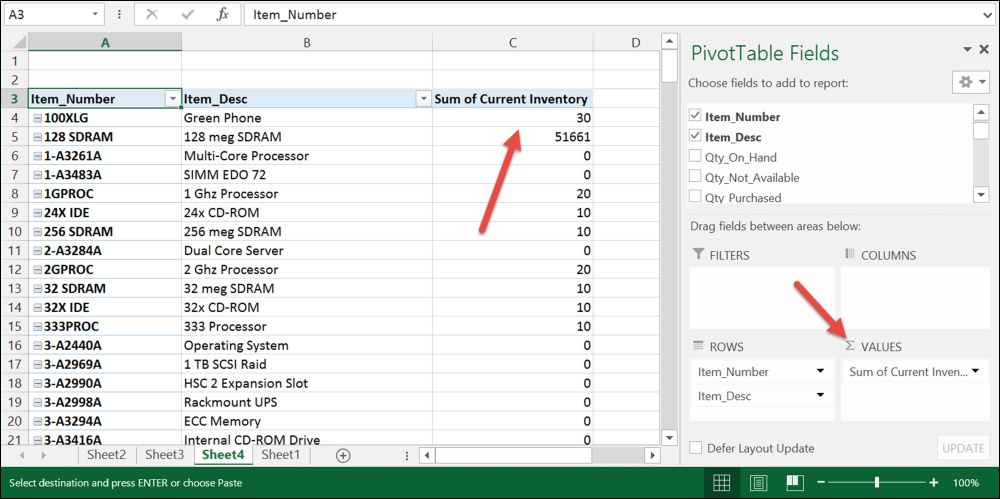
- You'll notice that the new field we created is displayed as a value:
- On the Analyze tab under PIVOTTABLE TOOLS, choose Fields, Items & Sets in the Calculations section of the ribbon. Select Calculated Field.
- In the Insert Calculated Field window, in the Name field, enter Rolling YR Sold. Populate the Formula field by selecting fields from Fields and clicking on Insert Field. From the view we created earlier, we'll need Qty_Sold. This is everything sold in SOP less returns in GP. (By default, items sold are shown as a negative, while items returned are shown as a positive). We'll need to make the sold items positive by creating the following: Formula: = Qty_Sold * -1. Click on OK:

- From the Analyze tab under PIVOTTABLE TOOLS, choose Fields, Items & Sets in the Calculations section of the ribbon. Select Calculated Field.
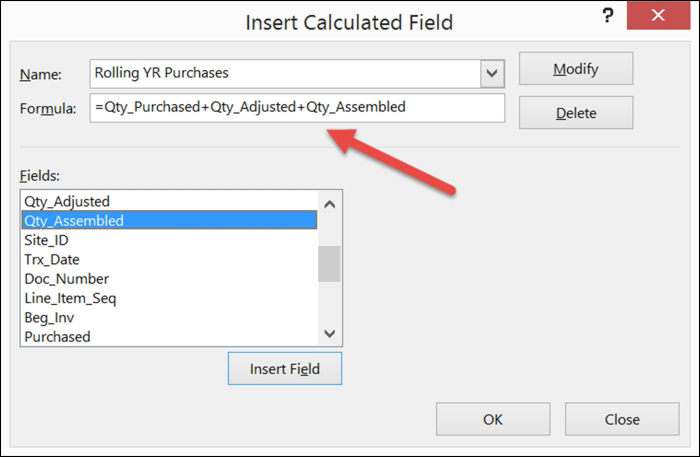
- In the Insert Calculated Field window, in the Name field, enter Rolling YR Purchases. Populate the Formula field by selecting fields from the Fields area and clicking on Insert Field. The formula we want will create a column for the total amount added to the inventory, usually purchased. From the view we created earlier, we'll need the following: Qty_Purchased (this is everything purchased in Purchase Order Processing in GP), Qty_Adjusted (this is the net amount of all inventory transactions, both adjustments and variances in GP), and Qty_Assembled (this is the amount of items built using the bill of materials module in GP). We'll account for purchases by creating the following: Formula: = Qty_Purchased + Qty_Adjusted + Qty_Assembled. Click on OK:
- On the ANALYZE tab under PIVOTTABLE TOOLS, choose Fields, Items & Sets in the Calculations section of the ribbon. Select Calculated Field.
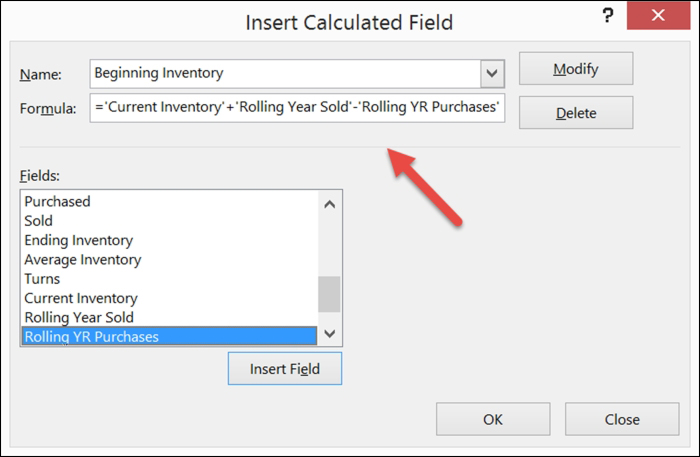
- In the Insert Calculated Field window, in the Name field, enter Beginning Inventory. Populate the Formula field by selecting fields from the Fields area and clicking on Insert Field. The formula we want will create a column for the inventory balance at the beginning of the rolling 12-month period (or exactly 1 year ago). We'll use the previous calculations in our formula to determine the beginning Inventory. Here is the formula: = 'Current Inventory' + 'Rolling YR Sold' - 'Rolling YR Purchases'. Click on OK:
- In the Pivot Table Fields list on the right, re-sort the values by dragging and dropping them in the following order: Sum of Beginning Inventory, Sum of Rolling YR Purchases, Sum of Rolling YR Sold, and Sum of Current Inventory:
- On the Analyze tab under PIVOTTABLE TOOLS, choose Fields, Items & Sets in the Calculations section of the ribbon. Select Calculated Field.
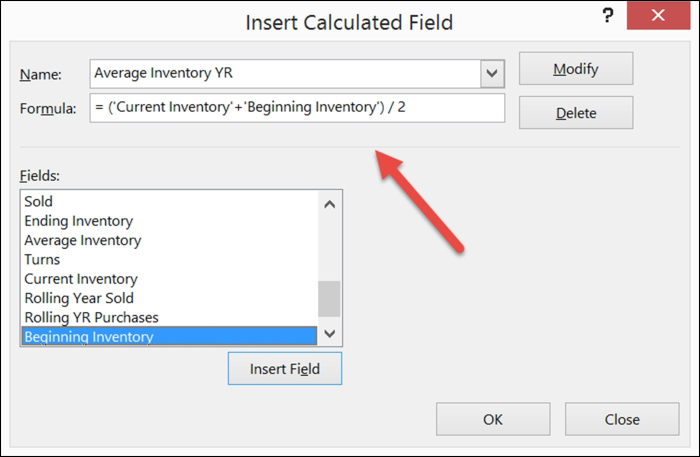
- In the Insert Calculated Field window, in the Name field, enter Average Inventory YR. Populate the Formula field by selecting fields from the Fields area and clicking on Insert Field. The formula we want will create a column that averages the beginning and ending inventory balances. Here is the formula: = ('Current Inventory' + 'Beginning Inventory')/2. Click on OK:
Tip
Inventory systems will often create a turnover report based on the beginning and ending inventory of each item for each month being reported, and then create an average. With our approach, we do not have the ability to determine the beginning and inventory amounts for each period without complex programming. Therefore, we adopted the commonly used calculation of creating an average based on the beginning and ending inventory balance for the entire period. Using either calculation consistently will provide you with excellent results.
- On the ANALYZE tab under PIVOTTABLE TOOLS, choose Fields, Items & Sets in the Calculations section of the ribbon. Select Calculated Field.
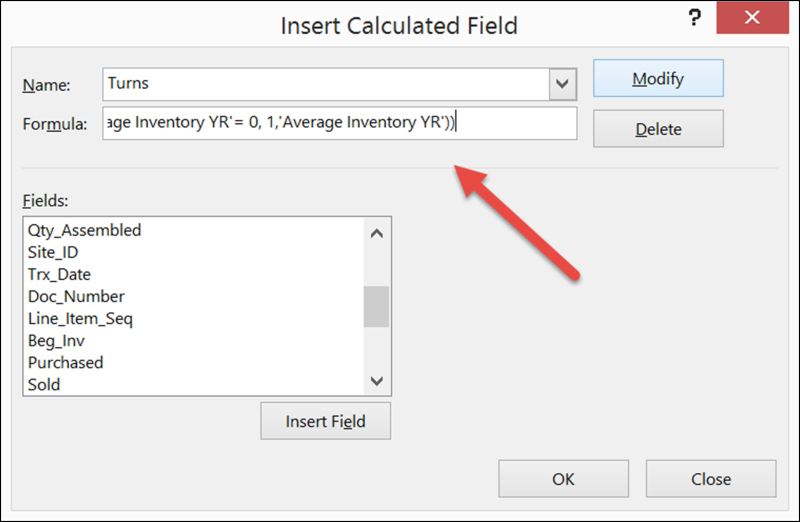
- In the Insert Calculated Field window, in the Name field, enter Turns. Populate the Formula field by selecting fields from the Fields area and clicking on Insert Field. The formula we want will create a column that takes the amount sold and divides it by the average inventory. This will allow us to see what percent of the average inventory turned over for the reporting period. Here is the formula: = ( 'Rolling YR Sold' ) / (IF( 'Average Inventory YR' =0, 1, 'Average Inventory YR' )). Click on OK:
Let's format and finish!
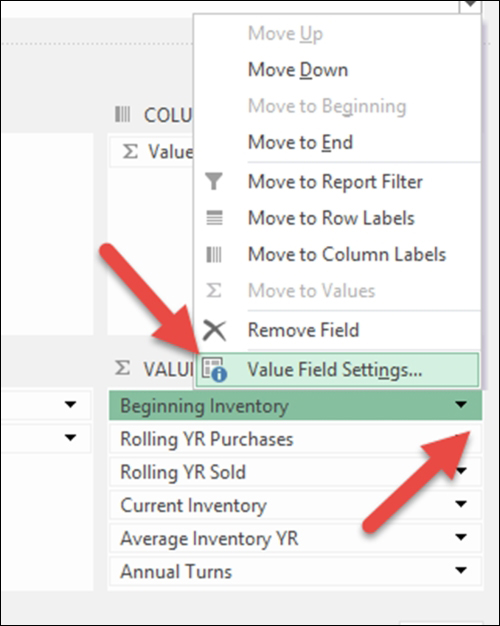
- In the PivotTable Fields list, in the VALUES area, click on the drop-down list for the Sum of Beginning_Balance field. Select Value Field Settings:
- In the Value Field Settings window that opens, make sure that Sum is selected as the Summarize value field by option. Click on Number Format. The Format Cells window will open. Change Category to Number. Select how you want your values to be displayed. Then click on OK for each window to close it:
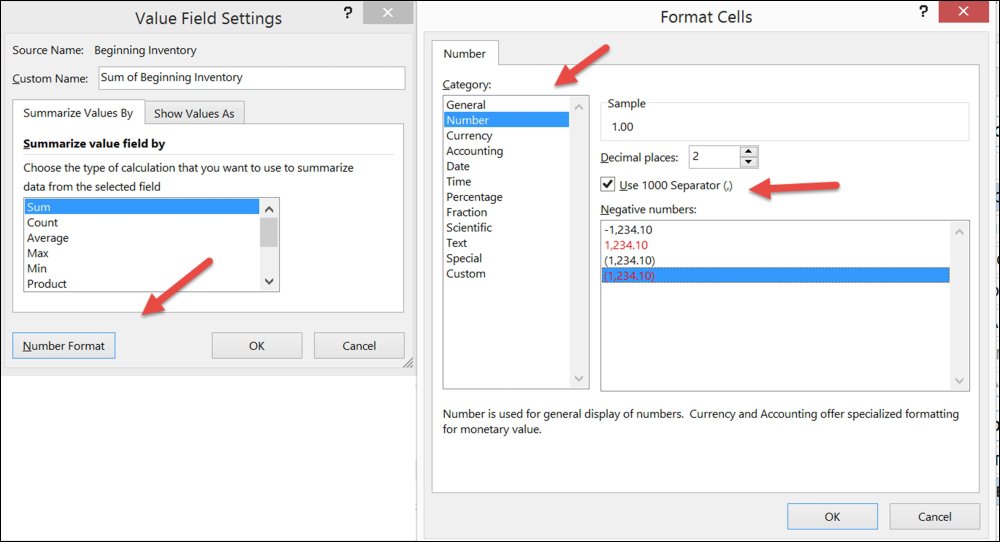
- Repeat the formatting for all the fields in the value section of the PivotTable Fields list. We set all our columns to show the 1000 separator, and set the decimals to 0 for all columns except Turns; we left the decimals for this field at 2.
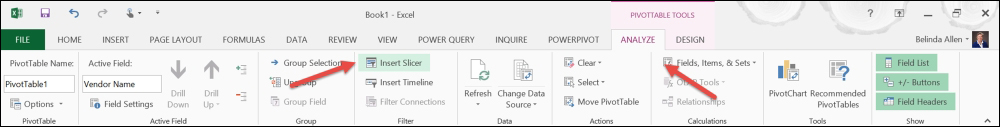
- On the ANALYZE tab under PIVOTTABLE TOOLS, choose Insert Slicer in the Filter section of the ribbon:
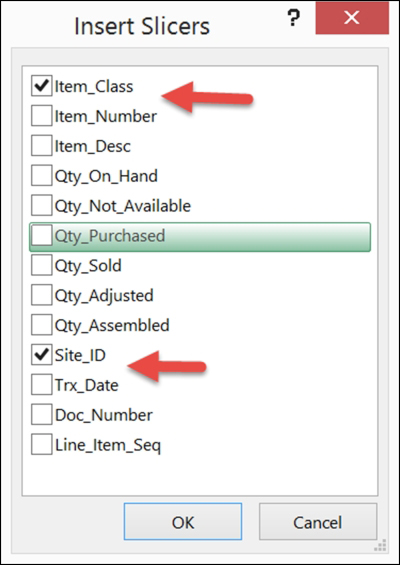
- In the Insert Slicer window, select the checkboxes for Item_Class and Site_ID. Click on OK:
- Highlight each slicer (this step must be done one slicer at a time), and the Excel ribbon will change to SLICER TOOLS | OPTIONS. Select Slicer Settings.
- In the Slicer Settings window, mark Hide items with no data. This will keep the slicers smaller when actively using this report.
- Another addition you may want to make is a Timeline filter on the report. The report will calculate for whatever time period you select, as long as the time period you select is within the previous 12-month period.
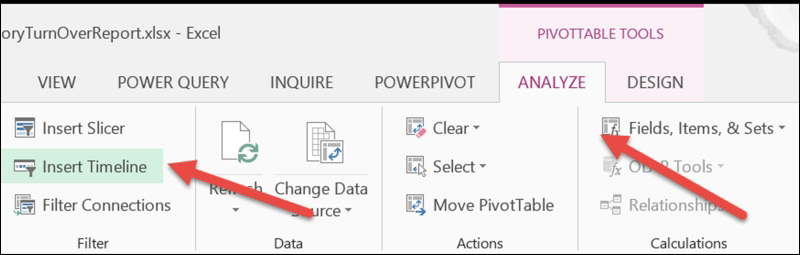
- On the ANALYZE tab under PIVOTTABLE TOOLS, choose Insert Timeline in the Filter section of the ribbon:
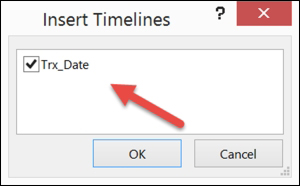
- In the Insert Timeline window, select the checkbox for Trx_Date. Click on OK. Note that this window will give you options for date fields only, and there is only one date field in this view:
- Add a logo and any text you like. To refresh the data from GP, click on Refresh All under the DATA tab.
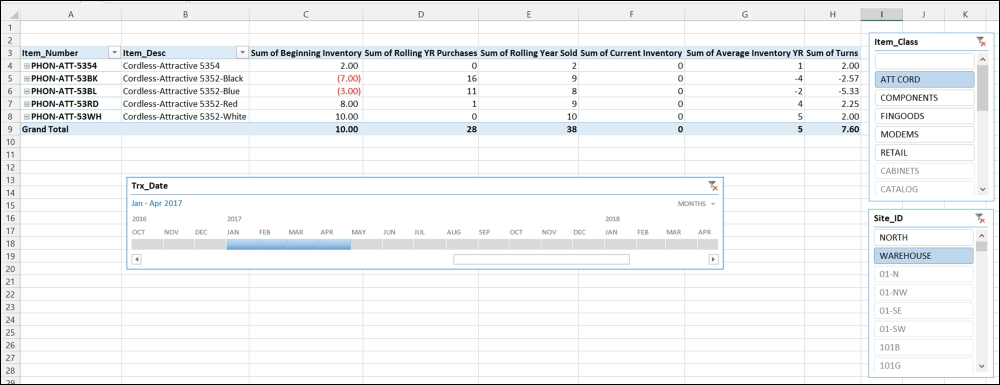
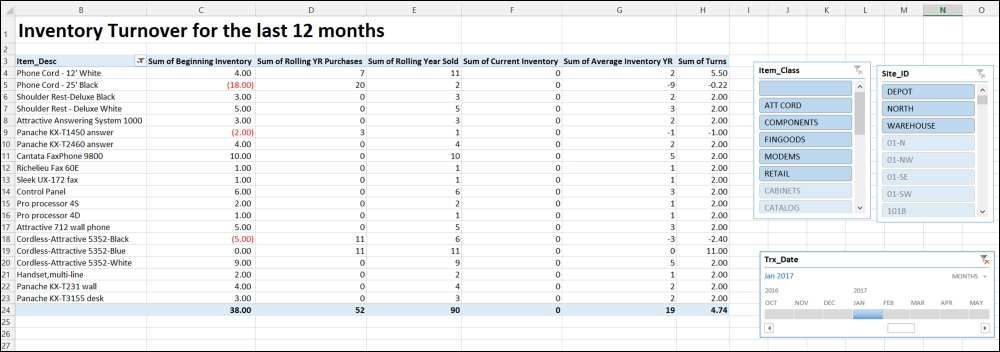
- Now your report can be pulled using date filters, item class filters, and/or the inventory site location ID:
Let's have a little fun! Before we wrap up this report, let's have fun with it by making a few changes that might make it easier to read:
- Let's leave everything as is, except that we'll eliminate all items that have 0 for the number of Turns.
Click on the drop-down list for Item_Desc and select Value Filters and then Does Not Equal:
- When the Value Filter (Item_Desc) window opens, change Show items for which to Sum of Turns, and set does not equal to 0. Click on OK to close the window:
- Here's the result:
Let's add a chart:
- On the ANALYZE tab under PIVOTTABLE TOOLS, choose PivotChart in the Tools section of the ribbon.
- In the Insert Chart window, select Line and click on OK.
- Click on the chart and remove Item_Desc from AXIS in the PivotChart Fields list. Note that this will also remove it from the PivotTable.
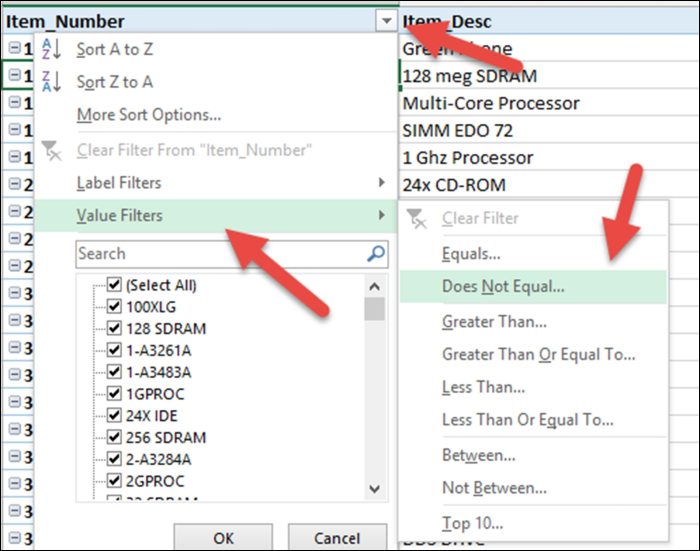
- As you did in the last step, click on the drop-down list for Item_Number. Select Value Filters and then Does Not Equal.
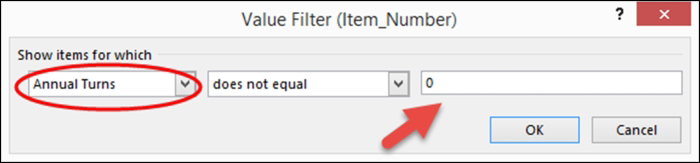
- When the Value Filter (Item_Number) window opens, change Show items for which to Sum of Turns, and set does not equal to 0. Click on OK to close the window.
- The result is as follows:
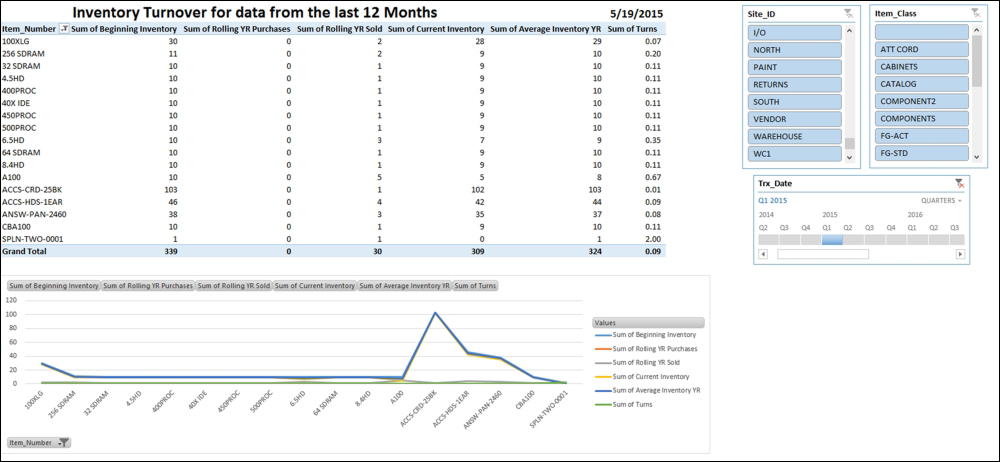
Isn't it easy to see that the ACCS-CRD-25BK item has the highest turnover rate?
Use your imagination!
By using this report, you can easily see which items have a low turnover rate and, thereby, a greater investment in the inventory compared to those with a high turnover rate and, thereby, a lesser cash investment in the inventory. The preceding screenshot makes it very easy to see that the black 25-foot phone cord turns over more quickly than anything else during the quarter we are reviewing. Why is that so? Did we have this item on sale? During the quarter being reviewed, we did not sell any other phone cords. Then why? The two highest turnover items were both accessories. Why did accessories sell better than other items?
Just this bit of information helps us evaluate how our customers purchase what they purchase, and creates a large variety of questions that might just make your business more profitable, resulting in a bonus for you. Hey, it could happen!