
We've looked at BI reports for most of the financial and distribution modules. We cannot possibly include every report we think you might need, so we had to be selective. However, we wanted to give you a little bit of payroll/human resources and commissions.
What we will build in this chapter:
- An employee list with personal details by location
- Commission details
This report will be a list of all employees in Human Resources, and some additional personal information such as spouse, children, and so on.
This report was built for a company that has a lot of small satellite offices. The owner likes to visit these small offices regularly, but cannot possibly remember the names and details of every employee for every location.
The owner asked for this "cheat sheet", so he is able to not only greet employees by their names, but ask about their family as well. On the surface, this may sound a little phony, but it actually is very personal. Although he cannot personally know each employee, he does care about each employee. He feels every employee is important, important enough to be called by name.
We will be using the table feature of Excel. This just needs to be a simple list that can be reviewed before entering the satellite office.
There are two parts to these steps. The first part is technical, containing steps that involve work in SQL Server. The second part is the actual building of the report. You may choose to obtain assistance with the technical part, especially if you do not have access to SQL Server.
Create the following view in SQL Server:
CREATE VIEW view_BI_EmployeeDependents AS
SELECT EM.EMPLOYID AS Employee_ID,
 RTRIM(EM.FRSTNAME) + ' ' + RTRIM(EM.LASTNAME) AS Employee,
 EM.NICKNAME AS Nickname,
 CASE EM.GENDER
 WHEN 1 THEN 'Male'
 WHEN 2 THEN 'Female'
 ELSE 'Other'
 END AS Gender,
 EM.BRTHDATE AS Birthday,
 EM.STRTDATE AS Start_Date,
 EM.DIVISIONCODE_I AS Division,
 PDS.DSCRIPTN AS Department,
 PPS.DSCRIPTN AS Job_Title,
 CASE PMD.RELATIONSHIP
 WHEN 1 THEN 'Spouse'
 WHEN 2 THEN 'Child'
 WHEN 3 THEN 'Parent'
 WHEN 4 THEN 'Sibling'
 WHEN 5 THEN 'Guardian'
 ELSE 'Other'
 END AS Relationship,
 RTRIM(PMD.FRSTNAME) + ' ' + RTRIM(PMD.LASTNAME) AS Dependents,
 CASE PMD.GENDER
 WHEN 1 THEN 'Male'
 WHEN 2 THEN 'Female'
 ELSE 'Other'
 END AS Dependent_Gender,
 CASE PMD.BRTHDATE
 WHEN 1 / 1 / 1900 THEN NULL
 ELSE PMD.BRTHDATE
 END AS Dependent_DOB
FROM dbo.UPR00100 AS EM
LEFT OUTER JOIN dbo.UPR40301 AS PPS ON EM.JOBTITLE = PPS.JOBTITLE
LEFT OUTER JOIN dbo.UPR00111 AS PMD ON EM.EMPLOYID = PMD.EMPLOYID
LEFT OUTER JOIN dbo.UPR40300 AS PDS ON EM.DEPRTMNT = PDS.DEPRTMNT
WHERE (EM.INACTIVE = 0)
 AND (PMD.RELATIONSHIP < '7')
GO
GRANT SELECT ON view_BI_EmployeeDependents TO DYNGRP
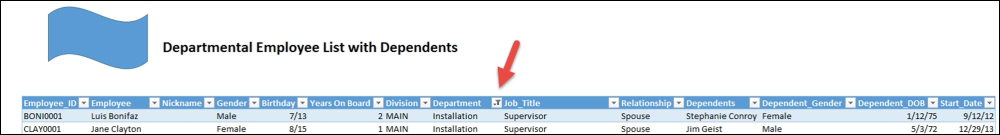
Put it on paper first; think about what you require. Here's the screenshot of the desired result:

Let's make a connection to the GP data:
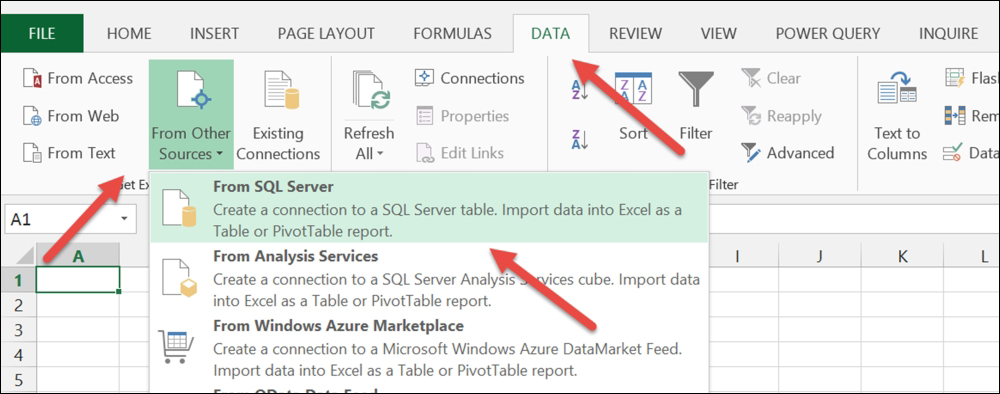
- Open a blank workbook in Excel, and from the menu bar, choose DATA. In the Get External Data portion of the ribbon, choose From Other Sources. Then choose From SQL Server as the source:
- Enter your Server name and network or AD login credentials. Then click on Next:

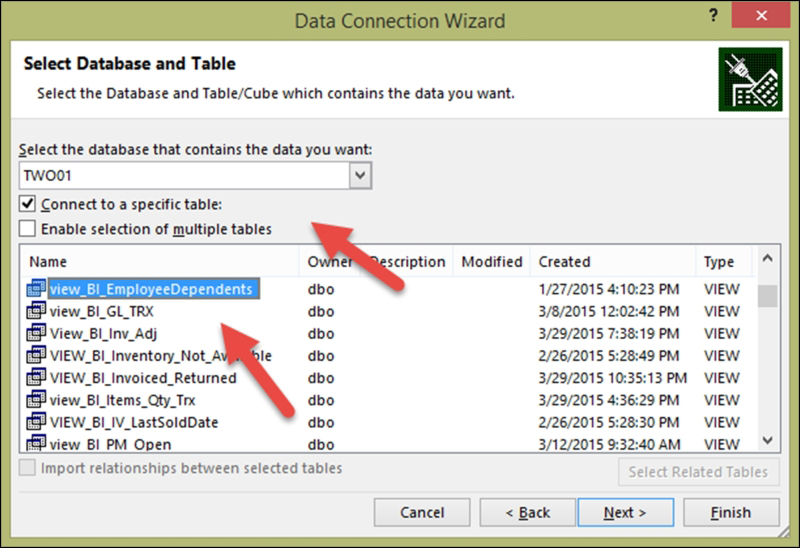
- Select your Database from the drop-down list. Select the new view we just created, VIEW_BI_EmployeeDependents. Then, click on Finish:
- On the Import Data window, select Table. Make sure that you are putting the data in the Existing worksheet option in the =Sheet!$A$2 cell. We will leave the first row blank, which is why it is using $A$2 rather than $A$1. If you do not leave the blank row now, you can always insert a blank row later. Then, click on OK:

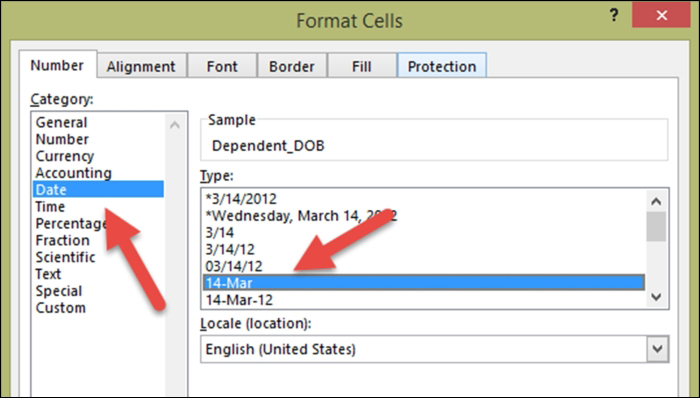
- Reformat the date columns, so the time doesn't show; use any date format that makes you happy. You might want to use only month and day for the Birthday and Dependent_DOB columns:
- Insert a new column after Start_Date, so we can add an additional column for the number of years the employee has been with you. Give the new column the name Years Employed. The formula will be the one that is not listed in any of the Excel Function Libraries, so we'll have to manually enter it. We'll be using the DATEDIF function. This function calculates the difference between two dates by whatever argument you define.
- Click in the first blank row of this new column:

- The formula we will type here is:
=DATEDIF([@[Start_Date]], TODAY(), "y")
The function is DATEDIF. In parentheses, we will include the [Start_Date] and today's date. The [ ] around Start_Date indicates that this is an entire column and you want the information in the row that corresponds to the row number of the function. Today's date is indicated with the TODAY() function. Finally, we tell the function we only want the difference in years, so we'll enter y to indicate year. The start date, today's date, and year argument are all separated by commas.
- You will probably need to reformat the column to a number (perhaps even setting the decimal place to 0). When inserting a column in a table, the format often comes from the neighboring column.
- Since this is a table, the function will copy to all the records in the table. This is a wonderful feature. Another benefit of using a table is that it can be made into a refreshable report, allowing the formula to automatically add to any new records, and not persist if any records are removed.
- Stretch row 1, add a logo and/or report name, and then this report is done!
- Optional: Use the filter options on the table to see only the employees you want to see:
- Optional: Filter to just Support Services Department on the preceding report, and ask Pilar "how are Josh and Jay doing?"
Going back to the definition that Business Intelligence leads to better decisions with timely and accurate information, this company is improving employee/employer relations by having access to information that will increase personal interactions. Anything and everything that will improve the success of the organization matters.