
This is by far the most common report we are asked to deliver in Excel. Every AP department uses this report to help determine which vendors need to be paid and which vendors need attention. It's also a favorite request of the auditors. There is a nice version of this report in GP; however, it requires being logged in, and it's not (easily) exportable to Excel. We see many organizations wanting this report in Excel, so they can use Excel features to review large amounts of data effortlessly.
This report is for all companies. It allows sharing the ability to generate an aged trial balance, regardless of who can and cannot log into GP.
It is difficult to set up GP so that the aged trial balance can print in a format that is easy to read and export to an Excel worksheet, as well as in a format that allows for Excel slicing and dicing.
The goal is to share an Excel report with those who do not have access to GP.
There are two parts to these steps. The first part is technical, containing steps that involve work in SQL Server. The second part is the actual building of the report. You may choose to obtain assistance with the technical part, especially if you do not have access to SQL Server.
We'll use the same SQL View created in the previous report, so you are ready to move on to the non-technical matter.
With the SQL Server part completed in the previous section, let's build a report!
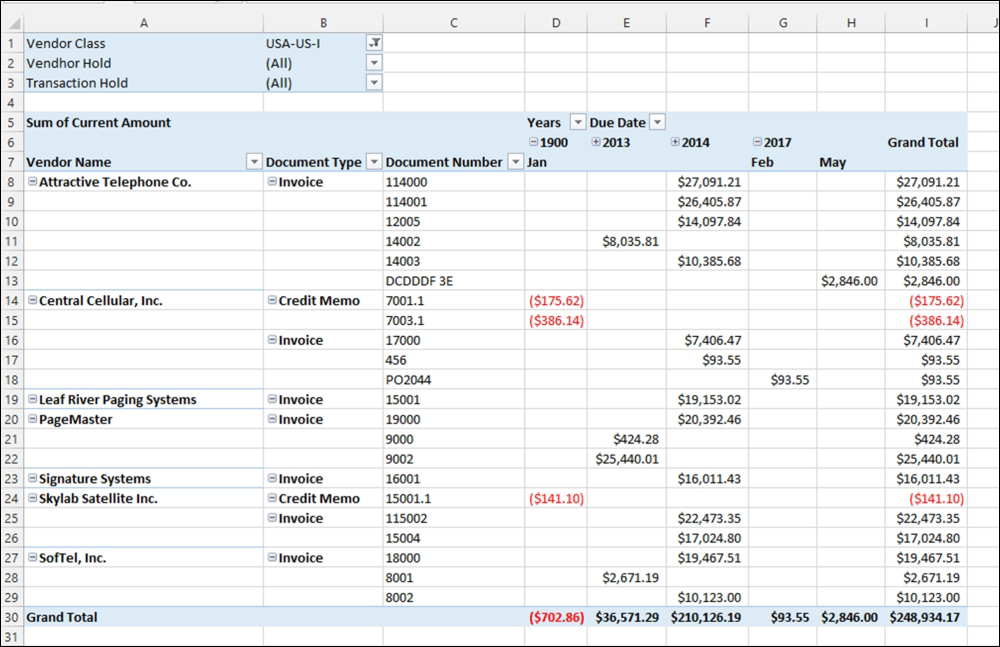
Know what you want. We've already completed this step and have included a screenshot here:
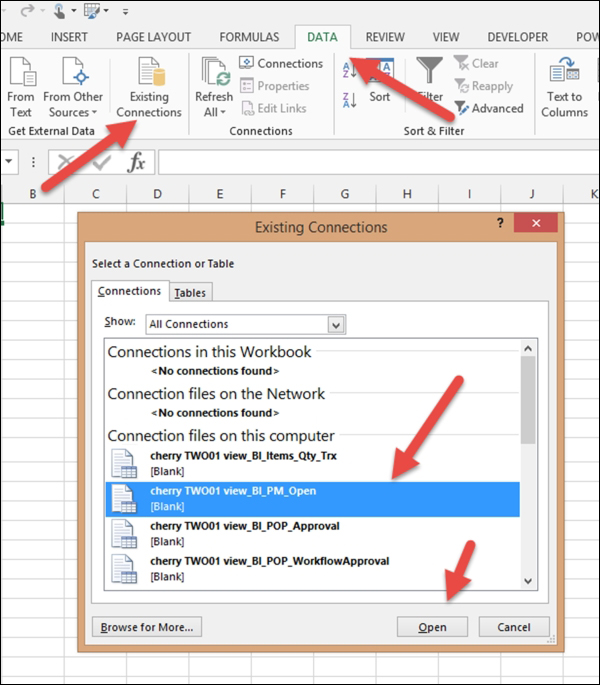
Let's make a connection to the GP data:
- Open a blank workbook in Excel and from the menu bar, choose DATA. In the Get External Data portion of the ribbon, choose Existing Connections. Highlight the connection we created on the previous report and click on Open:
- Enter your Server name and your network or AD login credentials
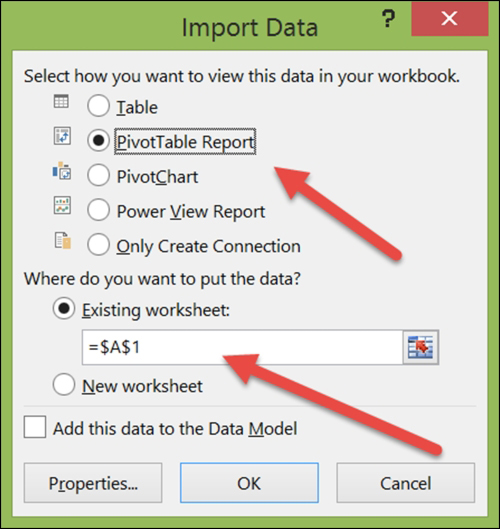
Let's build the first PivotTable report:
- On the Import Data window, select PivotTable Report. Make sure that you are putting the data in the Existing worksheet option in the =$A$1 cell. Then, click on OK.
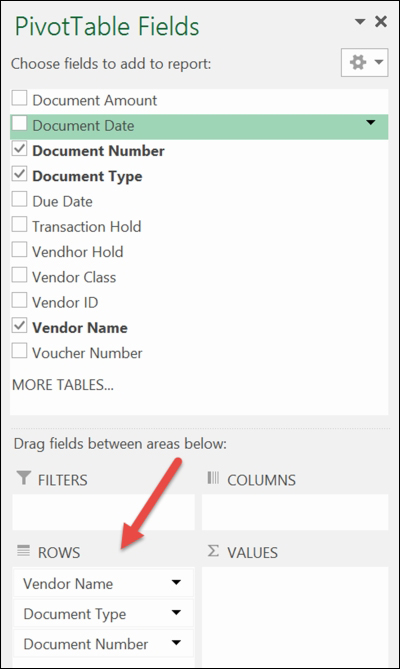
- The PivotTable canvas will appear. In the PivotTable Fields list on the right-hand side, drag the Vendor Name, Document Type, and Document Number fields down to the ROWS area:
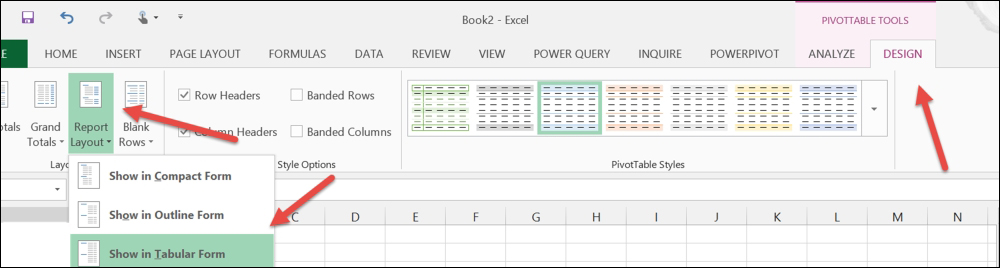
- Click anywhere on the PivotTable and new menu options will appear called PIVOTTABLE TOOLS. On the DESIGN tab, under PIVOTTABLE TOOLS, choose Report Layout in the Layout section of the ribbon. Now, select Show in Tabular Form:
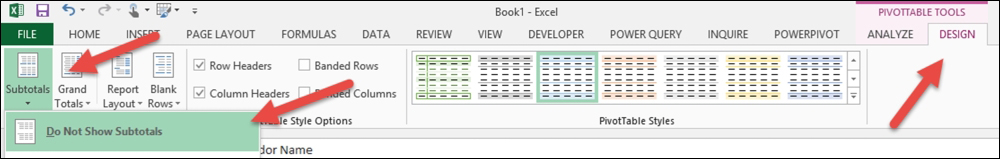
- Again, click anywhere on the PivotTable and new menu options will appear called PIVOTTABLE TOOLS. On the DESIGN tab, under PIVOTTABLE TOOLS, choose Subtotals in the Layout section of the ribbon. Now, select Do Not Show Subtotals:
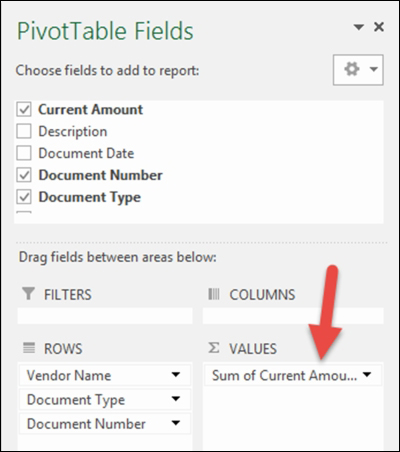
- In the PivotTable Fields list, drag Current Amount to the VALUES area:
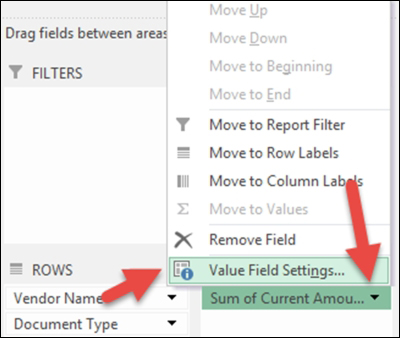
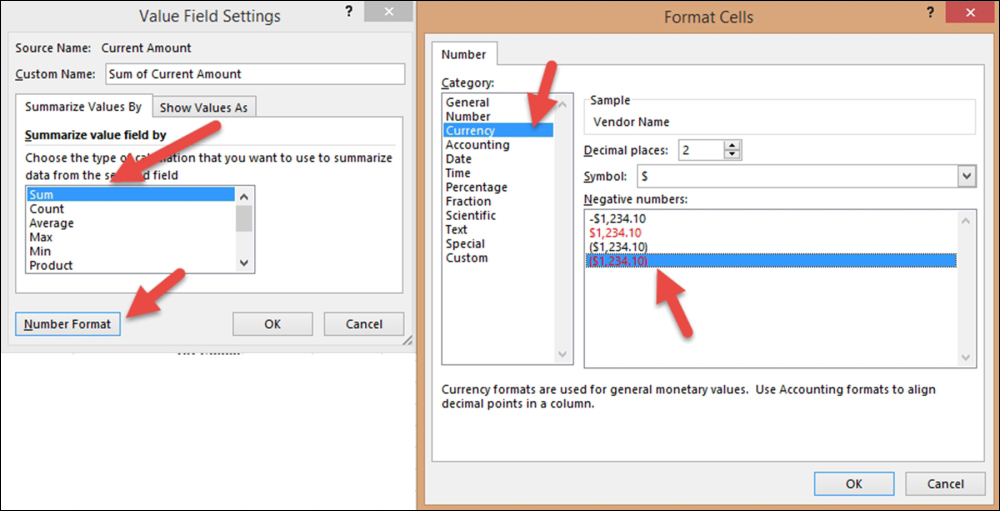
- In the PivotTable Fields list, in the VALUES area, click on the drop-down list for the Sum of Current Amount field. Now, select Value Field Settings:
- In the Value Field Settings window that opens, make sure that Sum is selected as the Summarize value field by option. Click on Number Format and the Format Cells window will open. Change Category to Currency. Select how you would like your payments and credits to display, and then click on OK for each window to close:
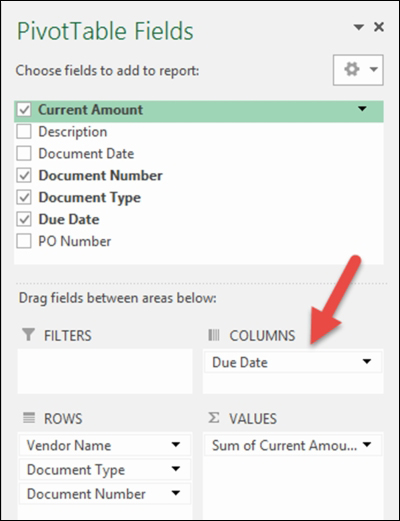
- Click on the PivotTable, so the PivotTable Fields list appears. Drag Due Date to the COLUMNS area:
- Right-click on the first date (column header) and select Group:
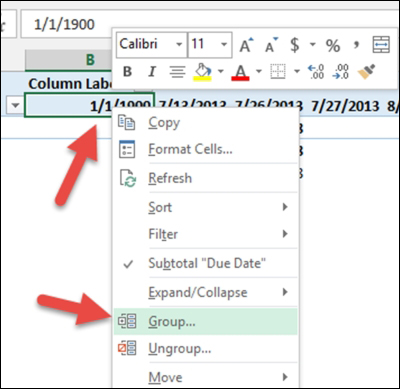
- In the Grouping window, click on Years to highlight it and leave Month highlighted. This will allow for columns to be broken down by year and then by month. Then, click on OK:

- Click on the PivotTable, so the PivotTable Fields list appears. Drag Vendor Class, Vendor Hold and Transaction Hold to the FILTERS area. This will allow the ability to restrict the report to any of these criteria:

- Anywhere you see the + sign, you can expand to show details. Anywhere you see the - sign, you can collapse to show summaries:
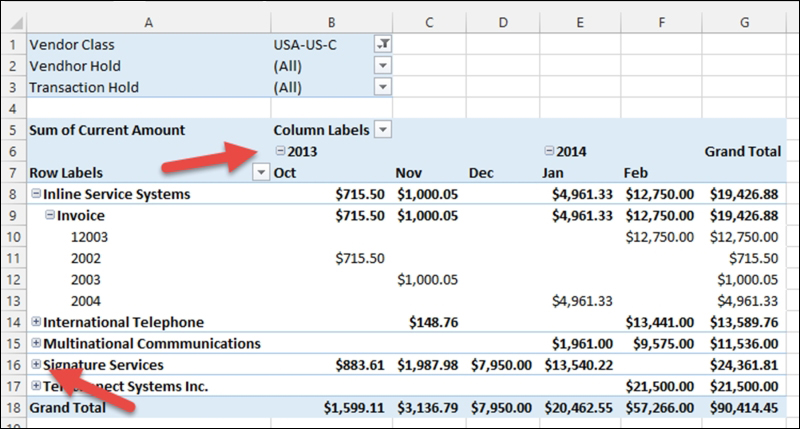
This report allows non-GP users and GP users the ability to obtain a current listing of unpaid transactions, subtotaled by vendors based on their date. Since this report is in Excel, users can easily share this report via e-mail, SharePoint, and/or other options. Graphs and charts can be added as well. The reports can be filtered by vendor class, hold statuses, and due dates. We can even add the vendor's PO number and description if we like. Having access to this data on demand for non-GP users can speed up approval processes and find billing errors faster.