
Creating EXCEL Output with ODS
The ODS EXCEL Statement
To open, manage, or
close the Excel destinations that produce Excel spreadsheet files
that are compatible with Microsoft 2010 and later versions, use the
ODS EXCEL statement:
|
Syntax, ODS EXCEL statement:
ODS EXCEL <(<ID=>identifier)> <action>;
ODS EXCEL <(<ID=>identifier)> <option(s)>;
|
Details About the ODS Destination
The ODS destination
for Excel uses Microsoft Open Office XML Format for Office 2010 and
later. This statement produces XML and represents a way to define
and format data for easy exchange.
The ODS destination
for Excel creates Microsoft spreadsheet in ML XML. Each table is placed
in its own worksheet within a workbook. This destination supports
ODS styles, trafficlighting, and custom formats. Numbers, currency,
and percentages are correctly detected and displayed. Style override,
a TAGATTR= style attribute, can be used to create custom formats for
the data. By default, titles and footnotes are included in the worksheet,
but they are part of the header and footer of the worksheet.
Portrait is the default
printing orientation. The orientation can be changed to landscape.
Example: Customizing Your Excel Output
The following example
shows you how to create a customized Excel workbook that contains
PROC TABULATE output. The ODS EXCEL statement is used to make the
following customizations:
-
A new sheet is created for each BY group.
-
The BY lines are suppressed.
-
The title that is created by the TITLE statement is embedded in the output.
-
The worksheet labels are customized.
ods excel file="multitablefinal.xlsx"
   options(sheet_interval="bygroup"
           suppress_bylines="yes"
           sheet_label="country"
           embedded_titles="yes"
           embed_titles_once="yes" );
title "Historical Sales Data";
proc tabulate data=sashelp.prdsale;
   by country;
   var predict actual;
   class region division prodtype year;
   table year=[label=' '],
      region*(division*prodtype all=[label='division total'])
      all=[label='grand total'],
      predict=[label='total predicted sales']*f=dollar10.*sum=[label='']
      actual=[label='total actual sales']*f=dollar10.*sum=[label=''] /
      box=_page_;
run;
ods excel close;
Figure 10.11 Customized Excel Output
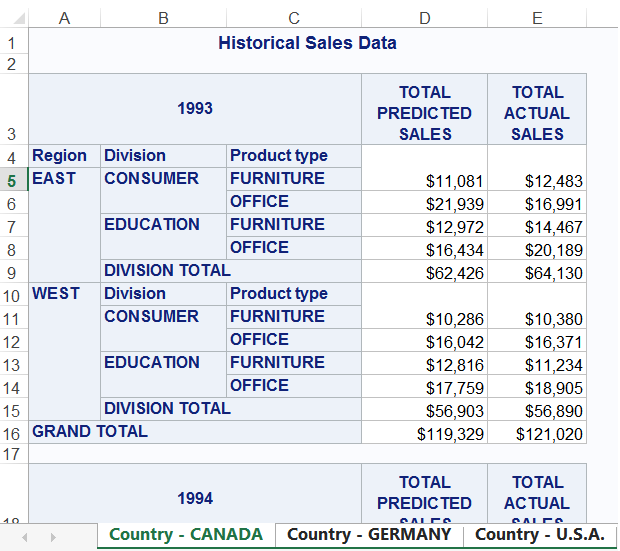
The SHEET_INTERVAL=
option specifies that a new sheet is created after each BY group.
The SUPPRESS_BYLINES= option is used to suppress the printing of the
BY lines text. The SHEET_LABEL= option specifies the text “Country”
as the first part of the worksheet label. The EMBEDDED_TITLES= option
specifies that the title that was created by the TITLE statement is
embedded in the Excel worksheet. The EMBED_TITLES_ONCE option specifies
that the title is embedded once, at the top of each sheet.
Example: Customizing ODS Excel Output Using TAGATTR Style Attribute
In the following example,
the TAGATTR= style attribute allows you to customize the styles and
format of the data in the Excel workbook. Negative values are noted
by red font and parentheses. These are created using the TAGATTR=
style attribute.
The TAGATTR= style attribute
in the first VAR statement specifies the format for the positive values.
The negative numbers are printed in red and are enclosed in parentheses.
The TAGATTR= style attribute in the second VAR statement specifies
the format for negative values. The negative numbers are printed in
red and are enclosed in parentheses. The difference is calculated
using the formula RC[-1] . The TAGATTR= style attribute in the SUM
statement specifies the format that is used to show the sums for
Predicted Sales For Area , Actual Sales Amount, and Difference. The
first TAGATTR= attribute specifies the format for the positive values,
and the second format is for negative values. The negative values
are printed in red and are enclosed in parentheses.
ods html close;
data prdsale;
   set sashelp.prdsale;
   Difference = actual-predict;
run;
proc sort data=prdsale;
   by country region division year;
run;
ods excel file='tagattr.xlsx';
proc print data=prdsale(obs=15) noobs label split='*';
   id country region division;
var prodtype product quarter month year;
var predict actual /
    style={tagattr='format:$#,##0_);[Red]($#,##0)'};
var difference /
    style={tagattr='format:$#,##0_);[Red]($#,##0) formula:RC[-1]-RC[-2]'};
sum predict actual difference /
    style={tagattr='format:$#,##0_);[Red]($#,##0)'};
label prodtype = 'Product*Type'
      predict  = 'Predicted*Sales*For Area'
      actual   = 'Actual*Sales*Amount';
run;
ods excel close;
ods html path="%qsysfunc(pathname(work))";
This output is created
using the ODS destination for Excel. It uses the style attribute TAGATTR=
to customize the data in the Excel workbook.
Output 10.2 Customized Data in the Excel Workbook Using the TAGATTR=Style
Attribute

Example: Applying a Style Sheet to Excel Output
The following program
applies a style sheet created in a CSS file to the Excel output. In
the style sheet, the value for the anchor (the value used with CSS
as the ID) is specified. The default ID is #IDX. To choose the name
of the ID so that it does not use the default, rename the anchor.
Here is an example of
the external CSS file StyleSheet.css. To save the external CSS file,
copy and paste into a text editor and save as StyleSheet.css.
#Expense .header {
                   background-color:green
                 }

#Reports  .header {
                   background-color:red
                  }
The following example
adds the worksheets on the same sheet using option SHEET_INTERVAL=
. The CSS styles create different background colors for the headers
in the first table and the headers in the second table. ID #expense
is specified for the first table, and the ID #Reports is specified
for the second table using the ANCHOR= option.
ods html close;
ods excel file="c:excelAnchorCss.xlsx"
          cssstyle="file-pathStylesheet.css"
          options(sheet_interval="none");
ods excel anchor="expense";
proc print data=sashelp.class;
run;

ods excel anchor="reports" cssstyle="file-pathStylesheet.css";
proc print data=sashelp.class;
run;

ods excel close;
ods html path="%qsysfunc(pathname(work))";
The SHEET_INTERVAL=”NONE”
option specifies that all output appear on the same sheet. The CSSSTYLE=
option specifies the file StyleSheet.css to provide different background
colors to the output.
It is possible to create
a different background color for the header in the first table by
adding ID #Expense for the first table using the ANCHOR= option. The
file StyleSheet.css contains a matching ID. By default, the IDs are
#IDX and #IDX1 because an anchor ID was not specified.
It is possible to create
a different background colors for the header in the second table by
adding ID #Reports using the ANCHOR= option. The file StyleSheet.css
contains a matching ID. By default, the ID for the second table is
#IDX1 because an anchor ID was not specified.
Output 10.3 Customized ODS Excel Output by Using a Style Sheet

Last updated: January 10, 2018
..................Content has been hidden....................
You can't read the all page of ebook, please click here login for view all page.