
14.3. Performance Monitor
Performance Monitor enables the graphical display and logging of counters representing aspects of system performance, such as CPU Usage % and Memory Paging. SQL Server exposes its own counters, such as Buffer Cache Hit Ratio, to Performance Monitor through the sys.dm_os_performance_counters DMV.
In chapter 17, we'll cover the use of Performance Monitor as part of a targeted performance-tuning methodology. In this chapter, our focus will be twofold: a broad overview of viewing and capturing counters and using the collected values for baseline analysis. Let's begin with a look at the process of viewing and capturing counters.
14.3.1. Viewing counters in real time
In Windows Vista and Server 2008, Performance Monitor is one component of the Reliability and Performance Monitor tool. As with versions in older operating systems, counters can be viewed in real time as well as being captured for later analysis.
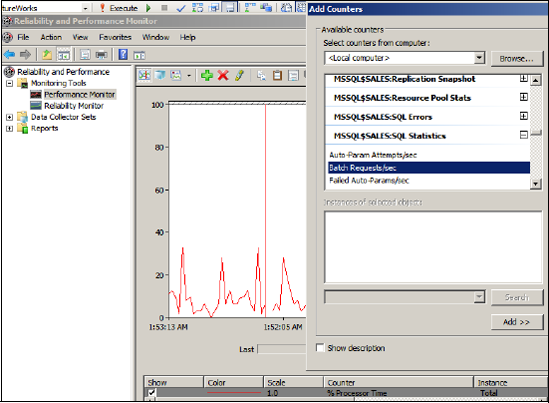
After you open Reliability and Performance Monitor, the % Processor Time counter from the Processor object is automatically tracked in real time with a 1-second refresh interval. Additional counters can be added to the graph by clicking the green + icon on the toolbar.
Counters are added by first navigating thorough objects, which categorize the counters into groups. For example, in figure 14.15, the Batch Request/Sec counter is found within the SQL Statistics object.
Viewing counters in real time is frequently used for detecting abnormal values at a glance for a small number of key performance counters on critical SQL Server instances. Depending on the refresh interval and window width, only approximately 30-90 seconds of the most recent activity will be displayed at any given moment. For longer-term analysis, we can create data collector sets.
Data collector sets, like the equivalent counter logs in previous versions of Performance Monitor, are created to capture performance counters to a log file. The log files can then be opened for retrospective performance troubleshooting, for example, importing into Profiler as we saw earlier, and baseline analysis.
14.3.2. Baseline analysis
A baseline is a record of the average values of a number of key system metrics such as % CPU Usage over a period of time in which performance is reported as being normal. Initial baselines are often recorded shortly after a system enters production and serve as a reference point for future comparison.
As we'll discuss shortly, one of the recommended DBA tasks is the ongoing capture and analysis of performance counters in order to compare current performance characteristics to a known baseline. In doing so, performance trends can be detected and used for capacity-planning purposes.
Figure 14.15. In addition to the % Processor Time counter, which is displayed automatically, additional performance counters can be added by clicking the green + icon on the toolbar.
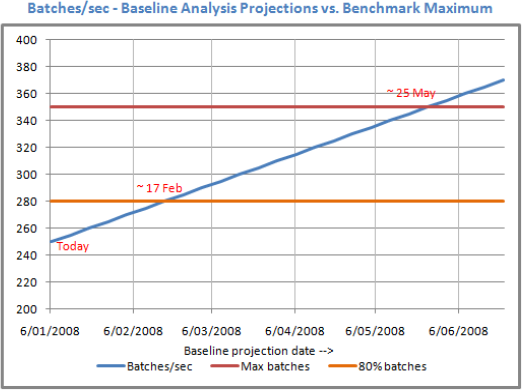
The baseline analysis technique is particularly powerful when combined with a stress-testing exercise to establish the system breaking point. For example, the RML utilities allow us to use the OStress tool to load the system with transactions until response time degrades to an unacceptable level. Once that level is established, a baseline analysis exercise becomes much more meaningful. Imagine being able to confidently say to management, "We know the system will break when we reach 500 batches per second, and based on my observations of recent usage, we'll reach that point in 12 weeks." Figure 14.16 illustrates the combination of baseline analysis and a benchmarking exercise that establishes a system breaking point.
When capturing performance counters for both the initial baseline and ongoing analysis, there are a number of important considerations, particularly around the sampling frequency, logging timeframes, and included metrics:
Counter values should be captured during times that include peak usage periods. Limiting the capture of counters to periods of low usage (sometimes done to reduce server load) will miss the most important points of the day.
Depending on how the data collector set is created, the default sample interval ranges from 1 second to 15 seconds. While a 1-second sample interval is likely to add slightly more server load, the resultant data provides a much better performance resolution. In contrast, a 15-second interval is likely to miss (or obscure) some important periods of activity.
Finally, in considering which counters to include, there are two schools of thought. One advocates including lots of counters in order to have a detailed picture if and when one is required. The other argues for only a few key metrics in order to reduce the monitoring-induced load on the server. In almost all cases, the best approach is in between these two, with site-specific conditions usually having an important bearing.
Figure 14.16. In combination with a benchmark that establishes a system's breaking point, baseline analysis enables early warning of likely performancedegradation points.
Appendix C contains a list of commonly captured Performance Monitor counters, and in chapter 17, we'll focus on a performance-tuning methodology that measures various counters in combination with a number of wait types.
The focus of the chapter thus far has been on monitoring tools and reports. As any experienced DBA knows, spending all day manually monitoring a large number of server instances is both mind numbing and only moderately successful, if at all possible. Together with good configuration settings and proactive management, an exception-based management approach is required for large environments, and fortunately there are a number of automation and alert techniques that we can employ to do most of the monitoring for us, freeing up time for more important and/or rewarding tasks.