
14.4. Task automation and alerts
A common attribute among all successful database-monitoring regimes is a strong automation and alerting component. A DBA may be able to manually manage and monitor a handful of instances with moderate success, but as the number of instances increases, actions become more and more reactive, eventually culminating in complete chaos.
Automation delivers a crucial advantage to a DBA. It enables more things to be achieved with fewer mistakes in a given amount of time, therefore enabling a DBA to pick and choose the things to spend time on, be it research, design, or reading the newspaper. Either way, having the luxury to choose is a valuable asset.
Throughout this book, we've spoken a lot about the importance of a number of administration tasks such as backups, integrity checks, and index/statistics maintenance. What we've yet to address is a mechanism for the automation of such tasks. Let's do that right now, beginning with SQL Server maintenance plans.
14.4.1. Maintenance plans
A SQL Server maintenance plan allows the creation and scheduling of maintenance tasks through either a wizard-driven interface or using the Maintenance Plan design surface.
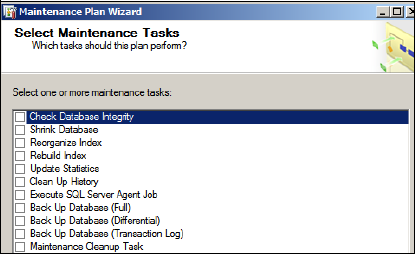
Right-clicking Maintenance Plans under Management in SQL Server Management Studio allows you to select the Maintenance Plan Wizard option. The purpose of this wizard is to create and schedule tasks covering the major administration items such as backups, DBCC checks, and index maintenance. The steps in this wizard enable the selection and scheduling of common maintenance tasks, as shown in figure 14.17.
Figure 14.17. The Maintenance Plan Wizard automates the creation and scheduling of important maintenance tasks.
Despite the ease of use of the Maintenance Plan Wizard, it lacks a certain level of flexibility, particularly in executing custom T-SQL tasks and flow control, both of which are catered to in the Maintenance Plan design surface.
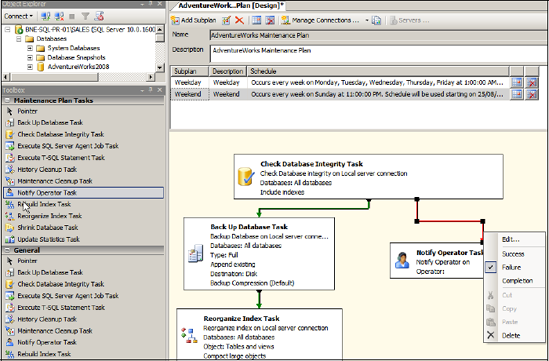
As with the Maintenance Plan Wizard, the design surface is accessed by right-clicking Maintenance Plans under the Management node in SQL Server Management Studio. Selecting New Maintenance Plan prompts you for a maintenance plan name before opening the design surface, as shown in figure 14.18.
Let's walk through the major components of a maintenance plan design, beginning with connections.
Connections
As shown in figure 14.18, the toolbar on top of the design surface includes a Manage Connections button. By default, each plan is created with a local server connection, which each task uses as the default connection. Additional connections can be created to remote server instances as required, with each connection defined with either Windows integrated security or a SQL Server username and password.
Subplans and schedules
Each maintenance plan is defined with one or more subplans, with each subplan having its own tasks and schedule. For example, we can have a weekday schedule containing differential backups and index reorganization with a weekly subplan containing full backups and index rebuilds.
In our example in figure 14.18, we have two subplans, one called Weekday and the other Weekend. The design surface shown is for the Weekend subplan, which is set torun at 11:00 p.m. every Sunday. The Weekday subplan operates Monday through Friday at 1:00 a.m. and has its own design surface and task definition. You can create additional subplans as required by clicking the Add Subplan button on the toolbar.
Figure 14.18. The Maintenance Plan design surface allows the selection and flow control of common database maintenance tasks.
Tasks and precedence
For each subplan, you can click and drag tasks onto the design surface using the Maintenance Plan Tasks toolbox. Tasks available for selection include Back Up Database, Rebuild Index, Reorganize Index, and Check Database Integrity.
Once a task has been added, you can access and customize its properties by double-clicking it. For example, the properties of the Back Up Database Task, as shown in figure 14.19, permit the selection of which databases to back up, the backup location, compression settings, and so forth. One of the nice things about the task properties window is being able to click the View T-SQL button to view how the selected options will be implemented by SQL Server when the OK button is clicked. An alternative to clicking OK is to save (and optionally customize) the displayed T-SQL script for later execution.
When multiple tasks are added, precedence constraints can be added between the tasks to control the execution flow. For example, in the design surface shown earlier in figure 14.18, we set the Failure action of the Check Database Integrity Task (DBCC CHECKDB) to execute the Notify Operator Task, with a successful Integrity check flowing down the left-hand side to execute the Back Up Database and Reorganize Index Tasks. You can add and modify precedence constraints by clicking a task and dragging the green arrow to the appropriate destination task. Once it's connected, you can change the constraint to Error, Completion, or Success by right-clicking the green arrow and selecting the appropriate action.
Figure 14.19. Each task added to the design surface can be customized as required. In this example, the Back Up Database Task is customized to back up all databases.

In addition to the classic maintenance tasks such as backups, integrity checks, and index-related maintenance, plans can be highly customized through the use of tasks such as Execute SQL Server Agent Job and Execute T-SQL Statement. Further, the Maintenance Cleanup and History Cleanup Tasks can be added to control the deletion of old backup files, SQL Server Agent history, and Maintenance Plan reports. These tasks allow a retention period to be specified, which is particularly useful in automatically deleting old disk-based backup files.
Despite the power and flexibility of maintenance plans, some limitations prevent or restrict their use in certain environments. For example, despite the existence of both the Rebuild Index and Reorganize Index Tasks, there's no option to rebuild only if fragmentation exceeds a certain level. As explained in the previous chapter, conditional index maintenance of this sort is important both from a maintenance duration perspective and for controlling the size of the transaction log, particularly when using synchronous database mirroring.
For maximum control over job scheduling and automation, we can use SQL Server Agent jobs.
14.4.2. SQL Server Agent
SQL Server Agent is a component of SQL Server responsible for the scheduled execution of tasks defined within jobs. Creating a maintenance plan will automatically create SQL Server Agent jobs to execute the tasks contained within the subplans. In our earlier example shown in figure 14.18, two SQL Server Agent jobs will be created to support the maintenance plan:[] AdventureWorks Maintenance Plan.Weekday and AdventureWorks Maintenance Plan.Weekend.
[] In addition to scheduled execution via SQL Agent, a maintenance plan can be executed manually by right-clicking it and selecting Execute.
SQL Server Agent jobs can be manually created in SQL Server Management Studio by right-clicking Jobs under SQL Server Agent and choosing New Job. The resultant window allows the specification of a job name and schedule, along with a series of steps, each of which can be defined with success and failure conditions to control the flow of job execution. Each SQL Server Agent job step is created as a particular type; the available types include T-SQL, Operating System, and Integration Services Package.
In chapter 8, we created a SQL Server Agent job with a PowerShell step to automate the evaluation of a policy against a SQL Server 2005 instance. In terms of more traditional database maintenance, common uses for SQL Server Agent jobs include conditional index maintenance, as discussed earlier, and running DBCC checks with options such as ALL_ERRORMSGS, an option not available for selection when using the Check Database Integrity Task in Maintenance Plan Tasks.
In addition to its ability to automate jobs such as backups and index maintenance, SQL Server Agent can be used to generate alerts, an essential component of a successful monitoring regime.
14.4.3. Event alerts
Let's consider some of the undesirable things that may happen to a SQL Server instance at any point throughout the day:
A SQL Server Agent job fails.
A performance counter, for example, Batches/sec, approaches a critical level where performance is known to degrade.
A critical error is raised and written to the SQL Server error log.
Disk drives fill to capacity.
Critical error messages appear in the Windows event log.
As you can imagine, the above list is only a very small selection of all of the possible things that could go wrong, at any time of the day. The problem is magnified when you consider each of these things could occur on any number of the SQL Server instances being managed; consider a site with hundreds of SQL Server instances, which is not uncommon. The point to be made here is that in the absence of an alerting system that automatically detects a variety of events and alerts the appropriate people, the administration technique is either entirely reactive or very inefficient (most likely both).
Fortunately, there are a number of proven techniques for automated monitoring and alerting for SQL Server. Without considering third-party products, the frequently used ones are System Center Operations Manager and SQL Server Agent.
Microsoft System Center Operations Manager
Previously known (and commonly referred to) as Microsoft Operations Manager, or MOM, this product is frequently deployed in organizations with large amounts of server infrastructure under management. When deployed with the optional SQL Server Management Pack, MOM enables the automation of a number of proactive (and reactive) maintenance tasks, including the following:
Regular connectivity checks to any number of SQL Server instances
Disk and database space monitoring
Monitoring and alerts for SQL Agent job failures (or those taking too long to complete)
Replication and database-mirroring health checks
Blocked process checks
SQL Service status checks
The strength of the MOM product offering is the ability to use it not only for SQL Server monitoring but for a wide variety of other Microsoft-based infrastructure features such as Exchange, IIS, BizTalk, and the Windows Server operating system. Thus, it's a widely used option for large Microsoft-centric enterprise environments.
The scope of this book does not allow for coverage of SQL Server monitoring with MOM, so let's turn our attention to how we can use SQL Server Agent to achieve our monitoring and alerting goals.
SQL Server Agent alerts
The starting point for enabling alerts in SQL Server Agent is through the creation of an operator. Operators can be created in SQL Server Management Studio by right-clicking Operators under SQL Server Agent and selecting New Operator. Depending on the required notification method, each operator can be created with a net send, email or pager address.
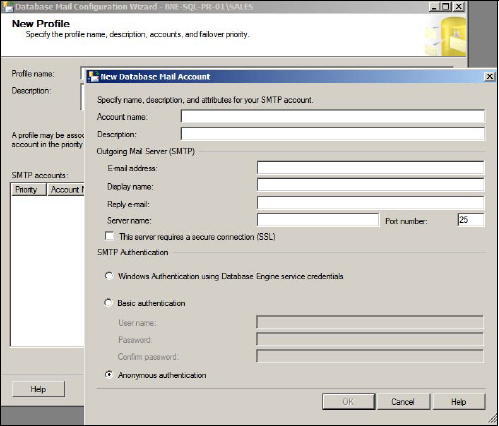
Email alerts are enabled in SQL Server through the use of Database Mail, enabled in SQL Server Management Studio by right-clicking Database Mail under Management and selecting Configure Database Mail. The Database Mail Configuration Wizard then walks you through the required settings, one screen of which is shown in figure 14.20.
Figure 14.20. The Database Mail Configuration Wizard configures the SQL Server instance for sending email and therefore enables you to set up email alerts for job failures and various other events.
Creating operators with the appropriate notification method enables various benefits such as the ability to produce notifications on job failures. For example, as shown in figure 14.21, the Notifications page of the Archive Sales Data SQL Server Agent job is configured to notify Rod Colledge (via email) when the job fails.
Figure 14.21. After creating operators, you can use them for various purposes such as notification of SQL Server Agent job failures.
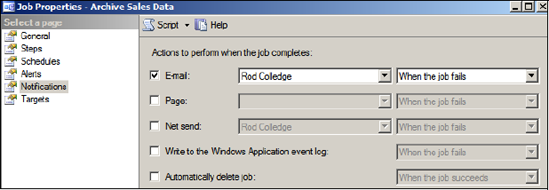
Figure 14.22. You can create alerts for SQL Server events such as deadlocks or for performance counter thresholds such as this one for Batch Requests/sec.

In addition to being notified of job failures, operators can be notified of alert conditions. An alert can be created in SQL Server Management Studio by right-clicking Alerts under SQL Server Agent and selecting New Alert. In the example shown in figure 14.22, we've created a SQL Server performance condition alert for when the Batch Requests/sec performance counter rises above 550.
In addition to creating alerts for performance conditions, you can also create alerts for SQL Server events. One of the recommended tasks for each installed instance of SQL Server is to create alerts for severity 16 and above errors. You can achieve this using the SQL Server event alert type, as shown in figure 14.23.
In addition to severity-based errors, you can create alerts for specific error events. For example, for a deadlock alert, you'd enter 1205 in the Error Number box. Alternatively, you can use error numbers 34050 through 34053 for alerts on policy failures, a topic we covered in chapter 8.
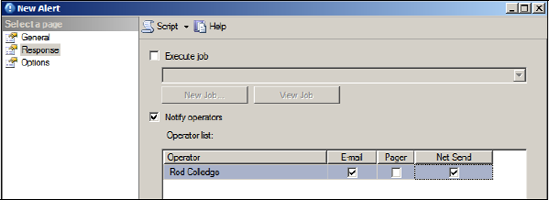
As shown in figure 14.24, the Response page of the Alert properties enables the selection of an operator for alert notification via the appropriate method in addition to providing the option to execute a SQL Server Agent job in response to the alert. In the above example, in addition to alerting an operator, we may decide to execute a SQL Server Agent job that stops nonessential services such as ad hoc reports.
Figure 14.23. An alert definition for level 17 errors. Error levels 16 thru 25 should have individual alerts created.

Figure 14.24. The Response page of an alert enables the selection of operators to notify along with a notification method. In addition to this, we can choose to execute a SQL Server Agent job.
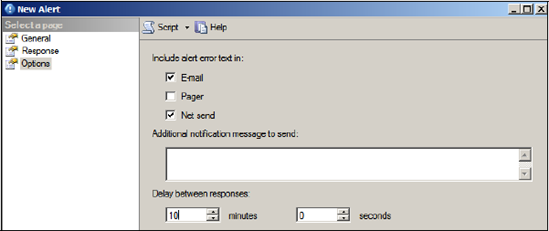
Finally, the Options page, shown in figure 14.25, enables additional options such as the delay between alerts and whether to include the error text in the alert condition.
Figure 14.25. The Options page of an alert enables alert delays and error text inclusion.
Setting up alerts is a basic yet crucial administration technique. Despite this, it's often overlooked, as is the next task, monitoring error logs.
14.4.4. Error logs
Like Windows, SQL Server maintains logs that you can browse for details on both informational and error events. Accessed via Management Studio under the Management > SQL Server Logs path, the Log File Viewer can be opened by double-clicking one of the listed logs.
SQL Server will start a new log each time the instance is started, and by default it will maintain six[] archived logs before overwriting the oldest. Not only does the log file viewer permit viewing of SQL Server information, it also allows the Windows event logs to be viewed through the same interface.
[] This value is configurable up to 99.
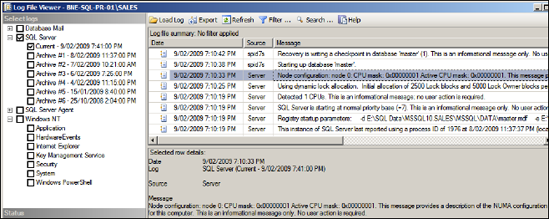
In addition to error events, the SQL Server logs contain valuable diagnostic information, particularly around the startup time. For example, in figure 14.26, you can see the NUMA node configuration is recorded to the log when the instance starts.
Figure 14.26. The SQL Server Log File Viewer enables visibility of a number of logs, including the SQL Server error log and the Windows event logs.
In addition to creating alerts for error conditions, browsing the SQL Server logs for abnormal entries is a basic administration task and one that should ideally be performed on a daily basis. In appendix B, we'll walk through a suggested DBA work plan, which lists recommended daily, weekly, and monthly tasks.