
Chapter 42. Tracing the deadlock
Msg 1205, Level 13, State 45, Line 5
Transaction (Process ID 53) was deadlocked on lock resources with another
process and has been chosen as the deadlock victim. Rerun the transaction.
A deadlock has to be one of the most frustrating error messages that SQL Server can produce. Little information is given as to what went wrong, and the only advice the error message gives is “Rerun the transaction.” It appears that there’s no way to find the root cause and to prevent the mysterious error from occurring.
In truth, there are ways to find information on exactly what happened to cause a deadlock and, with that information, in most cases it’s possible to fix the root cause and prevent the error completely.
What’s a deadlock?
At its simplest, a deadlock refers to a locking situation that, if no outside action is taken, will never resolve itself. It occurs when two or more processes have a lock on a resource and then try to acquire a lock on the resource held by the other process, or when two or more processes hold shared locks on a resource and attempt to convert them to exclusive locks. Figure 1 illustrates an example of a deadlock scenario.
Figure 1. The first and second stages of a deadlock
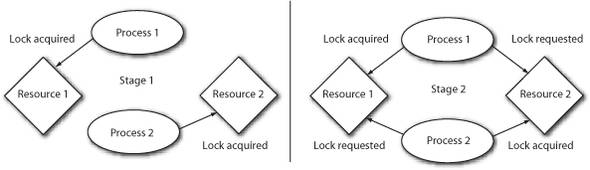
Without intervention, the two processes will wait forever for the resource and they’ll never complete. In order to resolve the situation, one of the processes must be killed and any modifications it made must be rolled back, so that the locks it held are released, allowing the other process to continue. This is the job of SQL Server’s deadlock detector. It evaluates the locks held and locks requested and, if it finds an existing deadlock condition, it picks one of the deadlocked processes and kills it. The process killed by the deadlock detector is known as the deadlock victim.
The selection of the deadlock victim is based on a number of conditions:
- The deadlock priority, if set
- The number of data modifications that will need to be rolled back
- Whether the processes are system processes or user processes
In general, the process with the lowest deadlock priority or the one that’s least expensive to roll back is the one that will be picked as the deadlock victim.
Causes of deadlocks
Deadlocks are typically caused by long-running transactions, or different transactions accessing the same objects in an inconsistent order.
A lack of useful indexes, poorly written code, and hardware bottlenecks can all cause transactions to run longer than they should, resulting in locks held for longer than necessary.
If statements in different stored procedures access tables in different orders (for example, one procedure first updates Table1 and then updates Table2, whereas another procedure first updates Table2 and then Table1), it’s possible for two transactions to be holding a lock on the one object and wanting a lock on the other, resulting in a deadlock.
Isolation levels higher than the default (Read Committed) can also cause frequent deadlocks, as the locks are held longer, or more intrusive locks are held. This is true with the Serializable isolation level.
Deadlock graph
A deadlock graph is a representation of the processes involved in a deadlock, the locks that they held, and the resources that they were using. Deadlock graphs contain all the information needed to diagnose the cause of the deadlock, though not necessarily in a form that’s easy to understand.
You may get a deadlock graph on SQL Server 2005 and SQL Server 2008 in three main ways. SQL Profiler includes a deadlock graph event, and there are two trace flags: 1204 and 1222. Of these, only trace flag 1204 was available on SQL Server 2000.
Trace flag 1204
Trace flag 1204 is one of the oldest ways to view a deadlock graph, and is the only method available on SQL Server 2000 or earlier.
To produce the deadlock graph, the trace flag needs to be enabled server-wide either using the DBCC TRACEON command (DBCC TRACEON (1204,-1)), or by adding the trace flag to SQL Server’s startup parameters (-T1204).
Trace flag 1222
Trace flag 1222 works much the same as 1204 does, in that it writes deadlock information into the error log. The results produced by 1222 are far more detailed and easier to read than those produced by 1204. As such, it’s preferred over 1204 for producing deadlock information on SQL Server 2005 or 2008.
Trace flag 1222 is enabled the same way as 1204 is, by using the TRACEON command (DBCC TRACEON (1222,-1)), or by adding the trace flag to the startup parameters (-T1222).
Note
Despite popular belief, trace flag 3605 doesn’t have to be enabled with 1204 or 1222 to write a deadlock graph into the error log.
SQL Profiler
In SQL Server 2005, the deadlock graph event was added to SQL Profiler. This event produces a graphical view of a deadlock graph that shows the processes, resources, and locks involved in a deadlock. The graph is saved in XML format and can be viewed in Management Studio.
This option requires that a trace be running against the target server. If deadlocks happen frequently, or can be reproduced on demand, this is a good way of getting the deadlock graph. If the deadlocks happen infrequently, it may not be feasible to run the profiler for long periods of time. In that case, trace flags may be a more appropriate option.
Note
The Profiler GUI can cause an undesirable performance impact on a busy server. As such, server-side trace procedures should be used on production servers, and Profiler itself should be limited to development or test environments. Details of the server-side trace procedures are beyond the scope of this chapter. Full details on the sp_trace procedures can be found in Books Online.
Reading the deadlock graph
At a first glance, the deadlock graph produced by trace flag 1222 seems impossibly obtuse and near-impossible to read. In truth, much of the information given can be ignored, and it’s mostly a case of knowing where to look and how to interpret the information given.
In this section, I’m going to walk through a deadlock graph, line by line, pointing out what sections are important and what they mean. Listing 1 shows an example of a deadlock graph (trimmed slightly so that it doesn’t take three pages).
Listing 1. A sample deadlock graph

The first thing to notice about the deadlock graph is that it’s in two sections. First are the processes involved in the deadlock
(indicated by ![]() and
and ![]() ) followed by a list of resources involved in the deadlock (starting at
) followed by a list of resources involved in the deadlock (starting at ![]() ). The resource list includes information on which process owns the lock and in what mode, and which process is waiting for
the lock and in what mode.
). The resource list includes information on which process owns the lock and in what mode, and which process is waiting for
the lock and in what mode.
The process list
In this section, each of the processes involved in the deadlock is listed, along with details about what procedures and queries the process was running at the time of the deadlock.
The line that identifies the process contains a great deal of information of value:
process id=process803294c8 taskpriority=0 logused=316 waitresource=KEY: 6:72057594038845440 (1900f638aaf3) waittime=395 ownerId=29943 transactionname=user_transaction lasttranstarted=2008-10-17T14:25:26.013 XDES=0xa209b3d0 lockMode=S schedulerid=2 kpid=2400 status=suspended spid=53 sbid=0 ecid=0 priority=0 trancount=1 lastbatchstarted=2008-10-17T14:25:26.013 lastbatchcompleted=2008-10-17T14:25:26.013 clientapp=App hostname=S1 hostpid=3476 loginname=S1U1 isolationlevel=read committed (2) xactid=29943 currentdb=6 lockTimeout=4294967295 clientoption1=671088672 clientoption2=128056
The waitresource identifies exactly which lock the process is waiting for. In this case, it’s an index key. The format of the resource for keys is Database_ID:Partition_ID and the value in the brackets is a hash of the index key values. The partition ID is important, in that it can be used to identify the table and schema using a query based on some of the metadata views:
SELECT OBJECT_NAME(o.object_id), SCHEMA_NAME(o.schema_id)
  FROM sys.partitions p
  INNER JOIN sys.objects o on p.object_id=o.object_id
  WHERE partition_id = 72057594038845440
This returns Users in the dbo schema, identifying one of the tables involved in the deadlock.
The lock mode identifies what type of lock was requested. In this process, it’s S, indicating the lock was requested as a shared lock. Typical values here would be S, X (exclusive), U (update), Sch-S (schema stability), and Sch-M (schema modification).
Other useful information includes the spid, clientapp, hostname, and loginname. The spid, or session ID, identifies the session within the SQL Server instance. The clientapp, hostname, and loginname together identify where the query came from and who called it. The hostname is the name of the client machine that issues the request, and the appname is the application that issued the request. If the application is a querying tool (Management Studio or Query Analyzer), solving the deadlock may be as simple as asking the person who ran the query to not do so again.
The isolationlevel indicates what transaction isolation level the query ran under. The higher isolation levels (Repeatable Read and Serializable) have a greater chance of causing deadlocks than the default of read committed, whereas the read uncommitted isolation level is much less likely to cause a deadlock.
The last thing to notice is the transactionname. It reads user_transaction, which indicates that this select was running as part of an explicit transaction. This is important in understanding how and when the locks were taken. An exclusive lock is always held until the transaction is either committed or rolled back.
The most useful section of the graph lists the procedure (if applicable) and the statement start and end offsets for that procedure:
frame procname=WF.dbo.ViewThread line=20 stmtstart=1090 stmtend=1362 sqlhandle=0x03000600b15244168cf9db002b9b00000100000000000000
This section lists the full three-part name of the procedure that the process was running. If the call was ad hoc SQL, rather than a stored procedure, then the procname will read adhoc. The line number indicates on which line of the procedure the specific SQL statement starts. If the line number is 1, it’s a strong indication that the specific SQL statement is a piece of dynamic SQL.
The statement start and statement end values specify the offsets within the procedure where the query starts and ends. The sql_handle can be used with the sys.dm_exec_sql_text DMF to get the SQL statement from the server’s procedure cache. This usually isn’t necessary, as most of the time the statement is reproduced in full in the deadlock graph right below this line.
The input buffer lists either the entire query (for ad hoc SQL) or the database ID and object ID for a stored procedure:
inputbuf Proc [Database Id = 6 Object Id = 373576369]
The object ID can be translated back to an object name using the object name function:
SELECT OBJECT_NAME(373576369, 6)
In this case it returns ViewThread, matching what was shown for the process name earlier in the deadlock graph.
Note
The Object_Name function took only one parameter, the object ID, prior to SQL Server 2005 SP2. From SP2 onward, it accepts an optional second parameter, the database ID.
The second process listed in the deadlock graph contains the same information and can be read in much the same way. I won’t go through it all in detail, as many of the explanations given for the first process apply to the second as well.
The second process has a different waitresource than the first one did. In the case of the key lock, it was trivial to identify the table involved. The second process was waiting on a page lock.
process id=process809f8748 waitresource=PAGE: 6:1:351 spid=55
The numbers listed for the page indicate database ID (6), file ID (1), and page ID (351). The object that owns the page can be identified using DBCC PAGE, but in this case, it’s not necessary, as the name of the table is given later in the deadlock graph in the list of resources. If DBCC Page were to be used, it would show that the page 6:1:351 belongs to a table with the ID 85575343. Using the Object_Name function reveals that the table’s name is Threads.
The procedure that the second process was running is WF.dbo.ViewForum and the statement began on line 9.
DBCC Page
DBCC Page is an undocumented but well-known command that shows the contents of database pages. The command takes four parameters, the last being optional. The first three are the database ID or database name, the file ID, and the page ID. The last parameter indicates the print options.
Among the information that can be retrieved from the file header is the object and index that the page belongs to (if it’s a data or index page).
To return the results to a query window, trace flag 3604 has to be enabled. An example use of DBCC Page would be
DBCC TRACEON (3604)
DBCC PAGE (1,1,215,0)
DBCC TRACEOFF(3604)
By this point, we have a fairly clear idea as to what was happening when the deadlock occurred.
The process with a session ID of 53 requested a shared lock on the index key 6:72057594038845440 (1900f638aaf3), in the Users table, so that it could run a select that starts on line 20 of the procedure ViewThread. The second process, with a session ID of 55, requested a shared lock on the page 6:1:351 belonging to the Threads table so that it could run a select that starts on line 9 of the procedure ViewForum.
The resource list
What we don’t know yet is what locks these two processes were holding when the deadlock occurred. That’s where the third part of the deadlock graph—the resource list—comes in. The resource list lists all of the locks involved in the deadlock, along with which process had them and which process wanted them.
The first entry in the resource list refers to the key lock on the primary key of the Users table. We know, from the first section of the deadlock graph, that this is what session ID 53 was waiting for:
keylock hobtid=72057594038845440 dbid=6 objectname=WF.dbo.Users indexname=PK__Users id=lock800c0f00 mode=X associatedObjectId=72057594038845440
    owner-list
     owner id=process809f8748 mode=X
    waiter-list
     waiter id=process803294c8 mode=S requestType=wait
Process process809f8748, which is session ID 55, owned that lock in exclusive mode. Process process803294c8 requested the lock in shared mode and had to wait.
The second entry in the resource list refers to the page lock on the Threads table. We know from the first section that this is what session ID 55 was waiting for:
pagelock fileid=1 pageid=351 dbid=6 objectname=WF.dbo.Threads id=lock83255f80 mode=IX associatedObjectId=72057594038910976
    owner-list
     owner id=process803294c8 mode=IX
    waiter-list
     waiter id=process809f8748 mode=S requestType=wait
The process process803294c8, which is session ID 53, owned that resource in intent-exclusive mode and hence process process809f8748 (session ID 55) had to wait.
Note
An intent-exclusive (IX) lock is taken by a process before an exclusive lock and at a lower level of lock granularity, and is taken to signal the intention to take an exclusive lock; hence the name.
The two most common values for requestType are wait and convert. A value of wait indicates that a new lock has been requested; convert indicates that the process already has a lock on that resource in one mode and requested to convert the lock into a different mode. A typical example would be when a process has a shared lock and wishes to convert it to exclusive. The conversion can only occur if there are no locks on the resource that are incompatible with the new lock mode—for example in the repeatable read isolation level, where a row is selected and then updated within a transaction.
The big picture
Now the full picture of the events that lead up to and resulted in the deadlock is clear.
The process with a session ID of 53, while running the procedure ViewThread, began an explicit transaction and did a data modification on the Threads table. Later in the same transaction, it tried to do a select on the Users table, which was blocked. The second process, session ID 55, ran the procedure ViewForum. Within the procedure, it began an explicit transaction and did a data modification on the Users table. Following that, it attempted to run a select on the Threads table, which was blocked.
This deadlock turns out to be a case of objects accessed in different orders from different places. Although fixing the code is beyond the scope of this chapter, it turns out that reordering the queries in one of those procedures, so that the objects are accessed in the same order in both, prevents the deadlock completely.
Changing the isolation level to Snapshot or Read Committed Snapshot will also prevent the deadlock, because in the optimistic concurrency model, writers don’t block readers. Again, a discussion on snapshot isolation is beyond the scope of this chapter.
Summary
The deadlock graph is the key to understanding and resolving deadlocks. The list of resources locked shows the state of events before the deadlock. The information provided about the process’s state at the time of the deadlock, including locks requested and the process’s input buffers, shows the cause of the deadlock clearly.
About the author

Gail is a database consultant from Johannesburg, South Africa, specializing in performance tuning and database optimization. Before moving to consulting, she worked at a large South African investment bank and was responsible for the performance of the major systems there.
She was awarded MVP for SQL Server in July 2008 and spoke at both TechEd South Africa and the PASS Community Summit in Seattle in the same year. She’s a frequent poster on the SQLServerCentral forums and has written a number of articles for the same site.