CHAPTER 7
Risk, Response, and Recovery
In this chapter, you will learn about
• The definition of risk
• Threat sources, threat events, and vulnerabilities
• Impact assessments and sharing threat intelligence
• Different methods of managing risk
• The definition of residual risk
• Risk registers and the Common Vulnerability Scoring System
• Common risk management frameworks
• Risk assessments and threat modeling
• Differences between quantitative and qualitative risk analysis
• Common steps in risk assessments
• Common phases in the incident lifecycle
Defining Risk
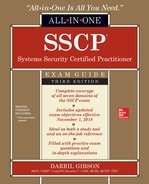
The simple definition of risk is the probability or likelihood that a threat will exploit a vulnerability and cause a loss. A threat is any activity that can be a possible danger. A vulnerability is a weakness, and a loss represents a negative event for an organization. Figure 7-1 shows these components and their relationships with each other.
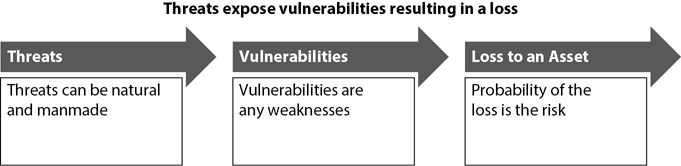
Figure 7-1 Components of risk
A common formula used to represent risk is
Risk = Threat × Vulnerability
This formula isn’t a mathematical algorithm. However, it does show the relationship between threats and vulnerabilities and risk. Small threats and insignificant vulnerabilities result in a low level of risk. More severe threats and serious vulnerabilities result in a higher level of risk.
When the threat and the vulnerability are combined (a threat exploits a vulnerability), it results in a loss. More significant threats or vulnerabilities can easily result in higher losses from the risks. In other words, some risks have higher impacts. However, if you can reduce the vulnerabilities, you reduce risk, resulting in lower potential losses.

TIP It’s rarely possible to reduce threats. You can’t stop an attacker from attacking, but by reducing vulnerabilities, you reduce the attacker’s chances of success. In other cases, you can reduce the impact of the risk to limit losses.
For example, malware represents a threat to any computer. If a computer does not have antivirus (AV) protection, it is vulnerable to malware threats. If a virus infects an unprotected system, it can modify, destroy, or steal data, representing a loss to the owner of the computer. An organization can mitigate, or reduce, the vulnerability by using AV software, keeping it up to date with current antivirus signatures, and training users on how to avoid threats.

EXAM TIP Risk is the probability or likelihood that a threat will exploit a vulnerability and cause a loss. Risk mitigation is the practice of reducing risk. The primary method of reducing risk is to reduce or eliminate vulnerabilities by implementing safeguards or security controls. It’s also possible to reduce risk by reducing the impact of the risk.
Total risk is the combined risk to all of the organization’s assets, including all the threats and vulnerabilities. Total risk also includes the value of these assets.
NIST SP 800-30, Guide for Conducting Risk Assessments, provides a more comprehensive definition of risk. It defines risk as “a function of the likelihood of a threat event’s occurrence and potential adverse impact should the event occur.” It also mentions that a threat source initiates a threat event, which exploits a vulnerability, causing an adverse impact. Figure 7-2 shows the risk model outlined in NIST SP 800-30, and the following list explains these elements:

Figure 7-2 Risk model
• Threat source A threat source is anyone or anything that can initiate a threat event. As an example, an attacker is an adversarial threat source.
• Threat event A threat source initiates a threat event. For example, an attacker can launch a SQL injection attack against a web server. The attacker is the adversarial threat source, and the SQL injection attack is the threat event.
• Vulnerability The extent of the threat event is related to the extent of the vulnerability. For example, if a website doesn’t use input validation techniques, it is more vulnerable to a SQL injection attack than a website that does use input validation techniques. Security controls, such as input validation techniques, reduce vulnerabilities.
• Adverse impact An adverse impact affects the confidentiality, integrity, and/or availability of IT systems or data, and in some cases can affect the image and reputation of the organization.
TIP Chapter 1 presented the concepts of confidentiality, integrity, and availability (CIA). To recap, maintaining confidentiality means that unauthorized individuals don’t have access to data or systems. Maintaining integrity means that unauthorized individuals can’t modify data and systems. Maintaining availability means that data and systems are up and operational when needed.
While the SP 800-30 definitions and explanations are more technical, they do repeat the common themes of threats, vulnerabilities, impacts, and losses.
Identifying Threat Sources
While it’s common to think of an attacker as a threat source, there are several other threat source types. NIST SP 800-30 categorizes them as adversarial, accidental, structural, and environmental:
• Adversarial threat sources Adversarial threat sources include individuals (internal or external) or groups that purposely attempt to exploit weaknesses. They are often referred to as threat actors. Internal threats are from malicious employees, contractors, or any other personnel granted access to an organization’s resources and have the capability of launching an attack from within. External threats are from entities that don’t have direct access to the organization’s resources, such as attackers in a different city or country. Groups include both loose-knit groups of attackers and highly organized attackers (such as state-sponsored advanced persistent threats). Groups can also include competitors, suppliers, partners, and criminals.
• Accidental threat sources Accidental threat sources include erroneous actions taken by individuals in the course of executing their everyday responsibilities. For example, a user can ruin a laptop simply by spilling coffee onto the keyboard. Similarly, if someone accidentally kills the power or cuts communications cables to key systems, it results in a loss of availability. Users can accidentally cause damage to data, and the level of damage they cause is directly related to their level of access. Regular users have limited access to resources, so they can only cause a limited amount of damage (such as accidentally deleting some of their files). Privileged users such as administrators have much more access, so they can accidentally cause much more damage (such as deleting an entire customer database). While IT security topics often stress intentional threats, it’s important to realize steps need to be taken to protect assets from accidental threats also.
• Structural threat sources Structural threat sources include failures of IT equipment, environmental controls, and software. As an example, if the environmental controls fail in a data center resulting in a loss of air conditioning, it can result in damaged equipment. Without air conditioning, servers get hot, and they can overheat and fail. Because of this, many organizations will power down servers when air conditioning fails. This protects the equipment, but also results in an immediate loss of availability.
• Environmental threat sources Environmental threat sources include natural and manmade disasters. Natural causes include weather events such as lightning storms, hurricanes, tornadoes, and floods, and can include nonweather events such as earthquakes or tsunamis. One example of a manmade disaster is a fire. Environmental threat sources also include failure of external services such as a telecommunications link, or power outages.
TIP Appendix D in SP 800-30 includes additional information on threat sources, including several tables listing threat sources and sample assessment scales used to categorize them.
Identifying Threat Events
Threat events include any type of activity or event that can result in a loss of confidentiality, integrity, or availability to a system. SP 800-30 matches threat events with threat sources to identify threat scenarios. A threat scenario is one or more threat events, caused by one or more threat sources, that cause an adverse impact.
Many times, you’ll see the threat source and threat event combined as simply a threat. However, when performing risk assessments, security professionals often separate the two so that they can more accurately identify who the threat is (the threat source) and what they might do (the threat event).
NIST SP 800-30 includes an extensive list of potential adversarial threat events, grouped into several categories. These categories focus on known attack methods and activities, and the following list includes some of them:
• Perform reconnaissance and gather information Adversaries use a variety of techniques to learn more about their target. These techniques include gathering information from public sources and using tools such as sniffers and scanners to gather technical information. Attackers often try to trick users into installing malware on their computers. When successful, it allows the attacker to remotely control the computer and perform reconnaissance on the infected computer’s internal network. These attacks from within the organization become more difficult to track because most detection tools focus on attacks coming from outside the organization.
• Craft or create attack tools Attackers create a wide variety of different attack tools. For example, they often use phishing attacks (including spear phishing and whaling attacks) to collect information and trick users into installing malware on their systems. They have been quite creative in their methods, including spoofing e-mails to appear to originate from funeral homes, delivery services, and more. Their goal is to get the user’s interest. To complement these methods, attackers develop malware, which they include as attachments.
• Deliver/insert/install malicious capabilities Once attackers create the malware, they find ways to get the malware installed on user systems. Attackers often take the time to analyze methods that have worked before and create similar methods. For example, many users don’t recognize the risk of opening a ZIP file, so attackers often embed malware within ZIP files, which they send as attachments with phishing e-mails. They have also attacked websites and installed malware on them. The malware then attempts to download itself automatically when users visit.
• Exploit and compromise Exploits include both technical and nontechnical methods. For example, social engineers circumvent physical security methods by tailgating closely behind authorized individuals to access secure locations. Technical methods exploit known vulnerabilities in unpatched systems. Additionally, attackers are always on the alert for zero day vulnerabilities that don’t have patches. Many exploits allow attackers to assume control of compromised systems from remote locations.
• Achieve results (such as causing adverse impacts and obtaining information) Once attackers successfully exploit systems, they go after their target. This is often to obtain sensitive information from the victims, cause damage to the systems, and/or infiltrate a network to steal data. Adverse impacts include any results that affect the confidentiality, integrity, or availability of systems and data.
• Maintain a presence or set of capabilities Once attackers are within a system or network, they take steps to obscure their actions. This includes using methods to bypass or circumvent intrusion detection systems and auditing capabilities. Security firm Mandiant has documented several cases where an advanced persistent threat (APT) maintained a presence within networks for several months and sometimes for several years.
It’s worth stressing that the previous list does not include all threat events. Attackers have a wide variety of methods they use to attack organizations. As security professionals find ways to thwart these attacks, attackers modify their methods using new and modified attacks.
Understanding Vulnerabilities
Vulnerabilities are any weaknesses in a system, network, infrastructure, or organization. A vulnerability can also be the absence of a security control or countermeasure. For example, a firewall protects systems and networks from Internet threats. A network without a firewall indicates a vulnerability. NIST SP 800-30 defines a vulnerability as follows:
A vulnerability is a weakness in an information system, system security procedures, internal controls, or implementation that could be exploited by a threat source.
If a threat can exploit these weaknesses, it results in a loss. Some examples of vulnerabilities include the following:
• Poor or nonexistent AV protection Computer systems need antivirus software with up-to-date virus signatures. If systems don’t have AV protection, malware can infect them, resulting in costly losses.
• Terminated employees If employee accounts are not disabled or deleted after an employee is terminated, the account can be used to attack a system. The employee may be able to access the system and cause damage, or another employee may use the account to perform actions. If another employee accesses the account, logs will inaccurately attribute the actions to the terminated employee.
• Weak access controls Access controls include identification, authentication, and authorization techniques. Weak access controls allow unauthorized individuals to access, modify, and/or destroy data.
• Poor or nonexistent change-management practices An unintentional side effect of making a change to a system is that the change causes one or more problems. Strong change-management practices examine prospective changes to predict the side effects and can mitigate problems caused by changes.
• Poor hardening practices Systems should be hardened, or made more secure from their default configuration. This includes changing defaults such as default passwords, implementing firewalls, keeping operating systems and applications up to date with patches, and more.
• Lack of redundancies for key systems Any single point of failure can result in an outage of an entire system if it fails. Administrators can add redundant technologies for disk drives, servers, communication lines, power, air conditioning, and even entire sites or locations. Adding redundancies allows systems to tolerate faults. For example, if a single drive in a RAID-6 array fails, the disk subsystem can tolerate the fault and continue to operate.
• Uneducated users Social engineers can trick uneducated users into giving up key information. On the other hand, social engineers aren’t as successful when they try to trick educated users. Similarly, educated users are less likely to be tricked into installing malware onto their system by opening attached files or clicking links in malicious e-mail.
TIP The preceding list is by no means complete, but it does provide some common examples of vulnerabilities. An important point to remember about any vulnerability is that you can reduce weaknesses by implementing controls or safeguards. By reducing the vulnerabilities, you reduce the possibility of the risk resulting in a loss.
It’s worth mentioning that an organization doesn’t necessarily have to eliminate all vulnerabilities. For example, some legacy systems might be critical to the business, but include known vulnerabilities that cannot be mitigated. Similarly, some patches adversely affect applications. While testing a patch, administrators might detect the problem and report it to management, and management might decide to accept the risk of leaving the system unpatched.
Threats often exploit the weakest link in your organization, and once a threat exploits a vulnerability, the damage is done. A key method used to minimize losses is to identify and reduce vulnerabilities.
Understanding Impact Assessments
The probability that a threat can exploit a vulnerability provides the likelihood of occurrence. However, it’s also important to examine the potential impact of the risk occurring as part of an impact assessment. The impact refers to the magnitude of harm that could result if a threat exploits a vulnerability. You can identify the magnitude of harm by estimating the potential loss of confidentiality, integrity, or availability. In some cases, the impact is negligible, making the risk a low priority. In other cases, the impact is quite high, making the risk a very high priority.
Consider the risk of a fire. Overall, if personnel within an organization use safe practices, the risk of a fire is low. Fires do occur, so organizations often install fire detection and fire extinguishing equipment to automatically detect and extinguish a fire. Still, if these methods fail, a fire can destroy most of the contents of a building in a very short time. The impact can be catastrophic. In this case, the likelihood of occurrence for a fire is low, but the potential impact is high, so organizations purchase insurance to reduce the overall risk by reducing the impact.
In contrast, consider the likelihood that students in a classroom might steal a $10 mouse. The mice might be easy to remove and hide in a book bag, so the likelihood might be high. However, the impact of the loss is very low, so the overall risk is low.
Risk assessments consider the impact of the risk, although they use different methods such as quantitative and qualitative risk analysis methods. A quantitative risk assessment uses costs and monetary values to identify the impact. A qualitative risk assessment uses subjective opinions of experts to identify the impact. Both are covered later in this chapter.
Sharing Threat Intelligence
Cyber threat intelligence includes information that organizations can use to identify, assess, monitor, and respond to potential threats. It typically includes tactics, techniques, and procedures (TTPs) used by threat sources along with methods to detect known attacks. When organizations share this threat intelligence appropriately, both inside and outside the organization, they have a better chance of gaining knowledge from each other and thwarting more attacks.
In contrast, imagine that one organization is successfully attacked. Security professionals within the organization eventually discover the attack and take steps to stop it along with methods to detect, contain, and prevent a recurrence of the attack. However, management decides to keep this intelligence private within the organization. There are two drawbacks to this decision. First, criminals can use the same TTPs to successfully attack other organizations. Second, criminals are likely to slightly modify their TTPs in future attacks and may be doing so already. The organization that doesn’t share its intelligence is unlikely to hear about intelligence shared by other organizations about these modified attacks.
NIST SP 800-150, Guide to Cyber Threat Information Sharing, provides some basic guidelines and recommendations related to sharing information on cyber threats. The following list summarizes some of these as paraphrased recommendations:
• Establish goals and objectives related to information sharing These goals and objectives should support businesses processes and security policies.
• Identify internal sources that have cyber threat information These include the tools and sensors used to collect information, and the tools that collect, collate, and analyze the data, converting into actionable intelligence.
• Specify the scope of information sharing It is rarely useful for an organization to share all internal information. Instead, an organization should identify the types of information it is willing to share.
• Establish rules related to information sharing Rules or guidelines identify when this information should be shared and who can authorize the release outside of an organization.
• Participate in information sharing efforts It is useful to identify public and private communities, government repositories, and commercial sites that routinely provide information on cyber threats, and other sources that provide information on cyber threats.
• Provide feedback to add context, corrections, and/or improvements Organizations that actively seek to enrich the data on TTPs help mature and improve the overall worth of the data to all.
• Protect the security and privacy of sensitive data When sharing threat intelligence, organizations should still maintain the confidentiality of any sensitive data.
While the previous list obviously doesn’t cover all 43 pages of SP 800-150, it does give an overview of some of the important concepts. Some organizations will have more data to share than others.
An obvious question is “Who should an organization share their threat intelligence with?” Interestingly, SP 800-150 doesn’t spell this out clearly, but that does add credibility to the document. It’s published by a U.S. government entity, so it could easily recommend sharing your data with the Federal Bureau of Investigation (FBI), the Central Intelligence Agency (CIA), or the Department of Homeland Security (DHS). It doesn’t.
However, SP 800-150 does mention that many public and private sharing communities exist. A community might be “based on geographic region, political boundary, industrial sector, business interest, or threat space” (such as one focused on phishing attack threats). Sharing partners could be vendors, service provides, industry sector peers, supply chain partners, business partners, law enforcement agencies, and, yes, government agencies. Appendix A includes seven different scenarios related to cyber threat information sharing.
The cyber security community has developed several technical specifications designed to enable automated sharing of threat intelligence data. The following list describes three standards that organizations might use:
• Trusted Automated eXchange of Indicator Information (TAXII) TAXII provides definitions for services and message exchanges. It doesn’t provide standards on what data to provide, but instead identifies methods to share data. Interested parties can poll TAXII servers to download data or use subscriptions to automatically receive data. TAXII servers also allow entities to upload data to various intelligence categories.
• Structured Threat Information eXpression (STIX) STIX provides a standardized, structured language to represent cyber threat intelligence. The language allows personnel to report on active attacks, targets, threat indicators, threat, actors, and TTPs. STIX exchanges this data using TAXII services and messages.
Managing Risk
Risk management attempts to identify, assess, and mitigate risk to an acceptable level for the organization. As previously discussed, two key components of risk are threats and vulnerabilities, so these are key components to address when attempting to manage risk. It’s important to realize that risk management is an ongoing process. Threats constantly change and evolve, and risk management practices need to change and evolve with them.
It isn’t possible to reduce the overwhelming majority of threats. However, you can reduce vulnerabilities and reduce the impact of threats. For example, you can’t stop a hurricane or an earthquake. However, you can reduce the impact of these natural threats by taking additional precautions, such as building stronger buildings or simply building them outside of a threat zone. Similarly, you can’t stop an attacker from trying to launch attacks against your organization, but you can take steps to reduce the attacker’s possibilities of success by strengthening security practices and reducing vulnerabilities.
Risk Treatment
Overall, an organization can select from several choices in response to different risks. Figure 7-3 shows these choices, and the following list describes them:
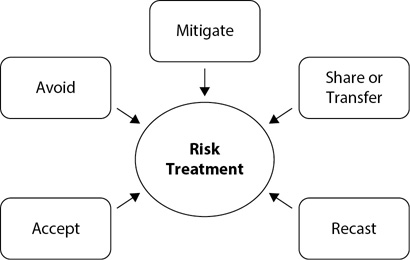
Figure 7-3 Risk treatment
• Mitigate You mitigate a risk by reducing vulnerabilities, and you reduce vulnerabilities by implementing controls or safeguards. For example, you can add AV software to reduce the risk of malware infection. You can add intrusion detection systems to detect and prevent network attacks from penetrating your network.
• Avoid You can avoid a risk by simply avoiding the activity that introduces the risk. For example, if you want to avoid the risks of a hurricane, you can move your location to an inland location. If you want to avoid risks associated with hosting a website on the Internet, you can choose not to host a website.
• Share or transfer You can share a risk with another party, or transfer the risk to another party. The most common method of transferring a risk is with insurance. For example, you can purchase fire insurance, and if a fire destroys a building or a business, the insurance company covers the loss. It isn’t always possible to transfer all responsibility of the risk to another party. For example, buying insurance might help an organization cover some losses, but the insurance doesn’t necessarily cover all the losses.
TIP Previous documentation listed transfer as a risk management method but did not include share. However, that has been changing in recent years. Many security professionals recognize that it often isn’t possible to transfer the entire risk, but it is possible to transfer some of it, or share the risk with an outside entity. For this reason, this option has changed from transfer to share or transfer.
• Accept You can also choose to accept the risk and its potential losses. This is appropriate when the asset value is low or if the cost to reduce the risk is higher than the value of the asset. For example, someone may steal a mouse, but the cost of securing mice to prevent theft is higher than the cost of the mice. Additionally, it’s appropriate to accept the remaining risk after taking steps to reduce the risk to an acceptable level.
• Recast A newer risk treatment mentioned in the SSCP objectives is to recast a risk to a different severity. As an example, security professionals within an organization may have previously decided to accept a risk. However, based on current threats, they’ve decided to recast it to a more severe risk and implement controls to mitigate the risk. Another use of recasting is to downgrade the risk. For example, management may decide a risk isn’t as great a threat as previously deemed and recast it to a lower level.
Residual Risk
Residual risk is the amount of risk that remains after mitigating, or reducing, risk. In other words, total risk – mitigated risk = residual risk, as shown in Figure 7-4. It’s important to ensure that residual risk is at an acceptable level to the organization. If the residual risk is too high, then the organization needs to find additional security controls to reduce the risk.
Figure 7-4 Residual risk
An old saying is that the only way to keep a computer 100 percent safe is to never plug it in and turn it on. Of course, the computer isn’t very useful in this state. Instead, management decides what controls to implement to reduce the risk to an acceptable level. These decisions result in mitigating some risks and accepting other risks.
With this in mind, it’s important to remember that management is responsible for any residual risk. Additionally, management is responsible for any losses associated with residual risk. Management chooses which mitigation methods to implement and which methods to reject. Their goal is to reduce risk to an acceptable level based on the needs of the organization.
EXAM TIP Residual risk is the risk that remains after reducing risk to an acceptable level. Management is responsible for approving (or rejecting) controls that can mitigate risk. Management is also responsible for any losses resulting from residual risk.
Of course, different organizations have different risk levels. A company that takes anglers out fishing won’t intentionally go into a war zone. However, a naval warship will intentionally go into harm’s way when necessary, even though the crew will take steps to reduce risk.
Management has an overall view of the entire organization, including understanding the organization’s mission and vision. Security personnel won’t necessarily know all the reasons why management might decide to implement one control to reduce a risk but reject another control and accept a different risk. Still, the key is that management is responsible for making these decisions, and is responsible for any losses resulting from residual risk.
Identifying Assets
An important step in risk management is identifying an organization’s valuable assets. Assets with high value to the organization need to be protected by implementing controls or safeguards to reduce risks. While this seems obvious, it’s not always apparent to security professionals what assets the organization considers to be of the highest value. For example, a web server that looks just like any other server in the server room may be quietly generating thousands of dollars an hour in revenue. Technicians working in the server room might not recognize the server’s value and instead prioritize other servers during a security incident.
Assets are valued using both tangible and intangible values. For example, consider a company that sells products via a website and generates an average of $6,000 an hour. If the website goes down for an hour, the company loses $6,000 in direct, tangible revenue. However, many other intangible losses aren’t so apparent. Customers who visited the website while it was down may choose to shop at another company. These lost customers represent intangible losses. This includes the money expended to attract these customers and the loss of future sales to these customers. It also includes the money required to gain new customers. If a company suffers a sustained or highly public loss, it needs to expend advertising dollars to regain customer goodwill. Otherwise, even customers unaffected by the outage may choose to go elsewhere.
Of course, there’s no need to waste time evaluating risk if an asset has very little value to an organization. It’s relatively inexpensive to replace low-value assets if necessary, so they don’t require much time or energy to protect.
Risk Visibility and Reporting
A key element of risk management is risk visibility and reporting. Ideally, an organization will be aware of the risks that threaten the organization’s resources, but it does take time and effort to identify those risks. Processes such as risk assessments help identify these risks so that the risks are known and visible. Continuous monitoring systems such as antivirus software, data loss prevention (DLP) systems, firewalls, and instrusion detection systems monitor the resources and create reports or alerts when they detect problems.
Risk Register
A risk register (or risk log) is a central depository for known organizational risks and is a key method used to share threat intelligence. The risk register includes details about the known risks and can consolidate data from multiple sources. Table 7-1 shows a sample table of a risk register for a web server hosting an e-commerce site. It shows sample threats along with estimated values for the probability of each of the threats occurring and the impact if it does occur. The risk score is the product of the probability and impact columns and helps security professionals prioritize the risk.

NOTE Chapter 5 covers various attacks, including SQL injection and buffer overflow attacks. It also includes methods to mitigate these attacks, such as input validation and keeping systems up to date with current patches.
Table 7-1 quickly shows that the greatest risk of those listed is a buffer overflow attack, with a score of 56. The table also shows what controls are in place. Because input validation is being used to prevent a SQL injection attack, the risk score is relatively low. If input validation methods weren’t in place, the score would be much higher.
While Table 7-1 is limited by the width of the book’s page, actual risk registers don’t have the same limitations. It’s easy to additional columns, such as the following:
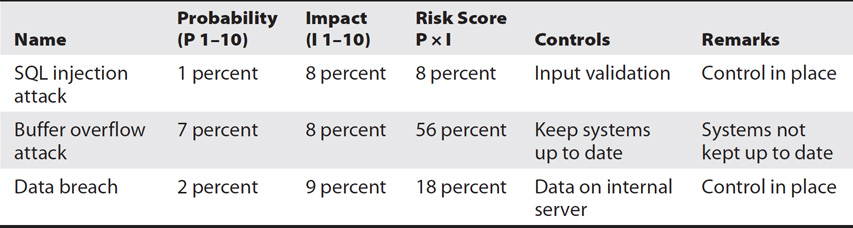
Table 7-1 Sample Risk Register
• Description Full descriptions of the risks so that personnel using the risk register understand them.
• Planned controls These are any controls that management has approved but have not been implemented yet.
• Risk score with planned controls Experts can predict the probability and impact of the risk with planned controls in place.
• History of attacks This column can provide links to an additional table that documents past attacks, along with explanations of how they were successful and what was implemented after the attacks.
• Incident response This provides details on the best response to the incident to mitigate losses.
An organization can create its own internal risk register, but there are also publicly available risk registers that are quite comprehensive. Chapter 6 mentioned the Common Vulnerabilities and Exposures (CVE) list. This is a standardized list of known exploits, security vulnerabilities, and malware organized as a massive dictionary. It provides standardization for naming vulnerabilities and exposures. The National Vulnerability Database (NVD) includes CVE data plus much more, such as checklists, alerts, and vulnerability notes. Both the CVE and NVD are types of risk registers.
Common Vulnerability Scoring System
The Common Vulnerability Scoring System (CVSS) is an open standard that organizations can use to assess the severity of computer system security vulnerabilities. It outlines values for metrics that can then be plugged into a formula to determine the severity of any vulnerability. CVSS v3.0 was released in June 2015.
A CVSS assessment evaluates multiple areas and gives a numerical score between 0 and 10, with a score of 10 indicating the most severe vulnerability. These scores are based on several different metrics within several metric groups. The Base metric group includes both exploitability metrics and impact metrics.
• Exploitability metrics This group includes: an attack vector that evaluates how a vulnerability can be exploited (such as a local account, an adjacent network, or a network); an attack complexity that evaluates how easy or difficult (measured as Low or High) it would be to exploit the vulnerability; and privileges required.
• Impact metrics The impact is evaluated based on potential loss of confidentiality, integrity, or availability. Each area includes a value of None (no loss), Low (partial loss), or High (complete loss).
Each of the word values are preassigned numerical values as scores. For example, an attack complexity of Low is assigned a score of .777 and High is .44. Once the values are determined for a vulnerability, they are plugged into a formula to produce the relative score.
The CVSS also includes a temporal metric group and an environmental metric group. These are combined with the base metric group.
Temporal metrics evaluate the vulnerability at different times. For example, the risk is very low when an exploit is only a theory but very high when malware is in the wild and actively exploiting the vulnerability. Similarly, the risk is very high if there is no patch or other solution to mitigate the threat, but lower if a vendor has released a patch.
Environmental metrics assess the severity of the vulnerability within the environment. As a simple example, the base and impact metrics may be very high for a vulnerability on Linux systems running a specific application. However, if the only systems running the exploitable application are within isolated laboratory settings, this gives the vulnerability a very low score. In contrast, if the organization was running the application on dozens of servers accessible via the Internet, the environmental metric would be very high.
Risk Management Frameworks
A risk management framework provides a structured process that organizations can use to manage risk for IT systems. Two frameworks that are often used by organizations are NIST SP 800-37, Guide for Applying the Risk Management Framework to Federal Information Systems, and ISO 31000:2018, Risk Management – Guidelines, published by the International Organization for Standardization. NIST SP documents are published by the U.S. government and freely available to anyone. Documents published by ISO can be purchased from the ISO website (https://www.iso.org).
Both frameworks refer to the process of identifying, evaluating, and selecting security controls. NIST SP 800-53, Security and Privacy Controls for Federal Information Systems and Organizations, provides a comprehensive listing of various security controls.
NOTE ISO may look like a typo for the International Organization for Standardization. However, it isn’t an acronym but instead an abbreviation of the word isos, which means equal.
NIST SP 800-37
“Risk Management Framework (RMF)” (as identified in 800-37) provides a comprehensive six-step approach for managing risk within federal information systems. While it is focused on U.S. federal systems, any organization can apply the framework based on its needs.
Figure 7-5 and the following list show the six steps discussed in SP 800-37. Each of these steps is applied to a single information system. Additionally, it is an ongoing process.
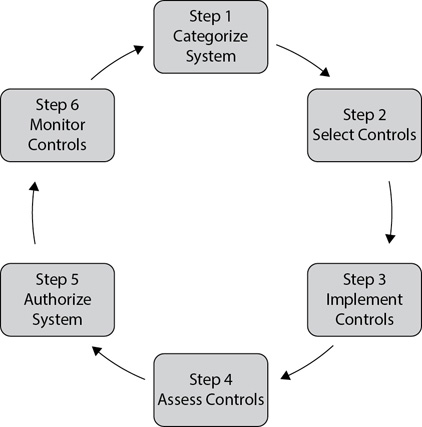
Figure 7-5 Risk Management Framework steps from SP 800-37
• Step 1: Categorize the information system Personnel within the organization evaluate the information system, along with the data that it processes, stores, and transmits. While an organization can use any internally defined categories, they can be as simple as Unclassified, Confidential, Secret, and Top Secret, based on the data that the system processes, stores, and transmits. The information system owner is responsible for this step.
• Step 2: Select security controls Next, personnel identify and evaluate common security controls that typically apply to the identified category. They then select appropriate security controls and develop a continuous monitoring strategy to assess the effectiveness of the controls. Last, they document and obtain approval of the security plan.
• Step 3: Implement security controls In this step, personnel implement the security controls. They also update the security plan by documenting the security control implementation. This typically includes a functional description of the control, along with planned inputs, expected behavior, and expected outputs.
• Step 4: Assess security controls In this step, personnel assess the effectiveness of the security controls based on the procedures identified in the security plan. Next, they create a security assessment report documenting their findings. If the security controls are not performing as expected, personnel identify remedial actions and add recommendations to the assessment report.
• Step 5: Authorize the information system Next, personnel create a plan of action and milestones based on the security assessment report. They use this to submit a security authorization package to the system owner for approval. System owners then determine the risk that remains after the controls are implemented. If system owners determine that the risk is acceptable, they can choose to authorize the system and accept the remaining risk.
• Step 6: Monitor security controls In this step, personnel evaluate system and environment changes using standard change management processes. They perform ongoing security control assessments and make recommendations for remediation actions as appropriate. Any changes or updates are documented in the security plan, the security assessment report, and/or the plan of action and milestones, as appropriate.
This entire process can be repeated as necessary. For example, if a system will be processing different types of data, it may need to be recategorized. Similarly, if different security controls are implemented, they need to be evaluated, assessed, and monitored.
ISO 31000
ISO 31000:2018 includes a principles clause and a process clause that should be followed during the risk management process. The principles clause includes principles such as continual improvement, integrated, structured and comprehensive, and more. The process clause includes processes for risk assessments, risk treatment, and more.
The framework clause identifies the following five phases, similar to the six steps in the SP 800-37 framework. Just as with the SP 800-37 framework, these steps can be repeated as necessary.
• Design Security is built into the process from beginning to end, starting at the design phase. During this phase, security controls are identified and selected.
• Implementation Personnel implement the design of the system during this phase, including the selected security controls.
• Evaluation Security controls are evaluated during this phase to determine their effectiveness based on the goals set during the design phase.
• Improvement Based on findings during the evaluation phase, security personnel make recommendations for improvement.
• Integration Security personnel integrate approved recommendations into the system.
Performing Risk Assessments
A risk assessment is a point-in-time evaluation. It looks at the current situation and attempts to determine what risks exist and how to address them. As an example, you can perform a risk assessment to determine risks for e-mail servers in your organization. This assessment could examine current threats, system configuration, interconnectivity, the amount of e-mail processed, fault-tolerance capabilities, power and air conditioning requirements, and more. However, after the assessment is completed, any of these elements can change, affecting the results of the assessment.
One of the benefits of performing risk assessments is that it allows security personnel to identify and prioritize risks. This helps ensure the organization dedicates risk management resources to the most serious risks. A risk assessment will use either a quantitative analysis or a qualitative analysis.
EXAM TIP A risk assessment looks at risks at a specific time. In contrast, risk management is an ongoing practice. Organizations repeat risk assessments periodically to ensure that current risks are assessed.
Threat Modeling
Threat modeling is a type of risk assessment that attempts to predict an attack. It uses various tools to model aspects of an attack against a system, a network, an application, or data.
NIST SP 800-154, Guide to Data-Centric System Threat Modeling, provides a methodology that organizations can use as a guideline for threat modeling. It focuses on data-centric threats and protecting different types of data within systems. However, many of the methodologies discussed in the document can be applied to other types of threat modeling, such as focusing on threats against web servers.
Using SP 800-154 as a guide, threat modeling can be defined within four major steps.
• Step 1: Identify and characterize the system and data of interest A primary goal in this step is to characterize the system. This includes evaluating the data processed by the system, and how data will move between systems to other locations. Security objectives (such as confidentiality, integrity, and availability) are evaluated to determine if any one security objective is more important than another.
• Step 2: Identify and select the attack vectors to be included in the model Next, personnel identify and select potential attack vectors to be included in the model.
TIP An attack vector refers to a method an attack can use to exploit a vulnerability. SP 800-154 mentions that attack vectors typically include a source of malicious content, a potentially vulnerable processor of the malicious content, and the malicious content itself. As an example, imagine a user receives a malicious attachment sent via e-mail. The malicious attachment is the content in the attack vector, the e-mail client that allows the user to open it is the processor, and the e-mail server that sent the attachment is the source. In some situations, security professionals can evaluate all potential attack vectors against a system or, said another way, analyze the system’s attack surface.
• Step 3: Characterize the security controls for mitigating the attack vectors In this step, personnel identify and document security controls that are currently in place to reduce the attack vectors and evaluate potential alterations or additions to security controls. For each recommendation, they attempt to identify the potential effectiveness of each alteration or addition. This can be simplified to assigning scores of low, medium, or high to each recommendation.
• Step 4: Analyze the threat model In the last step, security professionals analyze the threat model in an attempt to evaluate the effectiveness and efficiency of each security control. This can be a complex task and typically requires the use of quantitative analysis or qualitative analysis methods.
Quantitative Analysis
A quantitative analysis uses numerical-based data such as monetary figures to identify the actual cost associated with a risk. There are several variables associated with a quantitative analysis. If you can identify the values of these variables, prioritizing different risks becomes a simple matter of plugging the values into a formula. These values also help to justify costs for controls and countermeasures.
The following terms are important to understand when using a quantitative analysis:
• Single loss expectancy (SLE) This value identifies the actual loss of a single occurrence. For example, if a revenue-generating website is down for an hour, the company could determine that it results in a loss of $10,000.
• Exposure factor (EF) The EF identifies the magnitude of loss as a percentage of an asset’s value. As an example, imagine that a building has a value of $500,000 and insurance covers 75 percent of the replacement cost. The EF is 25 percent (or $125,000). This is often calculated automatically in the SLE, but you may run across it as a separate value that you need to calculate as: SLE = SLE without EF × EF.
TIP The SLE would include both tangible and intangible costs. Tangible costs would include the actual lost revenue while the website is down. Intangible costs include the costs associated with lost customers or advertising to rebuild the company image.
• Annual rate of occurrence (ARO) This identifies how often the SLE is expected to occur in a given year based on the current environment. You can use historical data to determine the ARO. For example, if the website experienced three one-hour outages each year in the past two years, it will probably experience three one-hour outages this year if something isn’t changed.
• Annual loss expectancy (ALE) You calculate the ALE by multiplying SLE × ARO. For example, if the SLE is $10,000 and the ARO is three, the ALE is $10,000 × 3, or $30,000. When the EF is mentioned but not included in the SLE, you would calculate the ALE with the following formula: ALE = (SLE × EF) × ARO.
• Cost of control A control will mitigate or reduce a risk. For example, if faulty hard drives caused an outage, you can replace them with a hardware RAID-6. If the RAID-6 costs $5,000, then the cost of the control is $5,000. Some controls have ongoing costs to consider. For example, administrators might need additional training to install and manage some systems, such as dedicated firewalls or unified threat management devices.
You can compare the ALE with the cost of the control to determine if it makes fiscal sense to purchase the control. In general, if the cost of the control is less than the ALE, the cost is justified. If the cost of the control exceeds the ALE, it may not be justified. If the cost of the control is about the same as the ALE, then the organization can perform a detailed analysis to determine the actual return on investment (ROI) for the control.
Consider the example of website outages caused by hard drive failures. Experts might predict that adding the hardware RAID-6 will eliminate these outages. You can then use the following information to see if it makes sense to purchase the hardware RAID-6:
• ALE before control: $30,000
• ALE after control: $0
• Cost of control: $5,000
• Savings (ALE before control – ALE after control – cost of control): $25,000
If the company does nothing, it can expect to lose $30,000. If the company implements the control, it eliminates the outages related to hard drives and reduces the ALE to $0. In other words, if the company spends $5,000, then it can expect to save $30,000, for a net savings of $25,000. The cost of the control is justified.
It’s also possible that by implementing a control, you don’t expect to eliminate the outages, but instead you expect to reduce the ARO. Using the previous example, experts might predict that adding a hardware RAID-6 will reduce the ARO from three to one. Instead of failing three times, the website might fail once due to a hard drive failure. An ARO of one results in an ALE of $10,000 (1 × $10,000). Is the cost of the RAID-6 still justified?
• ALE before control: $30,000
• ALE after control: $10,000
• Cost of control: $5,000
• Savings (ALE before control – ALE after control – cost of control): $15,000
You’ve reduced the ARO from three to one, so you’ve reduced the ALE from $30,000 to $10,000. This provides an initial savings of $20,000. The cost of the control is $5,000, so this provides a net savings of $15,000. If you did nothing, you’d lose $30,000, so this cost is still justified even if it doesn’t eliminate the risk.
On the other hand, if another risk has an ALE of $2,000 and the cost of the control is $22,000, the control is not justified. In this example, the control will reduce the ALE to $0:
• ALE before control: $2,000
• ALE after control: $0
• Cost of control: $22,000
• Savings (ALE before control – ALE after control – cost of control): negative $20,000
You’re spending $22,000 on a control to prevent a $2,000 loss. In this situation, management would typically decide not to implement the control, but instead accept the risk.
EXAM TIP When preparing for the SSCP exam, it’s important to have a solid understanding of SLE, ARO, and ALE. You should also be able to evaluate the cost of a control to determine whether it is justified.
An advantage of the quantitative analysis is that it provides a clear metric in the form of a monetary figure. You can use this to analyze the actual value of the control. However, the numbers used to create a quantitative analysis are not always easy to obtain. This is especially true when the SLE includes intangibles.
Qualitative Analysis
A qualitative analysis is subjective and often simply categorizes a risk using words such as low, medium, and high. For example, Figure 7-6 shows the relationship between impact and likelihood ratings and how to use them to determine overall risk. Notice that there’s a direct relationship between likelihood and impact. As the likelihood and impact increase, the risk also increases.
In Figure 7-6, you can see that a low impact combined with a high likelihood results in a medium risk. It’s important to realize this is just a guide and that the security professional doing the assessment will likely add in some subjective reasoning. As mentioned previously, a fire has a low likelihood but a high impact. However, it may be classified as an overall high risk because the result of a fire can be catastrophic.
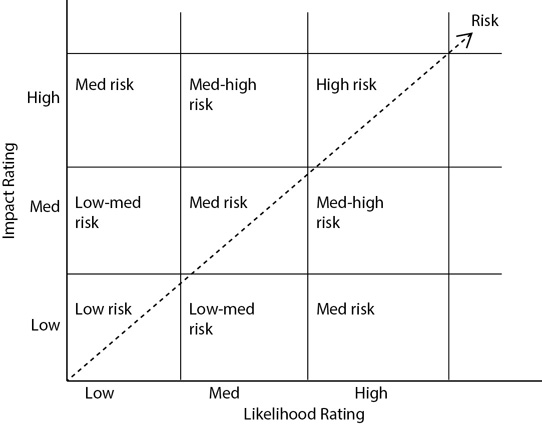
Figure 7-6 Qualitative analysis based on impact and likelihood ratings
It’s also possible to assign values to the ratings. This allows you to prioritize the risks based on the result. For example, imagine that you’ve assigned a value of 1 for low, 5 for medium, and 10 for high. You can then use these values to determine a risk score by multiplying the likelihood rating by the impact rating. Table 7-2 shows a risk level matrix that combines these ratings and shows the resulting risk scores. Notice that data such as this can be included in a risk register (as shown in Table 7-1 earlier).

Table 7-2 Risk Matrix Using Qualitative Analysis
TIP An organization can use any words or values desired for the ratings. For example, instead of just using low, medium, and high, you can add in low-medium with a value of 2.5 and medium-high with a value of 7.5.
Table 7-3 shows how these ratings can be used for specific threat events. It shows three adversarial threat events with risk scores of 5, 50, and 100. The threat event with a score of 100 (DoS attack on the Internet web server) represents the highest risk and needs to be addressed first.
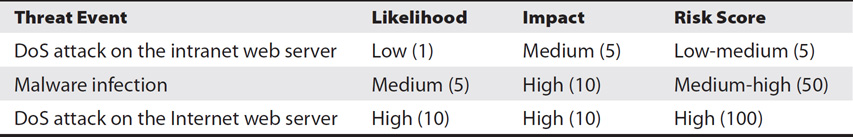
Table 7-3 Risk Matrix Ratings Used for Adversarial Threat Events
NOTE Chapter 5 covers various types of attacks, including denial of service (DoS) attacks. A DoS attack attempts to reduce a system’s ability to provide a service. In Table 7-2, DoS attacks on the web servers would hamper the web servers’ ability to serve web pages.
An advantage of the qualitative analysis is that it provides a clear priority of the different risks. Simply by looking at the result of the analysis, it becomes a simple matter to determine what risks should be addressed first. A disadvantage is that it is difficult to use the results in a cost/benefit analysis when evaluating controls.
EXAM TIP A quantitative analysis uses numerical data such as monetary figures and is objective. A qualitative analysis uses scenario-based data and is subjective. Many organizations use both methods for different risk assessments.
Risk Assessment Steps
Risk assessments can be complex projects taking a lot of time and effort. However, following an outline of predefined steps can simplify them. This also helps ensure that the risk assessment is reproducible and repeatable, and that different security experts can create the same results from the same data. This also helps an organization identify trends between assessments.
With this in mind, it’s important to look for previous risk assessments before starting a risk assessment. If they exist on the same system you’re evaluating, you can use them as a template; if you’re redoing a risk assessment, you only need to identify the changes since the last risk assessment.
An organization isn’t required to follow any specific steps. However, NIST SP 800-30 provides four steps that any organization can follow to create reproducible and repeatable results. Figure 7-7 shows the overall steps associated with a risk assessment as recommended in NIST SP 800-30, along with tasks within these steps. The following sections provide additional details on these steps.

Figure 7-7 Risk assessment steps including tasks within each step
Step 1: Prepare for Risk Assessment
In the first step, the organization performs key tasks to prepare for the risk assessment by identifying several elements used during the assessment. This includes identifying the purpose and scope of the assessment and identifying sources of information for the assessment. Any large project is susceptible to scope creep, where the project slowly grows well beyond the original goals. As an example, if the goal of the assessment is to assess risks associated with e-mail, the study can easily extend into the network infrastructure, including routers and firewalls. It could include power and air conditioning supplied to the entire server room. It could also include malware protection on individual clients and much more. If the goal is to examine only the direct risks associated with the e-mail servers, the purpose and scope should identify this.
This step also includes identifying assumptions and constraints. An organization will typically have safeguards or controls in place designed to mitigate risks. Additionally, some controls may be in the purchasing pipeline but not implemented yet. A risk assessment will often include a list of both current and planned controls, along with clarifying that the risk assessment assumes all of these controls are in place.
Last, this step includes identifying the risk model and analytic approach for the risk assessment. As an example, some risk models refer only to threats, while other models refer to both threat sources and threat events. The two types of analysis are quantitative and qualitative, both of which were covered in the previous two sections.
Step 2: Conduct Risk Assessment
During the risk assessment, you identify threat sources, threat events, and vulnerabilities. You then perform an analysis to determine the likelihood of a risk occurring, the impact if it does occur, and the overall risk.
Threats can be internal or external, natural or manmade, and intentional or accidental. Some models suggest matching threats with vulnerabilities, but this can often be tedious and doesn’t always provide any additional actionable data. Many current models (including the one outlined in NIST SP 800-30) do not require matching threat/vulnerability pairs.
After identifying likely threats and vulnerabilities, the assessment then attempts to identify the likelihood of a threat and the impact if it occurs. Security professionals rarely conduct risk assessment themselves. Instead, they often use surveys, questionnaires, and interviews with subject matter experts to gather information. For example, a survey may ask respondents to rank the likelihood of a threat event occurring and the impact if it does occur.
NOTE The specific numbers or words used to identify the likelihood and impact of a risk may be different from one organization to another. A specific scale isn’t available that all organizations must use. However, as long as the assessment uses the scale consistently, assessors can choose any scale that works for them.
After identifying the likelihood and impact, it’s possible to assign a risk score by combining the likelihood with the impact. A low likelihood combined with a low impact results in a low risk score, while a high likelihood combined with a high impact results in a high score.
The assessment can also assign numbers to the word values. For example, low, medium, and high could be 1, 5, and 10, respectively. It’s then possible to calculate the risk score by multiplying the likelihood and the impact. For example, if the probability is 7 and the impact is 8, it provides a risk score of 56.
It’s also possible to identify the risk score subjectively. For example, the possibility of a fire is low, while the impact would be high. Multiplying 1 (low) times 10 (high) gives a risk score of 10. However, the assessor can override this relatively low risk score because the impact could be catastrophic.
While a risk assessment typically does not recommend controls, it often evaluates prospective controls or safeguards to determine their value. As mentioned previously, a quantitative analysis makes it easier to evaluate the actual value of a control. However, you can also use a qualitative analysis to evaluate the control. The key is to calculate the risk score without the new control and with the new control.
Step 3: Communicate and Share Risk Assessment Results
After conducting the risk assessment, assessors provide the results to decision makers and other personnel within the organization. Risk assessment results include sensitive information, so the results aren’t shared with everyone within the organization. However, if the results directly affect a department, it’s common to share the results with department stakeholders.
While this step is typically done after completing the risk assessment, in some cases assessors will provide the results earlier. For example, if the assessment discovers a serious risk, assessors might report this to senior management right away.
The method of communicating and sharing the results will vary from one organization to another. One organization might use informal briefings before finalizing the risk assessment report. Another organization might decide to skip the briefings until the risk assessment report is finalized.
The contents of a risk assessment might also vary from one organization to another. However, you’ll often see the following items:
• Executive summary This is typically about 5 to 10 percent the size of the full report and summarizes the risk assessment.
• Risk assessment preparation This section identifies the purpose, scope, and assumptions identified in step 1 of the assessment. It also documents the information sources, the risk model, and analysis methods used for the assessment.
• Threat sources, threat events, and vulnerabilities Depending on the needs of the organization, the assessment might focus on only adversarial threats or all possible threats.
• Risk scores The assessment includes the likelihood of the risks, the potential impact, and the risk scores. It’s appropriate to document this information in tables or graphs so that it is easy to digest.
• Controls or countermeasures If the assessment evaluated controls or countermeasures, it should include details on them. Whenever possible, this section should document the cost of the controls and the predicted impact before and after implementing the controls.
• Uncertainties A risk assessment attempts to predict future risks, so it isn’t always based on complete data. Instead, it relies on expert opinions, assumptions, and speculations. An uncertainty analysis documents uncertainties caused by missing data, subjective opinions, and assumptions. This helps decision makers evaluate the usefulness of the risk assessment as events change. As an example, advanced persistent threats (APTs) from foreign countries have launched many attacks on companies within the United States. Even though there is some uncertainty about who sponsors specific APTs and their intentions, it is possible to predict future risks associated with APTs.
• Appendixes When appropriate, the assessment includes appendixes to document additional information such as details to support any of the conclusions.
Step 4: Maintain Risk Assessment
A risk assessment is a point-in-time report. In other words, it evaluates threats and vulnerabilities at a specific time. However, threats are constantly changing, so an organization must attempt to keep up with the changes with effective risk-management and risk-monitoring decisions.
Organizations periodically repeat or update risk assessments for key systems. The frequency is variable, but it is common to repeat a risk assessment on an annual or semiannual basis.
Maintaining a risk assessment also includes monitoring risk factors identified in the risk assessment. If risk factors change, the organization might choose to update the risk assessment outside of the normal schedule. It certainly isn’t necessary to wait for an incident before reassessing risk.
Address Findings
An important step after completing a risk assessment is to address the findings. In many cases, the assessment will identify risks that need to be mitigated by implementing controls. Of course, management makes the decision about which risks to address. In general, a risk assessment does not recommend controls. However, it can evaluate recommended controls and assess their value.
One process that some organizations implement is to periodically review the findings of past assessments and audit the progress. Auditing the findings later (such as six months after the completion of an assessment) provides insight into the accuracy of the predictions. For example, an assessment might have predicted that implementing a specific security control could eliminate a risk. Six months later, you can determine if this was true or not. This step also helps ensure that the organization is implementing the controls approved by management.
Supporting the Incident Lifecycle
In the best of all worlds, your risk management practices will prevent any incidents. However, avoiding all incidents is highly unlikely, so organizations create plans to respond to incidents.
In the context of IT security, a security incident is any violation of policies or security practices that has the potential to result in an adverse event. NIST SP 800-61, Computer Security Incident Handling Guide, provides several definitions that are helpful in identifying incidents:
• An event is any observable occurrence in a system or network.
• Adverse events are events with a negative consequence, such as system crashes, packet floods, unauthorized use of system privileges, unauthorized access to sensitive data, and execution of malware that destroys data.
• A computer security incident is a violation or imminent threat of violation of computer security policies, acceptable use policies, or standard security practices.
Notice that not all events are security incidents. Administrators or security personnel investigate events to determine whether they are incidents. Additionally, not all computer security incidents necessarily result in adverse events. For example, imagine that the company security policy states that users should not use computers to do personal shopping on the Internet. If a user violates this policy, it is an incident, but it won’t result in negative consequences (except perhaps for the employee).
The “Identifying Threat Sources” and “Identifying Threat Events” sections earlier in this chapter described many different types of incidents. Additionally, the following list describes some common types of incidents:
• Denial of service (DoS) Any type of attack that attempts to reduce a system’s ability to provide a service is an incident. This includes both DoS and distributed DoS (DDoS) attacks. Intrusion detection systems (IDSs) and intrusion prevention systems (IPSs) attempt to detect and block DoS and DDoS attacks before they can cause any damage.
• Malware The discovery of any type of malicious software, such as a virus, worm, Trojan horse, and so on, is an incident. If AV software discovers the malware before it’s installed on a system, it’s a minor incident. However, if the malware is able to spread unabated through a network, it can quickly become a major incident.
• Inappropriate usage Most organizations have an acceptable use policy identifying what employees can do with IT systems. Any attempt to violate this policy is an incident.
• Unauthorized access If any individual or software program is able to access data or systems that the user or program is not authorized to access, it is an incident. Depending on the value of the data or system accessed, the incident may be a minor incident or a major incident.
As you study for various cyber security certifications, you’ll find that the terminology used to define incident response varies. However, the underlying concepts are the same. As an example, Table 7-4 compares the phases of the incident response lifecycle outlined in the SSCP objectives and the phases outlined in SP 800-61.
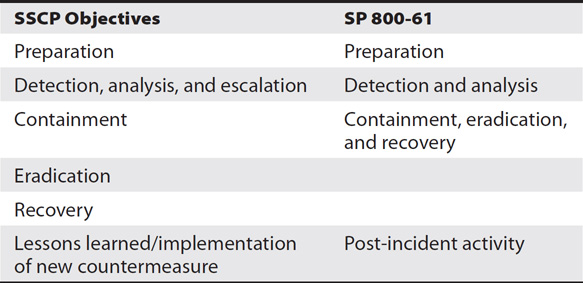
Table 7-4 Incident Response Lifecycle Comparison
While the SSCP objectives list six phases and SP 800-61 lists four phases, there really isn’t much difference between the two. The key is to understand the concepts within each of the phases. The following sections describe the phases listed in the SSCP objectives.
EXAM TIP The first phase in incident response is preparation, which includes creating an incident response plan. After detecting and verifying an incident, it’s important to contain the incident as quickly as possible.
Preparation
Preparing for an incident is an extremely important first phase. With solid preparation, you have a much better chance of minimizing damage from an incident when it occurs. Preparation includes the steps to prevent an incident by ensuring that your systems are secure, but it also includes planning for incidents and planning the response.
Many organizations identify individuals in a computer incident response team (CIRT). These individuals are responsible for responding to an incident when it occurs. A CIRT typically includes members from different parts of the organization and with different skills, such as senior management, information technology, information security, legal, and personnel with public communications skills.
TIP Some organizations use different terms for their teams. CIRT is common, but you may see other terms such as computer security incident response team (CSIRT) or just incident response team (IRT). Each of the terms refers to the same group of people who respond to an incident.
The CIRT needs ready access to tools and resources when an incident occurs. Every minute they have to spend looking for these tools is a minute lost containing the incident, so it’s common to locate the tools in an easily accessible location known by all the team members. The following list identifies some of these tools and resources:
• Contact information This includes contact information for all CIRT members and key personnel in the organization who may need to be notified of an ongoing incident.
• Reporting forms The organization may want to ensure that specific information is recorded about an incident. Precreated forms help the team members remember what information to document.
• Forensic tools Computer forensic tools help personnel collect and analyze evidence while observing relevant requirements to maintain the quality of the evidence. In case the incident results in legal proceedings, it’s important for personnel to ensure they don’t modify the data as they collect it and that they maintain proper custody of evidence after collecting it. Chapter 13 covers forensic issues in more depth.
• Documentation This includes documentation on systems and the network infrastructure. It should include a ready reference of approved changes and the status of these changes. When team members identify something that looks suspicious, such as a system configuration, they need to be able to identify whether it is a valid change or a malicious change. For example, administrators typically disable Trivial File Transfer Protocol (TFTP) when hardening systems, unless it’s needed. Some malware enables TFTP to forward files to other systems. If team members see TFTP enabled on a system, this documentation should allow them to verify if it is needed.
• Software and hardware The team may need access to hardware to perform simple tasks such as creating reports, doing research, or performing analysis. They also may need access to software used to rebuild systems.
• War room In the case of a serious incident, the team may need to use a central war room for coordination. This will likely be something like a general-purpose conference room used only as a war room during an incident. The incident response plan might designate a room to be used for this purpose if necessary.
This is by no means a complete list, and each organization’s list will likely be different. However, the important thing to remember is that the CIRT will need ready access to tools and resources. Many of these items could be stored in a network location. However, an incident might take the network down. As an alternative, some organizations create a “crash cart” for incidents. It would include a dedicated computer with relevant forensic tools installed, additional hardware and software that may be needed, and copies of relevant documentation.
Detection, Analysis, and Escalation
The next phase of the incident response lifecycle is detection, analysis, and escalation. At this stage, the event is discovered, investigated, and analyzed. If analysis shows that the event is a security incident, personnel escalate it. Escalation typically involves reporting it to other personnel in the organization with expertise to contain it.
There are multiple methods of detecting an incident. It could be as simple as AV software detecting malware on a USB device and sending an alert to notify a user. Users could notice suspicious activity and report it. Systems may randomly lock up or crash. Administrators may see logs growing at an alarming rate, strange files appearing on servers, or simply an increase in network activity (and a slowdown in network response). After detecting these events, someone investigates them to determine whether an incident has occurred.
Intrusion detection systems (IDSs) provide automated detection of potential incidents and display alerts to IT personnel about them. It’s important to realize that even though an IDS alerts personnel about activity, that activity isn’t necessarily an incident. Consider a SYN flood attack. In day-to-day operations, network issues may prevent the third packet from reaching the server. If this happens once in an hour, it’s highly unlikely that it’s an attack. Then again, if a server is receiving 100 half-open connections a second, that is very likely an attack.
NOTE Chapter 5 covers SYN flood attacks. As a reminder, they disrupt the TCP handshake process by withholding the third packet to complete the connection. The attacker sends the first packet (the SYN packet), the attacked system responds with a SYN/ACK packet, but the attacker never sends the final ACK packet. This consumes resources on the server and can prevent legitimate users from connecting to the server.
Security professionals who manage an IDS have to define the number of half-open connections that constitutes an attack. Clearly, if this happens once an hour, it isn’t an attack. However, if it is happening 100 times a second, it is very likely an attack. They identify the number and set it as a threshold to indicate an event. If they set the threshold too high, they won’t be notified when an attack is under way. If they set the threshold too low, they will receive false positives—notifications of possible attacks that are actually not attacks. Given the choice between not being notified of an actual attack or occasionally getting some false positives, most security professionals prefer the latter. They accept some false positives with the goal of ensuring the IDS does notify them of actual attacks.
With this in mind, personnel must investigate and analyze each potential incident. This analysis determines whether the event is an incident and, if so, attempts to prioritize and escalate the incident. Minor incidents don’t affect critical systems or critical infrastructure, so they are escalated only within the IT department. Critical incidents affect mission-critical systems and can seriously degrade the organization’s ability to perform its primary mission. Obviously, a critical incident would mandate the use of all available resources to address the incident and escalation may result in recalling all members of an incident response team.
Containment
The next phase of the incident lifecycle is containment. Once personnel verify that an event is an incident, the incident must be contained as quickly as possible. The goal is to prevent the incident from spreading. For example, after malware infects a single system on a network, it typically tries to locate and infect other systems on the network. However, disconnecting the network cable on the infected system contains the malware to just that system. It cannot spread on the network. In contrast, if you didn’t contain the malware, it could quickly spread to all the computers on the network, causing a major incident.
EXAM TIP Once an incident has been identified, it should be contained as soon as possible. This can’t occur before detecting the incident, but you can contain an incident after you’ve verified that it is an actual incident and not a false positive.
The steps for containment might be different in different organizations. As an example, some malware can detect when the network cable has been removed or the network interface card (NIC) has been disabled. When detected, the malware can take steps to hide itself or even delete itself from the infected system. Some organizations may instead choose to disconnect the switch from any routers, effectively isolating the network. Security professionals can then monitor the network for any suspicious activity from the infected computer. Of course the risk here is that all other computers on the isolated network may be infected.
Eradication
Once you’ve contained the incident, you move to the eradication phase. For example, some multipartite viruses have multiple components, and you must remove each individual component. If you miss any component, the malware can reemerge and reinfect all the files you’ve cleaned.
Recovery
The next phase is recovery, and what it entails depends on the damage caused by the incident. For minor incidents that haven’t caused any damage, recovery may not require any additional steps at all. As an example, if antivirus software detected malware and immediately quarantined it, no other action is required to recover a system.
However, a major incident may require the recovery of an entire server or even an entire location. For example, if a fire destroyed a building, recovery entails activating an alternative location, moving critical systems and data to the alternative location, and bringing everything back online.
NOTE Chapter 12 covers disaster recovery operations within the context of disaster recovery plans. It also covers alternative locations such as hot sites, cold sites, warm sites, and mobile sites. Each of these sites provides varying levels of readiness for disaster recovery.
Some malware can reconfigure systems, weaken security by enabling services or protocols, create new accounts used for backdoor access, or open previously closed ports on firewalls. All of the actions taken by the malware need to be reversed to complete the recovery.
Lessons Learned/Implementation of New Countermeasure
The last phase of incident response is to complete a lessons learned review and implement new countermeasures, if appropriate. This is often referred to as post-incident activity. In this phase, you examine the incident and the response. The goal is to determine whether the existing plans and procedures adequately addressed the incident or if there are response procedures that need improvement. Organizations that take the time to examine their response typically find ways to improve their existing processes. Occasionally, personnel recognize a need to implement a new countermeasure or security control.
One of the ways to perform a lessons learned activity is by holding a meeting with people involved in the incident and posing questions to generate discussions. Obviously, you wouldn’t hold a meeting like this for a minor incident, but if an incident negatively affected the mission of the organization, a lessons learned meeting is warranted. The information gathered during this meeting is compiled into a post-incident report that can be used in future risk management activities such as risk assessments.
The following are some of the questions you can include in this meeting:
• Are there any lessons to be learned from this incident? What are they?
• Did we respond to the incident as quickly as possible? If not, what can we do to improve the response time for a subsequent incident?
• Was there anything that prevented the recovery from occurring in a timely manner?
• Was the documentation up to date? If not, what was not up to date? Is there a way that we can ensure it is up to date in the future?
• Did the CIRT have all the tools it needed? If not, what tools were not available? How can we ensure these tools are available if we have a similar incident?
• Are there any new countermeasures or security controls we can implement either to prevent a similar incident or to at least reduce the severity of the incident?
One of the challenges of performing a lessons learned meeting is to avoid finger pointing and “blame storming.” Instead of focusing on improving the process for a potential event in the future, some participants may focus on ensuring that they aren’t blamed for this event. If senior management stresses that the goal is to improve the process and not to place blame, participants may be more willing to provide constructive input. Of course, if management uses the post-incident report to hold individuals or departments accountable, it’s highly unlikely future lessons learned meetings will have any success.
Chapter Review
Risk is the probability or likelihood that a threat will exploit a vulnerability and cause a loss. It is sometimes represented in the formula of Risk = Threat × Vulnerability. A threat is any activity that can be a possible danger and threat events include any type of activity or event that can result in a loss of confidentiality, integrity, or availability of an organization’s assets. A vulnerability is a weakness, and a loss represents a negative event for an organization.
Organizations attempt to identify potential threat sources and threat events. They then attempt to identify vulnerabilities that threats can exploit, and assess the potential impact of a threat exposing a vulnerability.
NIST publishes several documents related to IT security. Some documents related to risk mentioned in this chapter are SP 800-30 (Guide for Conducting Risk Assessments), SP 800-61 (Computer Security Incident Handling Guide), SP 800-150 (Guide to Cyber Threat Information Sharing), and SP 800-154 (Guide to Data-Centric System Threat Modeling).
Risk management (sometimes referred to as risk treatment) includes several elements used to reduce risk to a manageable level. This includes methods to mitigate (or reduce) risks, avoid risks, share or transfer risk, accept risk, and recast risk. Residual risk is the risk that remains after mitigating risks. Senior management is responsible for any losses resulting from risk they choose to accept, including residual risk.
One of the first steps in risk management is to identify assets. Once an organization identifies the assets that it considers valuable, it then takes steps to protect them. An organization addresses high risks by implementing security controls. Security controls typically attempt to reduce vulnerabilities or reduce the impact of a risk. However, if the valuable assets haven’t been identified, it’s possible that they won’t be protected and that resources will be expended to protect less valuable assets.
The Common Vulnerability Scoring System (CVSS) is an open standard that organizations can use to assess the severity of computer system security vulnerabilities. It has several precomputed formulas that security personnel can use to determine a risk score. Security personnel evaluate their system and assign metric values to the variables in the precomputed formulas.
A risk management framework provides a structured process that personnel can use to manage risk. NIST SP 800-37, Guide for Applying the Risk Management Framework to Federal Information Systems, includes the steps for one framework. ISO 31000, Risk Management – Guidelines, provides a slightly different framework.
A risk assessment is a point-in-time evaluation. It examines a system to identify threats and vulnerabilities, based on the current security controls. It then attempts to evaluate the likelihood of a threat exploiting a vulnerability and the impact, or magnitude of harm, from this event. Identifying the likelihood and the impact helps to determine the level of risk. Risk management processes address high risks. Threat modeling is a type of risk assessment that attempts to predict an attack.
Risk assessments commonly use either a quantitative analysis or a qualitative analysis. A quantitative analysis uses numerical figures to calculate risk. The single loss expectancy (SLE) identifies the loss from a single event. Annual rate of occurrence (ARO) indicates how many times you expect the event to occur. Annual loss expectancy (ALE) provides the total expected loss for a year and is calculated as SLE × ARO. This is useful to evaluate the value of a control. If the cost of the control is less than the ALE, it is justified. If it is significantly higher than the ALE, it is not justified. If the cost of the control and the ALE are relatively close, they must be evaluated to determine a long-term return on investment (ROI).
Many organizations designate a computer incident response team (CIRT or IRT) to respond to incidents. It’s important to know the concepts related to incident response. The SSCP exam outline lists the phases of the incident response lifecycle as (1) preparation; (2) detection, analysis, and escalation; (3) containment; (4) eradication; (5) recovery; and (6) lessons learned/implementation of new countermeasures.
Questions
1. Which of the following choices best represents the definition of risk?
A. The likelihood that a threat source can cause a threat event resulting in a vulnerability
B. The likelihood that a vulnerability can exploit a threat and cause a loss
C. The likelihood that a threat will exploit a vulnerability and cause a loss
D. The likelihood that an incident can cause a vulnerability resulting in a loss
2. You are involved in risk management activities within your organization. Of the following activities, which one is the best choice to reduce risk?
A. Reducing threats
B. Increasing vulnerabilities
C. Increasing impact
D. Mitigating risk
3. Which of the following choices identify valid threat sources? (Choose all that apply.)
A. Employee
B. Earthquake
C. State-sponsored attacker
D. Administrator
4. Which of the following can cause a negative impact on an organization’s assets?
A. A threat
B. A risk
C. A weakness
D. A control
5. An organization has recently suffered an attack resulting in monetary losses. Security professionals within the organization identified the tactics, techniques, and procedures used by the attackers and successfully eradicated all elements of the attack. What should these security professionals do with the knowledge they gained while mitigating this attack?
A. Tell personnel within their department only.
B. Post it on public forums.
C. Keep it private.
D. Share it in accordance with the security plan.
6. What is the purpose of risk management?
A. Eliminate risks
B. Reduce risks to an acceptable level
C. Share or transfer risks
D. Identify risks
7. What should an organization do when the cost of a control exceeds the cost of a risk?
A. Implement the control
B. Accept the risk
C. Perform a risk assessment
D. Mitigate the risk
8. Which of the following helps ensure that an organization focuses risk management resources only on the most serious risks?
A. Risk assessment
B. Residual risk
C. Countermeasures
D. Qualitative analysis
9. You decide to manage risk by purchasing insurance to cover any losses. Which one of the following risk management treatments are you using?
A. Accept
B. Avoid
C. Mitigate
D. Transfer
E. Recast
10. Which of the following is an open standard that organizations can use to assess vulnerabilities, by evaluating key metrics of a system?
A. CVSS
B. RMF
C. ALE
D. SLE
11. An organization has implemented several controls to mitigate risks. However, some risk remains. What is the name of the remaining risk?
A. Vulnerable risk
B. Mitigated risk
C. Alternate risk
D. Residual risk
12. A risk assessment recommended several controls to mitigate risks, but only some of the controls were accepted and implemented. Who is responsible for any losses that occur from the remaining risk?
A. The person completing the risk assessment
B. Senior management
C. IT personnel managing the systems
D. Security personnel
13. Of the following choices, which one most accurately reflects differences between risk management and a risk assessment?
A. A risk assessment is a point-in-time event, while risk management is an ongoing process.
B. Risk management is a point-in-time event, while a risk assessment is an ongoing process.
C. Risk assessments are broad in scope, while risk management is focused on a specific system.
D. Risk management is one part of an overall risk assessment strategy for an organization.
14. Which of the following is a type of risk assessment that attempts to predict an attack?
A. CVSS
B. Quantitative analysis
C. Qualitative analysis
D. Threat modeling
15. You are completing a risk assessment using historical data. You’ve identified that a system has failed three times in the past year, and each of these outages resulted in approximately $10,000 in losses. What type of analysis does this allow you to perform?
A. Qualitative
B. Quantitative
C. Subjective
D. Informative
16. Which of the following formulas will determine the annual loss expectancy (ALE)?
A. SLE – ARO
B. SLE × ARO
C. ARO – SLE
D. SLE / ARO
17. You are completing a risk assessment and using historical data. You’ve identified that a system has failed five times in each of the past two years. Each outage resulted in losses of about $5,000. What is the ARO?
A. Five
B. $5,000
C. $25,000
D. Impossible to determine with the information provided
18. You have completed a risk assessment and determined that you can purchase a control to mitigate a risk for only $10,000. The SLE is $2,000 and the ARO is 20. Is this cost justified?
A. Yes. The control is less than the ALE.
B. No. The control exceeds the ALE.
C. Yes. The control exceeds the ARO.
D. No. The control is less than the ARO.
19. What is the first phase in incident response?
A. Analysis
B. Containment, eradication, and recovery
C. Detection
D. Preparation
20. Of the following choices, what best represents the last phase in incident response?
A. Containment
B. Lessons learned
C. Analysis
D. Recovery
Answers
1. C. A risk is the likelihood that a threat will exploit a vulnerability and cause a loss. Threats do not create vulnerabilities, and vulnerabilities do not exploit threats. Similarly, incidents do not cause vulnerabilities.
2. D. Risk mitigation is the process of reducing risk. You can rarely reduce threats, but you can often reduce (not increase) vulnerabilities or reduce (not increase) the impact of a risk.
3. A, B, C, D. All of the answers are valid threat sources. Employees can be adversarial threat sources if they intentionally cause damage or accidental threat sources if they accidentally cause damage. An earthquake is an environmental threat source. A state-sponsored attacker is an adversarial threat source. An administrator is an employee and can intentionally or accidentally cause damage.
4. A. A threat source can cause a negative impact by exploiting a vulnerability. Risk is the likelihood that a threat will exploit a vulnerability and cause a loss; the risk doesn’t cause the negative impact. A weakness is a vulnerability. Attackers can exploit a vulnerability, but the vulnerability doesn’t cause the loss. Controls attempt to reduce risk by reducing vulnerabilities or reducing the impact of a risk.
5. D. They should share this threat intelligence with specific entities inside and outside the organization, as specified in a security plan. Telling personnel in only one department is unlikely to be effective at mitigating future incidents but sharing some elements of the attack may be a good method of educating users of tactics, techniques, and procedures (TTPs) used by attackers. Attackers monitor public forums, so posting TTPs might help them understand what they can use elsewhere, or how they can evade detection using similar TTPs. Security professionals recommend sharing threat intelligence judiciously, not keeping it private.
6. B. Risk management reduces risks to an acceptable level. It is not possible to eliminate risk. One method of managing risk is to share or transfer risk, but that is not the only method. Similarly, risk management processes identify risk, but risk management is much more than just identifying risk.
7. B. If the cost of a control exceeds the cost of a risk, the organization should accept the risk. The organization might implement the control if the cost of the control was less than the cost of the risk, indicating a cost savings. A risk assessment can analyze the value of the control, but you wouldn’t need to do a risk assessment if you already know the cost of the control exceeds the costs of the risk. Mitigating the risk indicates you would implement the control, but based on the known costs, it’s appropriate to accept the risk.
8. A. A risk assessment helps an organization prioritize risks so that it can focus risk management resources on the most serious risks. Residual risk is the risk that remains after implementing risk mitigation steps. Countermeasures are risk management resources that reduce risks. Risk assessments can use either a quantitative analysis or a qualitative analysis, but neither is superior to the other one in all circumstances.
9. D. Insurance is one of the ways that you can manage risk by transferring the risk to a third party. Risk acceptance doesn’t take any further action to mitigate the risk. In risk avoidance, you avoid the activity that results in the risk. It’s most common to try to reduce the risk using risk mitigation. Recasting a risk refers to changing it to a different severity.
10. A. The Common Vulnerability Scoring System (CVSS) is an open standard that organizations can use to assess the severity of computer system security vulnerabilities. It evaluates various metrics to identify a score. A risk management framework (RMF) is a generic term for a structured process to evaluate risks. Some RMFs are freely available to anyone, such as NIST SP 800-37, while others are only available by paying for them. Annual loss expectancy (ALE) and single loss expectancy (SLE) are terms associated with a quantitative risk analysis.
11. D. Residual risk is any risk that remains after implementing controls to mitigate the risk. It’s often not cost effective to implement controls to eliminate all risks, so senior management must make decisions on what risk to mitigate and what risk to accept as residual risk. Vulnerable risk and alternate risk are not valid terms associated with risk management.
12. B. Senior management is responsible for making decisions on what risk to mitigate. The remaining risk is residual risk and senior management is responsible for any losses from this residual risk.
13. A. A risk assessment is a point-in-time event, while risk management is an ongoing process. Risk assessment is one element of a risk management strategy, and risk assessments are generally focused on specific systems with a limited scope, while risk management is much broader.
14. D. Threat modeling is a type of risk assessment that attempts to predict an attack. It uses various tools to model aspects of an attack against a system, a network, an application, or data. The Common Vulnerability Scoring System (CVSS) is an open standard that organizations can use to assess the severity of computer system security vulnerabilities. Threat modeling typically uses either a quantitative analysis or qualitative analysis to analyze the threat model.
15. B. A quantitative analysis uses numerical figures to identify the actual costs associated with a risk. A qualitative analysis uses subjective terms such as low, medium, and high to analyze a risk. There is no such thing as an informative analysis.
16. B. ALE is the product calculated from the single loss expectancy (SLE) and the annual rate of occurrence (ARO), or SLE × ARO. The ALE is not calculated by subtraction of the ARO and SLE or by dividing the SLE and ARO.
17. A. The annual rate of occurrence (ARO) is five because it happened five times each in the past two years. The single loss expectancy (SLE) is $5,000 and the annual loss expectancy (ALE) is $25,000.
18. A. Yes, because the cost of the control is less than the annual loss expectancy (ALE), the cost is justified. The cost of the control is $10,000 and the ALE is $40,000. The annual rate of occurrence (ARO) is how many times the loss occurred (20 in the example), but it is only useful when you multiply it with the single loss expectancy (SLE) to identify the ALE.
19. D. The first phase in incident response is preparation, which includes creating an incident response plan. The other answers are valid phases in incident response, but they aren’t the first phase.
20. B. The last phase in incident response is lessons learned, sometimes called post-incident activity. Containment is important once an incident has been detected, analyzed, and escalated. Analysis occurs after an event is discovered and attempts to determine if it is an incident and should be escalated. Recovery is done after an incident has been contained and elements of the incident have been eradicated.