Hour 14 Exploring Processes

We have spent a considerable amount of time talking about how to work with files, the fundamental data element of a Unix system. There’s another facet of Unix that’s just as important to understand, however, and that’s processes. Whether it’s the device driver that’s listening to your keystrokes and relaying the characters to the program you’re running, the X Window System window manager that’s responding to mouse clicks (which are captured and sent along by the mouse device driver), or even the list of files produced by an ls invocation, Unix lives and breathes processes.
Indeed, what’s interesting about Unix is that it doesn’t hide system processes from you, unlike other operating systems. This means that there’s a lot you can learn by poking around and seeing what programs have what performance characteristics. That’s what this hour is all about—exploring processes.
In this hour you’ll learn about
• Process IDs
• Using the ps command
• The artsd command
• Process prioritization
• Zapping stray processes
The Secret Life of Process IDs
Let’s start at the beginning. Every process in Unix has a unique numerical identifier called a process ID. Typically, these are 3–4-digit numbers, and they increment one by one from the very first process started on a Unix system at boot.
Although process IDs (or PIDs, as we Unix old-timers call ’em) increment starting at PID 1 (the init process, as explored in the last hour), at a certain point process ID numbers can exceed the maximum possible integer value (usually 65536) and wrap around. In this case, you might find yourself running an application with a PID of 37 or 119. Generally, though, you’ll find that any process with a one-or two-digit PID is part of the core operating system kernel.
Task 14.1: Process ID Information
One thing that the incremental nature of PIDs implies is that you can check your process ID and find out how many processes have been launched between boot-time and when your login shell was launched.
1. The easiest way to identify the PID of your login shell is to use the shell variable $$, which expands to the PID of the shell automatically:
$ echo $$
1560
This indicates that by the time I launch a shell in my window manager (immediately after booting), 1,559 other processes have been run by the Unix operating system. This is quite remarkable, and should make you ask ″What are all these processes that are ahead of my shell?″
The primary answer to that question is found within all the scripts executed as the system steps from init state to init state, starting and stopping services. There are a lot of hidden processes that run, too. For example, a shell script constantly spawns subshells for information within backticks (like ‘this’), information within parentheses, and anything dropped into the background.
Just as inodes are the fundamental reference value for any files or directories on any Unix filesystem, so PIDs are the essential reference value for any process running on the system.
The concept of process ID numbers is straightforward, but it’s quite important that you understand how they let you reference any process running on the computer without any ambiguity. By contrast, the name of the program running is ambiguous, of course, because more than one copy of it might be running (or it might spawn copies of itself to run background tasks).
Examining Processes with the ps Command
There are a number of different commands available for examining running processes, but the most important one is ps, or process status, which first showed up in Hour 6, ″Account Management.″ Although it’s littered with lots of flags, there’s a standard set of two or three flags you’ll use 99% of the time to find all processes running on the system.
Give ps a specific process ID and it’ll tell you about that process, identify a terminal (or virtual terminal), and it’ll tell you about every process associated with that terminal. Specify a user and it’ll show you everything that user is running, and lots more.
Task 14.2: Exploring ps
The ps command is somewhat akin to the ls command, in that it has dozens of different options, but most of them are safely ignored, except in unusual circumstances.
1. Enough talk, let’s act! To start out, let’s allow ps to tell us about our login shell:
# ps $$
PID TTY STAT TIME COMMAND
1636 pts/2 S 0:01 bash
Without any modifiers, the ps command reports the PID, the terminal associated with the process, its status, the amount of CPU time that the process has consumed so far, and the actual command itself. As you can see, I’m running the bash shell.
The most interesting column here is STAT, which is really the current status of the process. The value S indicates that it’s sleeping, oddly enough, even though it’s my current shell. (Don’t worry, though; the shell itself sleeps while the ps command it spawned runs.)
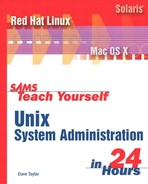
A full list of different process states is shown in Table 14.1.
Table 14.1 ps Process States
2. You can experiment a bit by omitting the $$ specification of the shell’s PID. Now ps shows all processes associated with your terminal, real or virtual:
# ps
PID TTY TIME CMD
1636 pts/2 00:00:01 bash
8437 pts/2 00:00:00 ps
You can see that it shows we have our login shell, bash, and the ps command itself. Notice also that it isn’t showing the state of each process.
To get the state, we can add either the -l or -f flags, for long or full listings, respectively:
# ps -l
F S UID PID PPID C PRI NI ADDR SZ WCHAN TTY TIME CMD
100 S 0 9020 9018 2 69 0 - 636 wait4 pts/3 00:00:01 bash
000 R 0 9064 9020 0 77 0 - 778 - pts/3 00:00:00 ps
# ps -f
UID PID PPID C STIME TTY TIME CMD
root 9020 9018 2 15:32 pts/3 00:00:01 bash
root 9065 9020 0 15:33 pts/3 00:00:00 ps -f
The output of the -f flag is more commonly used, and although it still doesn’t show us the status of the commands, it now shows the helpful PPID (parent process ID), which clearly shows that the ps is being run by bash.
In the long output format (-l), the F column lists the process flags, S is the runtime state (same as STAT earlier), and PID and PPID are the current and parent process IDs. The C column indicates the percentage of CPU usage, the PRI column shows an internal priority state and should probably be ignored, the NI column is the nice level (relative runtime priority) of the process, and ADDR is actually a meaningless placeholder for compatibility with earlier versions of ps. SZ is the overall memory size (in 1K blocks), WCHAN indicates where the process is within the kernel space, the TTY shows what terminal or virtual terminal owns the process, TIME indicates accumulated CPU time, and finally, CMD is the actual command.
![]()
Michael Johnson, the author of the Linux ps command, says this about the PRI flag: ″It’s a dynamic internal field from the kernel, which has semantics that depend on the scheduler in use.″
The -f output is a bit more succinct, showing the UID, PID, PPID, C, start time (listed as STIME), TTY, accumulated CPU time, and the command itself.
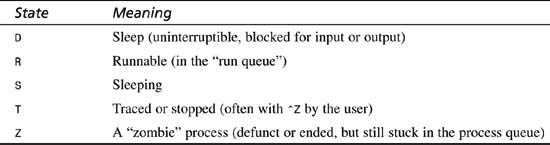
3. Is your head swimming? Mine certainly is, just trying to figure this all out! The good news is that there’s a considerably more friendly output format generated by the -u (so-called ″user friendly″) flag:
Helpfully, this presents information in a much more readable and understandable manner. Notice that while bash is sleeping (STATE=S), it is still using 0.4% of the CPU and 2.1% of the available memory. VSZ is the virtual memory size (in 1K blocks), and RSS is the runtime stack, the subset of needed memory that’s actually in the physical RAM of the computer (again, in 1K blocks).
You can do some simple math to see your available memory based on this. If 2,544 pages (VSZ) is 2.1% of the available memory, this implies that 100% memory would be 121,142 pages, which is correct: This system has 128MB of RAM, so we’re seeing 121MB available, and approximately 7MB reserved for the kernel itself.
![]()
Realistically, the kernel will take up more than just 7MB of memory. This approach to calculating available memory should only be considered a back-of-the-envelope type of figure.
![]()
The Linux version of ps is a bit peculiar, in that it understands both BSD-style and SYSV-style command flags. Try this: Compare the difference in output between ps -e (the System V/Posix style) and ps e (the BSD style). Other Unixes don’t have this peculiar dual personality with the ps command, thankfully.
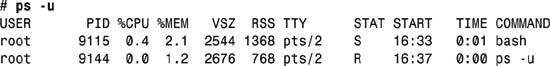
4. The most common ps flag I use is -aux. This gives you all the running processes, with enough information to get a good clue about what they’re all doing.
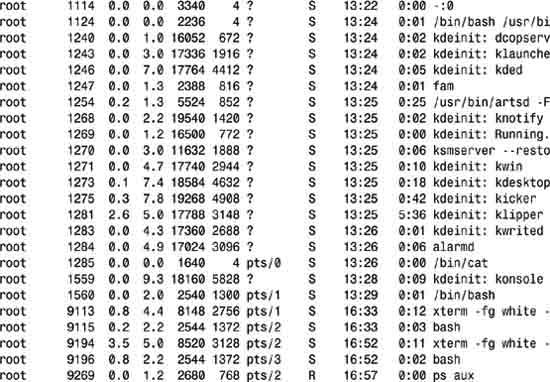
As you can see, there are a lot of processes running on this system!
5. Unsurprisingly, it’s most common to feed this output to grep, to weed out the specific information you seek. Curious about what processes are not running as root? Try this:
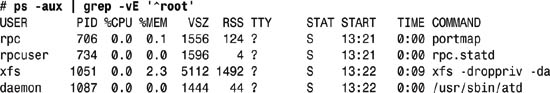
Note that all of these are in sleep state (STAT=S). Indeed, a quick scan of the earlier output will reveal that the ps command is the only one in run state when the process snapshot was taken by ps.
6. If you’re curious about what programs are consuming the most memory, rather than dig through ps, most versions of Unix include a very helpful utility called top (or, on some systems, monitor, which shows you all running applications, but refreshes the list every few seconds. You can also get top to dump its output to the screen and quit, rather than iteratively refresh. Then you can use head to identify the half dozen processes using the most CPU time:
# top -b -n0 | head -20
5:11pm up 3:50, 4 users, load average: 0.22, 0.09, 0.08
57 processes: 56 sleeping, 1 running, 0 zombie, 0 stopped
CPU states: 9.8% user, 5.4% system, 0.0% nice, 84.6% idle
Mem: 62264K av, 56172K used, 6092K free, 0K shrd, 1640K buff
Swap: 192772K av, 15208K used, 177564K free 18420K cached
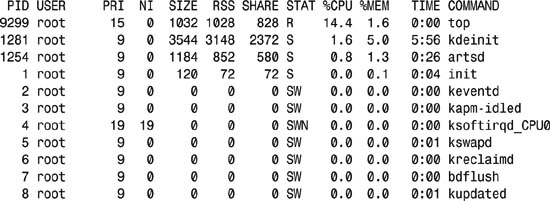
The first few lines of top are most interesting, as it offers a very helpful snapshot of the current state of your system. For this particular Linux server, you can see that it’s 84.6% idle (lots of CPU headroom), has 561MB of memory used and 6MB free (unsurprisingly, the kernel is maximizing the amount of physical memory it’s trying to use), while 152MB of swap space is used and 177MB is free.
What’s going on? How can I be using 561MB on a system that only has 128MB of total RAM? The answer is that top is showing a cumulative total of the averages over time of usage, so the system hasn’t magically found an additional 433MB. This averaging is also how CPU usage is calculated, which is why earlier we saw bash using 0.9% of the CPU even though it was in a sleep state.
Stepping into the listing itself, notice that top itself is consuming 14.4% of the CPU, kdeinit (an initialization and runtime management process for the KDE window manager) is using 1.6%, artsd is using 0.8%, and none of the other processes are making any demands on the CPU at all.
7. By contrast, top needs slightly different flags on Mac OS X to produce the same output, but the information shown is perhaps a bit more interesting:
# top -ul1 | head -20
Processes: 49 total, 2 running, 47 sleeping… 166 threads 11:12:50
Load Avg: 0.78, 0.78, 0.83 CPU usage: 27.9% user, 9.3% sys, 62.8% idle
SharedLibs: num = 94, resident = 23.3M code, 1.37M data, 6.04M LinkEdit
MemRegions: num = 3774, resident = 209M + 10.5M private, 125M shared
PhysMem: 45.8M wired, 165M active, 294M inactive, 505M used, 7.49M free
VM: 2.84G + 46.8M 6650(0) pageins, 591(0) pageouts
PID COMMAND %CPU TIME #TH #PRTS #MREGS RPRVT RSHRD RSIZE VSIZE
312 iTunes 13.0% 24:54.68 9 141 236 8.04M 10.5M 12.5M 74.0M
337 Virtual PC 9.2% 7:36.81 10 139 219 79.5M 13.9M 87.5M 153M
65 Window Man 3.0% 23:20.98 3 191 181 1.75M 54.0M 54.9M 96.2M
359 Terminal 2.7% 0:05.54 5 116 129 2.35M+ 7.44M 5.46M+ 67.1M
391 top 2.7% 0:00.37 1 14 15 188K+ 328K 428K+ 1.49M+
336 Internet E 1.6% 1:26.15 8 99 146 8.94M 11.5M 14.8M 75.6M
335 Microsoft 1.2% 6:02.54 5 124 335 24.6M 41.3M 37.9M 124M
288 Microsoft 1.0% 34:40.22 13 156 338 21.1M 24.2M 35.4M 108M
0 kernel_tas 0.9% 2:54.33 30 0 - - - 37.5M 336M
294 MWBackGrou 0.3% 0:46.74 1 50 47 552K 2.15M 1.26M 30.9M
291 Snapz Pro 0.1% 0:20.12 1 54 73 1.73M 7.39M 4.52M 61.8M
67 update 0.1% 0:01.85 1 8 13 56K 292K 152K 1.25M
You can see that I’m running iTunes (a JPEG music player), Virtual PC, Internet Explorer, and various other applications, and even though I’m actively in Terminal (PID 359) running top (PID 391), there are many other applications actually using the CPU at the same time.
8. I’d like to show you the equivalent program output in Solaris 8, but Solaris doesn’t in clude a top or monitor program, frustratingly. You’re on your own to try and combine uptime and ps instead, or start with whodo -l and see what that produces:
# whodo -l
12:21am up 31 day(s), 1 hr(s), 54 min(s) 4 user(s)
User tty login@ idle JCPU PCPU what
root console 26Jan02 3days 1:25 xterm
root pts/2 26Jan02 6:40 -
root pts/4 4:56pm 1:25 whodo -l
root pts/3 10:56pm -
There’s a lot in the ps output to study, and as a system administrator, one of the most important questions you’ll have will be ″What is this?″ for some of the jobs. In particular, pay attention to jobs that are not running as root, as they’ll show you how your users are consuming CPU and memory resources.
A Typical Sysadmin Task: What’s artsd
To give you a sense of how all the Unix tools work together, let’s spend a few minutes trying to figure out what artsd is. I’m not sure what the artsd program running and eating up CPU time on my Linux box does. This is a very common situation where you’ll need to use standard Unix tools to figure out what a specific task is and whether you really need it.
Task 14.3: A Little Unix Detective Work
First off, let’s see if we can identify how it’s been started.
1. To do this, add the w flag to the ps command, but do it a couple of times. Unlike just about any other Unix command, multiple occurrences of the w flag gives you more output:
# ps -auxwwww | grep artsd
root 1254 0.1 1.3 5524 852 ? S 13:25 0:28
![]() /usr/bin/artsd -F 10 -S 4096 -s 60 -m artsmessage -l 3 -f
/usr/bin/artsd -F 10 -S 4096 -s 60 -m artsmessage -l 3 -f
root 9322 0.0 0.9 1732 592 pts/2 S 17:35 0:00 grep artsd
The first stop is to try the man pages:
# man -k artsd
artsd: nothing appropriate
Hmmm…looks like it’s going to be a bit harder to figure this one out.
2. As a next step, let’s see what files have artsd in them by using locate:
# locate artsd
/usr/bin/artsd
/usr/bin/artsdsp
/usr/lib/libartsdsp.la
/usr/lib/libartsdsp.so
/usr/lib/libartsdsp.so.0
/usr/lib/libartsdsp.so.0.0.0
/usr/lib/libartsdsp_st.la
/usr/lib/libartsdsp_st.so
/usr/lib/libartsdsp_st.so.0
/usr/lib/libartsdsp_st.so.0.0.0
/usr/include/kde/arts/kartsdispatcher.h
Still nothing useful.
![]()
If your locate command has no output, it might be because you haven’t created the initial locate database. Have a look at the man page for details on how to accomplish this simple task.
Let’s look in /usr/bin to see what’s part of the arts family of applications:
# ls /usr/bin/arts*
/usr/bin/artsbuilder /usr/bin/artsd /usr/bin/artsshell
/usr/bin/artscat /usr/bin/artsdsp /usr/bin/artswrapper
/usr/bin/artsc-config /usr/bin/artsmessage
/usr/bin/artscontrol /usr/bin/artsplay
Quite a few applications, actually. It’s surprising that there’s not a single man page for any of it.
3. Let’s try one more locate before we give up and jump to a search on Google, or one of the Linux sites on the Web:
# locate artscontrol
/usr/bin/artscontrol
/usr/share/apps/artscontrol
/usr/share/apps/artscontrol/artsmidimanagerview.rc
/usr/share/apps/artscontrol/artscontrol.rc
/usr/share/icons/hicolor/16x16/apps/artscontrol.png
/usr/share/applnk/Multimedia/artscontrol.desktop
Ah ha! There’s a directory called artscontrol in the /usr/share/apps directory. Let’s see what else is in that directory that might be relevant to our search:
# cd /usr/share/apps
# ls -ld arts*
drwxr-xr-x 4 root root 4096 Jan 11 15:03 artsbuilder
drwxr-xr-x 2 root root 4096 Jan 11 15:03 artscontrol
The artscontrol directory looks promising:
# ls /usr/share/apps/artscontrol
artscontrol.rc artsmidimanagerview.rc
# more !$/artscontrol.rc
more /usr/share/apps/artscontrol/artscontrol.rc
<!DOCTYPE kpartgui>
<kpartgui name=″artscontrol″ version=″3″>
<MenuBar>
<Menu name=″view″><text>&View</text>
<Action name=″view_fft_scope″/>
<Action name=″view_audio_manager″/>
<Action name=″view_arts_statusview″/>
<Action name=″view_midi_manager″/>
<Action name=″view_media_types″/>
<Action name=″view_freeverb″/>
<Action name=″old_volume_display″/>
</Menu>
</MenuBar>
</kpartgui>
![]()
Notice the very useful shell shortcut !$, which matches the last word of the previous command.
Well, we haven’t found any documentation, but we can glean a few snippets of information from this. First off, the arts application is some sort of synthesizer player or interface system (notice arts MIDI managerview.rc: MIDI is musical interface digital instrument, and it’s how synthesizers talk to each other). Secondly, notice the rc file contents indicate that it’s a kpartgui, which indicates that it’s part of the GUI to KDE. Most likely, then, artsd is a background daemon that helps the arts synthesizer work properly.
4. Because all the arts* applications in /usr/bin seem to be part of this program, another sneaky trick is to use the helpful strings command to search for any sort of URL that might be listed in any of the programs:
# cd /usr/bin
# strings arts* | grep -i http:
http://www.arts-project.org/
Gotcha! A quick visit to that Web site reveals that sure enough, arts is an analog real-time synthesizer. And now we know.
There are a number of different ways that you can try to isolate and identify different programs running in a ps output. It’s good practice learning the various sysadmin tools, so try doing a bit of your own detective work, and see if you can identify some of the more cryptic daemons running on your own Unix system.
Process Priorities
One important capability that you have as sysadmin that isn’t available to mere mortal users is that you can change the priority of specific tasks to meet the CPU demands of your process workload. If you have a particular program that seems to eat your processor alive, for example, you can lower its priority when you launch it, or you can even drop its priority while it’s running, letting other applications have a better chance at getting a slice of CPU time. Users can change the prioritization of their own tasks, but root can change any task.
Conversely, perhaps you are running an image manipulation program or a real-time analysis tool and want to ensure that it’s more important than any programs other users might launch. To do that, you would increase the priority of the process, either at launch-time, or when it’s already running.
Task 14.4: Managing Process Priorities
There are two commands available for working with process priorities: nice and renice. The nice command lets you set the priority of the process before it’s launched, and, you guessed it, renice lets you change the process of a running job.
Unfortunately, although you might think of a lower priority job as being less important than a higher priority job, the nice and renice commands (and Unix itself) think about this in the exact opposite way: A process with a high nice value has a lower priority than another with a lower nice value.
The nice values can range from -20 to 19. Zero is a standard priority for all login shells and applications that they spawn. Your login shell and your vi session are both priority (nice level) zero.
1. To see your current nice level, use ps -l:
# ps -l
F S UID PID PPID C PRI NI ADDR SZ WCHAN TTY TIME CMD
100 S 0 9386 9384 0 69 0 - 654 wait4 pts/2 00:00:03 bash
000 R 0 9485 9386 0 76 0 - 775 - pts/2 00:00:00 ps
The NI column is what we’re interested in here: Notice that both jobs are, as expected, running with a nice level of zero.
Wondering if there are any jobs that are not at nice level zero? A fair question, easily answered with awk:
# ps -lx | awk ′{ if ($6 != 0) print $0 }′
F UID PID PPID PRI NI VSZ RSS WCHAN STAT TTY TIME COMMAND
040 0 4 0 19 19 0 0 ksofti SWN ? 0:00
![]() [ksoftirqd_
[ksoftirqd_
040 0 9 1 -1 -20 0 0 md_thr SW< ? 0:00
![]() [mdrecovery
[mdrecovery
There are two tasks with a nonzero nice level: mdrecovery is the most important job on the system, with a nice level of -20, and ksoftirqd is the least important with a priority of 19.
2. To launch an application with a different priority, the nice command should be used. A typical use might be to have a window watch the syslogd output file (/var/log/messages), a job that’s important, but certainly less important than interactive work:
# nice tail -f /var/log/messages &
# ps -l
F S UID PID PPID C PRI NI ADDR SZ WCHAN TTY TIME CMD
100 S 0 9386 9384 0 69 0 - 654 wait4 pts/2 00:00:04 bash
000 T 0 9523 9386 16 75 10 - 506 do_sig pts/2 00:00:00 tail
000 R 0 9524 9386 54 75 0 - 776 - pts/2 00:00:00 ps
By default, you can see that nice adds 10 to the priority, which means that the application is run at a lower priority (it’s less important) than all the other processes on the system.
To make it more important, specify the desired nice value:
# nice --5 vi importantfile &
# ps -l
F S UID PID PPID C PRI NI ADDR SZ WCHAN TTY TIME CMD
100 S 0 14540 14539 0 73 0 - 642 wait4 pts/0 00:00:00 bash
000 S 0 14566 14540 0 74 10 - 414 nanosl pts/0 00:00:00 tail
100 T 0 14575 14540 0 69 -5 - 505 do_sig pts/0 00:00:00 vi
100 R 0 14577 14540 0 76 0 - 773 - pts/0 00:00:00 ps
![]()
Did you notice that you need to use a double-dash to get a negative priority? The command nice -5 command sets it to priority 5, which is actually less important than the default priority of zero. Most confusing!
3. To change the priority of a running task, use renice. The renice command requires the PID, but that’s easy to obtain, as you now know.
Let’s bring the vi session back to the normal priority of zero to start:
# renice 0 14575
14575: old priority -5, new priority 0
Looks good. How about in the other direction? Let’s make that tail process more important than regular processes by giving it a nice level of -1:
# renice -1 14566
14566: old priority 10, new priority -1
![]()
As a regular user, you can renice your own processes, but only within the range of 0–19. It is not possible for you to make your jobs more important than the standard nice level of zero.
4. The renice command has some additional options, not the least of which is that you can change the priority of all processes owned by a specific user in a single fell swoop. For example, if user taylor has been whining just a bit too much about slow computers and how Quake just doesn’t zip along like his machine at home, you might like to slow things down even further by lowering his priority for a short period of time:
# renice +1 -u taylor
502: old priority 0, new priority 1
537: old priority 0, new priority 1
More likely, you’ll want to perhaps improve the throughput of your Web server by setting all the Apache processes to have a slightly higher priority. First, let’s use the -U flag to ps to limit output to just the specified UID, then renice all the relevant jobs:
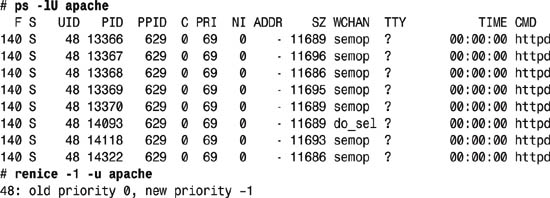
In this case, it reports the real group ID of all the processes running that match. To see that this is the case, use the -G flag (show group IDs) to ps with the number given (48):
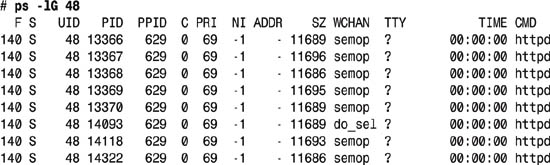
That’s exactly what we wanted. Because this server is primarily a Web server, we have now prioritized all Web requests (Apache is the Web server, and its daemon is httpd) to be higher (a lower nice level) than regular login shells and other processes.
Being able to adjust and fine-tune the priority of tasks on a Unix system is a powerful–and dangerous–capability. Like any superpower, you must use it wisely and judiciously. Never change the priority of any kernel task, for example, and be cautious about lowering the priority of any regular user task.
On the other hand, being able to tweak things can be a significant benefit, too. On my Mac OS X system, for example, I have learned that using renice to set the priority of iTunes to 1 and Virtual PC to –1 significantly improves overall performance without any adverse affect on music playback.
Zapping Stray Processes
One more topic to discuss in this hour is kill. The renice command lets you lower the priority of tasks you’d like to consume fewer CPU and system resources, but what if you want to kill the process entirely?
That’s what the eponymously named kill command is for. Specify a PID and you can make it vanish in a puff of greasy black smoke.
Task 14.5: The kill Command
Whether the process is wedged, running out of control, has become unresponsive to regular interaction, or is from another user who isn’t authorized to run it, there are times when being able to eliminate a process is of great value.
1. From the last section, there are still a couple of jobs running that should be removed, as ps reminds us:
# ps -al
F S UID PID PPID C PRI NI ADDR SZ WCHAN TTY TIME CMD
000 S 0 14539 14369 0 70 1 - 589 wait4 pts/0 00:00:00 su
100 S 0 14540 14539 0 72 0 - 642 wait4 pts/0 00:00:00 bash
000 S 0 14566 14540 0 69 -1 - 414 nanosl pts/0 00:00:00 tail
100 T 0 14575 14540 0 68 0 - 505 do_sig pts/0 00:00:00 vi
100 R 0 14701 14540 0 75 0 - 773 - pts/0 00:00:00 ps
Let’s kill the tail first of all, because we don’t need it any more—we have instead decided to just peek at the contents of the syslog file itself once every morning:
# kill 14566
#
The kill command never has any output, so traditionally sysadmins run the command a second time: If it reports nothing again, that means that the application is blocking or ignoring the signal, but if it reports No such pid, then the first kill did its job:
# kill 14566
bash: kill: (14566) - No such pid
[1]- Terminated nice tail -f /var/log/messages
In this case, the first kill terminated the tail, and the shell was just being polite by waiting until the end of another job to report that the job was terminated.
2. Did you notice earlier that the state of the vi job was T, not S or R? That means that it’s stopped—either blocked for I/O, or stopped by the user with a ^Z control sequence. Whether it’s stopped, sleeping, or running, sending a signal to the process causes it to wake up long enough to handle the signal, either ignoring it or accepting it and performing a specific action.
There are a lot of signals that can be sent to a job, too: kill -l lists all the possibilities:
# kill -l
1) SIGHUP 2) SIGINT 3) SIGQUIT 4) SIGILL
5) SIGTRAP 6) SIGABRT 7) SIGBUS 8) SIGFPE
9) SIGKILL 10) SIGUSR1 11) SIGSEGV 12) SIGUSR2
13) SIGPIPE 14) SIGALRM 15) SIGTERM 17) SIGCHLD
18) SIGCONT 19) SIGSTOP 20) SIGTSTP 21) SIGTTIN
22) SIGTTOU 23) SIGURG 24) SIGXCPU 25) SIGXFSZ
26) SIGVTALRM 27) SIGPROF 28) SIGWINCH 29) SIGIO
30) SIGPWR 31) SIGSYS 32) SIGRTMIN 33) SIGRTMIN+1
34) SIGRTMIN+2 35) SIGRTMIN+3 36) SIGRTMIN+4 37) SIGRTMIN+5
38) SIGRTMIN+6 39) SIGRTMIN+7 40) SIGRTMIN+8 41) SIGRTMIN+9
42) SIGRTMIN+10 43) SIGRTMIN+11 44) SIGRTMIN+12 45) SIGRTMIN+13
46) SIGRTMIN+14 47) SIGRTMIN+15 48) SIGRTMAX-15 49) SIGRTMAX-14
50) SIGRTMAX-13 51) SIGRTMAX-12 52) SIGRTMAX-11 53) SIGRTMAX-10
54) SIGRTMAX-9 55) SIGRTMAX-8 56) SIGRTMAX-7 57) SIGRTMAX-6
58) SIGRTMAX-5 59) SIGRTMAX-4 60) SIGRTMAX-3 61) SIGRTMAX-2
62) SIGRTMAX-1 63) SIGRTMAX
Almost all of these can be safely ignored, but there are three worth highlighting, as they’ll be used most often: SIGTERM is sent if no signal is specified (as with the earlier kill of the tail process), SIGHUP is the ″hang-up″ signal and is usually a very graceful way to terminate a process that ignores SIGTERM, and SIGKILL is the ″big gun″ of the signal world–it’s a kill signal that cannot be captured or ignored by a process. If you’re lazy, you can also use the signal number, as in kill -9 pid.
As with the scary days of the Cold War, there’s a sense of escalation of signals, based on the response of the process to the previous signal sent. Think of it like this: If the pistol didn’t work, try the rifle. If that doesn’t work either, it’s time for a tactical nuke. Well, maybe that’s a wee bit dramatic, but you get the idea.
3. To kill the vi session, I’ll specify SIGTERM and see what happens:
# kill -TERM 14575
# kill -TERM 14575
#
Ahhh…vi ignores SIGTERM signals, so we’ll have to try something a bit stronger:
SIGHUP.
# kill -HUP 14575
# kill -HUP 14575
#
As you can see, some applications are pretty tough, able to accept and ignore many common signals. The tail command gracefully died when it received its first SIGTERM, but vi is lingering. This means it’s time for a SIGKILL (aka -9):
# kill -9 14575
# kill -9 14575
bash: kill: (14575) - No such pid
[2]+ Killed nice --5 vi testme
That did the trick. Notice that you can specify the signal by name (for example, -KILL) or by its number. Many system administrators have the command kill -9 wired into their fingers after a bit, and don’t even think about signal names.
4. If you ever find yourself in a situation where it would be useful to stop a job temporarily, then resume it later, it’s worth knowing that you can send the signal equivalent of a ^Z to a process, then a resume signal to have it start up and begin running again:
# ps -lU taylor
F S UID PID PPID C PRI NI ADDR SZ WCHAN TTY TIME CMD
100 S 502 14369 14368 0 70 1 - 618 wait4 pts/0 00:00:00 bash
000 S 0 14539 14369 0 70 1 - 589 wait4 pts/0 00:00:00 su
100 S 502 14717 14716 0 71 0 - 618 read_c pts/1 00:00:00 bash
000 R 502 14757 14717 27 78 0 - 445 do_sig pts/1 00:00:00 find
You can see that user taylor has a find running that’s currently taking up 27% of the CPU. It’d be helpful to stop this find temporarily, run a few sysadmin commands, then start it up again:
# kill -STOP 14757
# ps -lU taylor
F S UID PID PPID C PRI NI ADDR SZ WCHAN TTY TIME CMD
100 S 502 14369 14368 0 70 1 - 618 wait4 pts/0 00:00:00 bash
000 S 0 14539 14369 0 70 1 - 589 wait4 pts/0 00:00:00 su
100 S 502 14717 14716 0 71 0 - 618 read_c pts/1 00:00:00 bash
000 T 502 14757 14717 0 78 0 - 445 do_sig pts/1 00:00:00 find
now the job is stopped, we can do other stuff for a while
# kill -CONT 14757
# ps -lU taylor
F S UID PID PPID C PRI NI ADDR SZ WCHAN TTY TIME CMD
100 S 502 14369 14368 0 70 1 - 618 wait4 pts/0 00:00:00 bash
000 S 0 14539 14369 0 70 1 - 589 wait4 pts/0 00:00:00 su
100 S 502 14717 14716 0 71 0 - 618 read_c pts/1 00:00:00 bash
000 R 502 14757 14717 0 78 0 - 445 do_sig pts/1 00:00:00 find
Some system daemons will reread their configuration files and restart themselves upon receiving a specific signal, too. If that’s the case, then typically something like kill -1 pid does the trick easily, but double-check with the documentation before you wreak too much havoc on your system.
In a typical week of work as a system administrator, you probably won’t need to kill more than one or two processes, but it’s very important to realize that as sysadmin you have the tools and ability to affect the jobs running on your system. Whether it’s by changing their priority with renice, or sending them specific signals like -STOP or -HUP with kill, you’re in control.
And with control and power comes responsibility. You’ll have your user community madder than hornets at a summer picnic if you randomly change priorities or kill processes!
Summary
This hour has popped the hood and delved into the mysterious world of Unix process management, starting by learning how to know what processes are running with the ps command, then discussing task prioritization, and finally ending by considering the different methods available for killing processes that shouldn’t be running. Along the way we also explored how to solve a common system administration puzzle: identifying each of the tasks running to ascertain whether they’re needed or not.
Q&A
Q Is the init program always PID 1?
A Certainly on every Unix system I’ve ever seen. The init process manages the sequence of booting up the computer, so it’s the very first application started at boot-time.
Q Why is the nice value the opposite of what you’d expect, where a smaller number is more important than a bigger number?
A A very good question!
Q If there’s a nice command, is there a naughty command too?
A I think we’d have to check the SCUR1 (Santa Claus Unix, Release 1, of course!) Linux man pages for that one. Alternatively, the answer might be that it depends on what you’re doing with your command shell.
Workshop
Quiz
1. Could a job I run later in my session end up with a PID that’s lower than the PID of my login shell?
2. What’s the shortcut to identify the PID of your login shell? And how can you use that to identify what shell you’re running?
3. Is it accurate to say that a process in state T is terminated, pending removal from the process queue?
4. In what situation might your login shell be listed as state S, sleeping?
5. What do you think would happen if you typed kill -9 $$?
6. One of the processes that Red Hat Linux listed in the ps output was mdrecoveryd. Do some detective work and see if you can figure out what it does. (If you don’t have Linux, pick a different mysterious daemon and figure out what that does instead.)
Answers
1. It’s possible to have a subsequent PID be lower, but you’d need your PIDs to cycle back to zero, which would mean that your system would have needed more than MAXINT (maximum possible integer value) processes run since boot-time. Because MAXINT is 232, that’s a lot of processes.
2. The shortcut is $$, and you can identify your shell definitively with ps $$.
3. It is not accurate. A process in state T is either being traced, or more likely, stopped with a SIGSTOP, probably from a ^Z.
4. Any time a subprocess like ps is running, the parent shell sleeps until it completes.
5. You’d log out, lickety-split!
6. The best I can figure is that mdrecoveryd is related to RAID disk subsystems: If you don’t have RAID, you probably don’t need this running. But check your OS documentation to be sure!
In the next hour we’ll explore the ins and outs of cron, a wonderfully helpful utility that lets you schedule jobs at any time in the future.