
CHAPTER 5
DESIGNING THE TRIGGER EVENT AND CASE DATA
Think about the first slides you see in a typical training session. A text title sometimes augmented with a photograph comes first. Next are slides with learning objectives and an agenda. Imagine as an alternative that the first image you see is a video scenario similar to the example shown in Figure 2.1 in which a number of civilians and soldiers die in a failed combat operation. Following the video, you assume the role of the commanding officer. In a series of scenarios you have the opportunity to turn back time and make decisions that will lead to a better outcome.
In this chapter, I’ll describe two key components of a scenario-based e-learning design—the lead-off or trigger event and the case data. Both of these can be derived from the “given” statement of the learning objective, which typically specifies the conditions, tools, and resources learners will have when performing a task. For example, the automotive technician lesson objective is “Given a work order and typical shop testing equipment, the learner will conduct appropriate tests to identify and resolve the failure.” Therefore the trigger event is a work order and the case data will be derived from multiple on-screen testing tools.
WHAT DO YOU THINK?
Before we delve into the specifics of trigger events and case data, which of the following statements do you think is true? You can compare your answers with mine at the end of the chapter.
PLANNING THE TRIGGER EVENT
When learners log into the lesson, what is the first thing they will see? The trigger event is the kick-off or launch of your scenario. It is typically displayed on the first or second screen. The trigger event incorporates the setting as well as the specific event that initiates the scenario. You will want to craft a trigger event that pulls your learners into the scenario right away. Therefore, the trigger event should be job-realistic, compelling, and provide the learner with a clear idea of outcome expectations. To define the setting and trigger event, ask your subject-matter experts one or more of the following:
- How would an assignment or situation requiring actions that will lead to the desired outcome be presented or appear in the normal work environment?
- What is the physical setting in which the initiating event would occur?
- When a worker needs to [fill in verb], what initiates her actions? Where is she?
- How might a mishandled situation look [if you are considering a Murphy’s Law trigger]?
In Table 5.1, I summarize some typical trigger events for the learning domains introduced in Chapter 2.
TABLE 5.1. Some Settings and Trigger Events for Scenario-Based e-Learning Domains
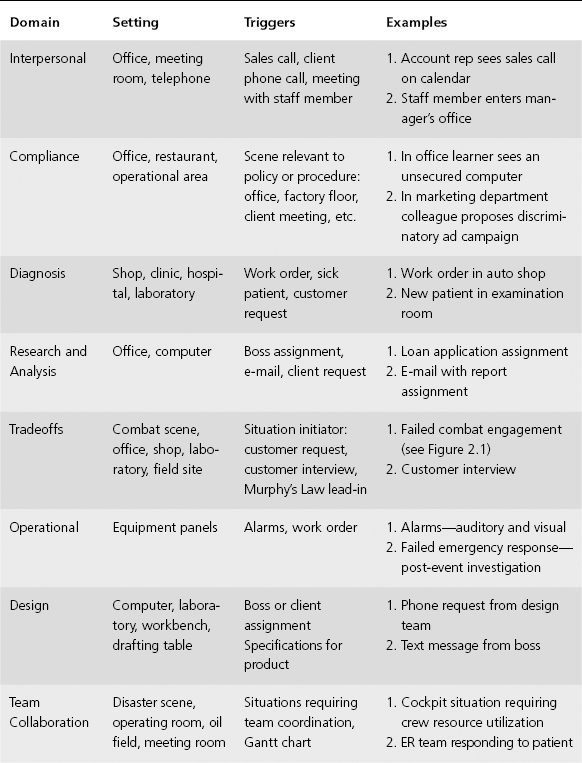
In many cases the trigger event is simple—a workplace setting in which a situation is initiated by a phone call, an e-mail, or a co-worker. A more elaborate approach is what I call the Murphy’s Law trigger. In the Murphy’s Law trigger, the lesson starts with a situation in which incorrect decisions and actions were made and just about everything went wrong. The failed combat scene in Figure 2.1 is one example. A Murphy’s Law trigger may be elaborate, such as the failed combat mission. Alternatively, it may be simple, for example, the Bridezilla course could start with a screen shot showing a disorganized wedding reception and negative comments from the bride, parents, and guests.
DEFINING CASE DATA
Case data refers to specific information about the scenario needed to complete the assignment. For some learning objectives, finding and interpreting case data is one of the outcome deliverables and assumes a major focus of the scenario. This is usually true in diagnosis and research and analysis domains and often true in other domains such as design, team coordination, and operational.
When the access and interpretation of case data is an intended outcome, your interface must offer multiple sources of case data, such as the testing equipment in the automotive shop. While the auto shop uses a very graphical interface, you may decide instead to use a menu design to provide access to case data. For example, in Figure 5.1 the bank loan scenario (research and analysis domain) includes a tab along the top row labeled “data.” When selected, left submenus appear with main categories of “financial data,” “third-party data,” and “client-supplied data.” In this example the learner has selected market research data and has access to various documents relevant to the applicant’s industry.
FIGURE 5.1. The Upper Tabs and Left Menu Links Link to Scenario Data.
With permission from Moody’s Analytics.
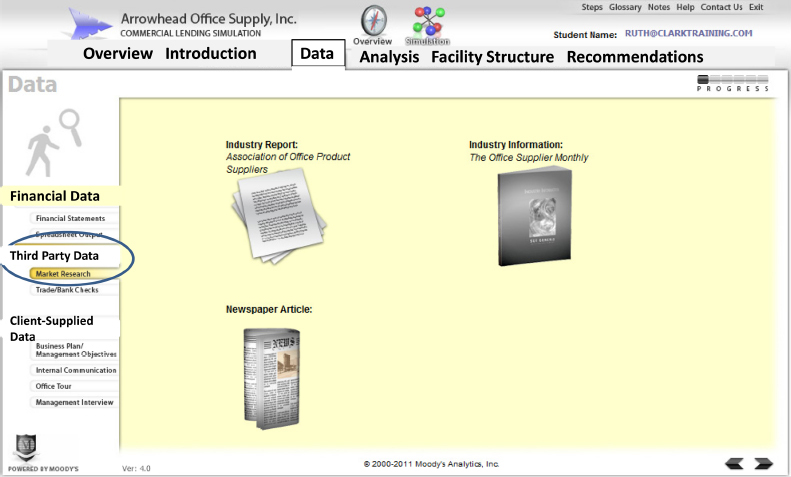
Both the whole screen and menu interfaces support high levels of navigational control so that learners can select the data sources they feel are most relevant at any given time. When your goal is to teach an efficient or logical process for access and interpretation of data, the learners will need a higher level of control to exercise their decision-making skills.
Formats for Case Data
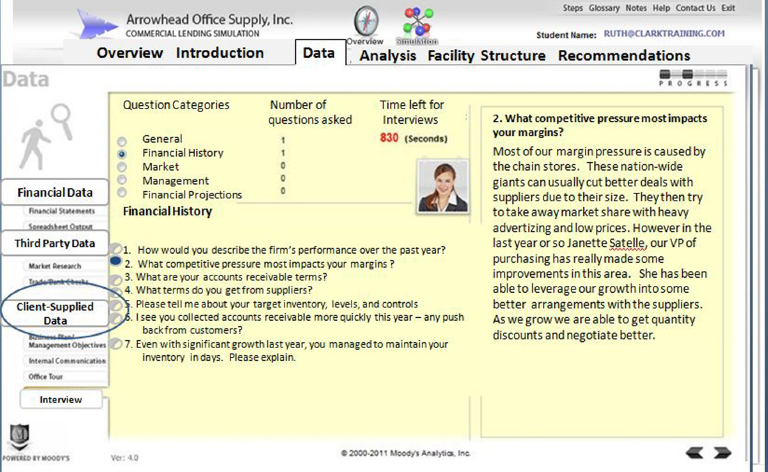
Case data usually can be represented in the form of documents, charts and graphs, interviews, or objects for observation and assessment. For example, in the bank scenario shown in Figure 2.3, the financial data is displayed in a spreadsheet. In the cat anesthesia lesson, case data is displayed through the chart summary of physical signs. In the bank scenario, the learner has the opportunity to gather data through client interviews. As you can see in Figure 5.2, the learner can select from a list those questions she deems most relevant. Because the amount of time allocated to the interview is limited to about 15 minutes, the learner will need to be selective in picking the most relevant questions to ask.
FIGURE 5.2. To Interview Client Managers, the Learner Must Select Relevant Questions in a Limited Time Frame.
With permission from Moody’s Analytics.
Case data that might be hidden in the normal work setting can be displayed in a multimedia lesson. For example, in the Bridezilla interview shown in Figure 1.3 we used an attitude meter as a graphic source of “invisible” client data. If interpretation of sensory data is a focus of your learning objective, it will be important to display objects of sufficient fidelity to support the needed discrimination. For example, when assessing a patient, the color of the skin, the breathing pattern, the lung sounds, the voice quality—all might be relevant and would need realistic rendering. If those discrimination skills are not the focus of learning, the same case data could be provided in descriptive text, such as “patient lips are cyanotic,” “breathing is irregular,” etc.
Compared to the automotive troubleshooting and bank loan lessons, some scenarios may require very little case data. For example, in a compliance scenario, a couple of screens showing a co-worker’s actions or decisions may be all that is needed.
In Table 5.2 I list some examples of case data associated with the scenario domains listed in Chapter 2.
TABLE 5.2. Examples of Case Data for Scenario-Based e-Learning Domains
| Learning Domain | Examples |
| Interpersonal | 1. Sales rep queries client needs 2. Manager reviews employee file |
| Compliance | 1. Records of current or previous incidents 2. Previous records of case 3. Legal judgments |
| Diagnosis | 1. Test data from shop tools 2. Interview of accident witness 3. Patient chart |
| Research and Analysis | 1. Loan application 2. Spreadsheet 3. Interview of manager |
| Tradeoffs | 1. Patient chart 2. Customer interview 3. Gantt chart |
| Operational | 1. Alarms—auditory and visual 2. Equipment performance graphs 3. Equipment specifications and schematics |
| Design | 1. Specification document 2. Gantt chart 3. Customer interview 4. User testing data |
| Team Collaboration | 1. Team members’ skill documents 2. Situation updates via radio or telephone |
Saving and Tracking Case Data
In scenarios requiring learners to access and to interpret multiple sources of case data such as the automotive troubleshooting lesson, consider an on-screen element that allows the learner to save data for later review. For example, in the Bridezilla lesson, much of the case data is derived from the client interview. As the data is gathered, it is annotated in the worksheets under categories of bride and groom, ceremony, or reception. For example, in Figure 5.3 we see a screen from the end of the initial interview with the bride and her mother. Much of the worksheet has been completed and a note about the budget has been made in the lower left field of the worksheet.
FIGURE 5.3. Client Data Is Saved in the Worksheet on the Right, Including the Lower-Left Notes Field.
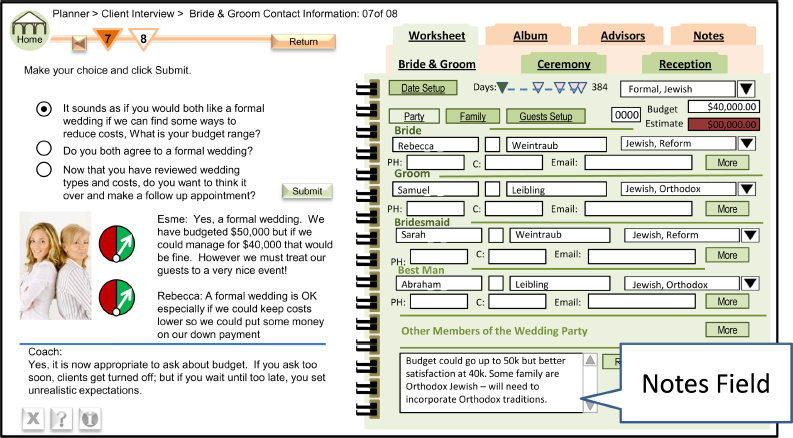
In scenarios that involve identification, accumulation, and interpretation of data, ask yourself how workers save this data on the job and build similar mechanisms into your interface.
WHAT DO YOU THINK? REVISITED
Here are my thoughts about which statements are true or false:
COMING NEXT
By the completion of this chapter, you have thought through the end-point, that is, the scenario outcomes (discussed in Chapter 4) and the starting points, that is, the trigger event and sources of case data. An important feature that distinguishes effective from ineffective scenario-based learning is the guidance provided to minimize learner trial and error. Evidence shows that pure discovery learning is ineffective. Instead, your goal is guided discovery. Chapter 6 will describe and illustrate strategies for learner guidance.

| Trigger | Description |
| Format | Description |