Chapter 33
Creating a PerformancePoint Site
With SharePoint 2007, PerformancePoint was a distinct product used to provide business intelligence (BI) features and reporting dashboards. PerformancePoint is now an integral feature of SharePoint 2010 and is built into the product as a service application. The PerformancePoint service application is configured at the server level and can be consumed by site collections. Your SharePoint administrative team will need to configure the service application for you, as there are several levels of settings that must be specified before it is functional.
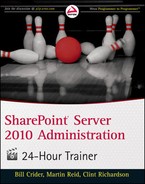
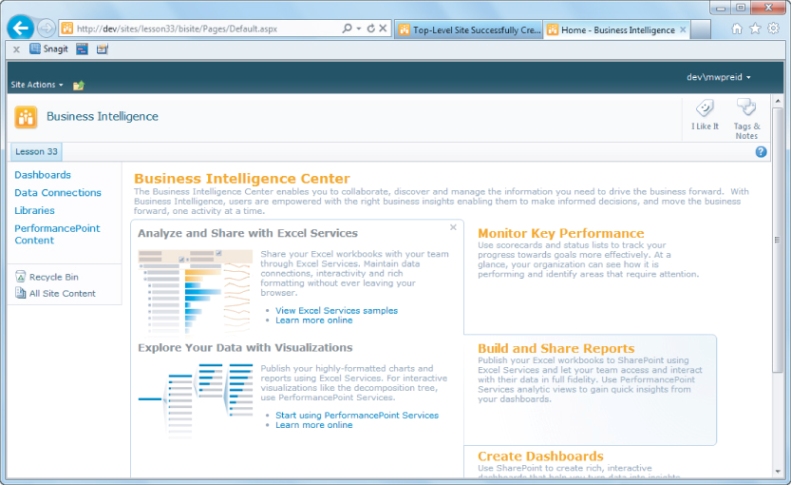
Given the breadth of PerformancePoint and BI tools in general, one lesson can only skim the surface. This lesson shows you how to use the PerformancePoint template, activate PerformancePoint features, and create a basic dashboard using the design tools. Each of these topics could make up a book on its own and a lot of what you will do with PerformancePoint depends on your business need. This lesson looks at a new site collection based on the BI template. Figure 33.1 shows a BI site.
To use PerformancePoint you create a business intelligence site collection using Central Administration, create a BI site from the homepage of a site collection that has the PerformancePoint features activated, or activate the features for an existing team site. For an existing site, you first activate the publishing infrastructure and then activate PerformancePoint features at the site-collection level. You can then activate PerformancePoint features at the individual site level. If you already have PerformancePoint data from SharePoint 2007, it can be imported into the SharePoint 2010 version using the tools provided as part of the PerformancePoint Service Application in Central Administration.
The PerformancePoint site shown in Figure 33.1 shows many of the features of BI in SharePoint and contains multiple links to help you get started. It also includes tips and instructions to help you build BI sites based on PerformancePoint. Areas of the screen are dynamic and if you move the mouse over the text “Monitor Key Performance” they will change, displaying additional information about the chosen topic. Notice the link on the homepage to View SharePoint Samples, which, if clicked, will open a new page to demonstrate some of the features in PerformancePoint. The examples are shown in Figure 33.2.

In this case, a status list and SharePoint chart are displayed. Several other examples are included in the site, including Excel Services demonstrations; you will also find links to useful websites for more information. The BI site contains several objects used by SharePoint that are not usually available in a standard team site, including libraries for the following:
- PerformancePoint Content: PerformancePoint items, including scorecards, KPIs, reports, filters, indicators, and dashboards.
- Sample Indicators: Some sample indicator data for the site.
- Dashboards: Web Part pages, Web Part pages with status lists and PerformancePoint-deployed dashboards.
- Data Connections: Connections used by PerformancePoint to access external data.
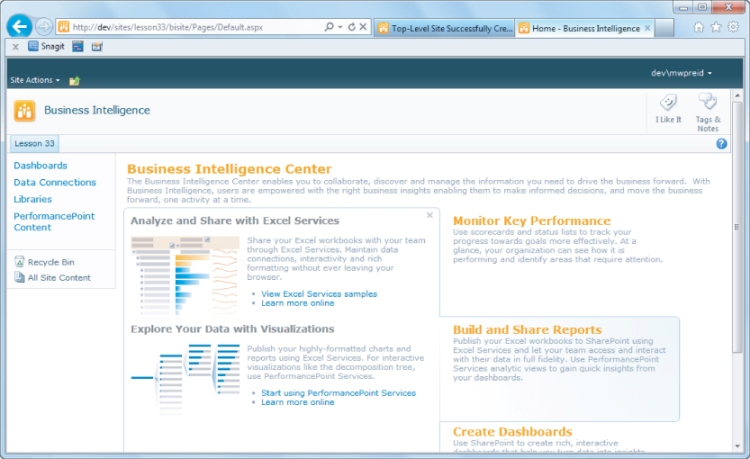
One of the other major changes from team Sites, you will find when using the PerformancePoint site template, is the Dashboard Designer. Figure 33.3 shows the Designer when opened. The Designer is, as you probably have already guessed, used to build dashboards. It is available in your PerformancePoint site. This is a powerful tool and it enables you to gather data from various sources to build BI dashboards and publish them to your SharePoint site. Using the Dashboard Designer, you can connect and return data from the following:
- SQL Server database tables
- Analysis Services
- Excel Services
- Data imported from Excel workbooks
- SharePoint lists
This gives you a wide range of information to choose from when working with BI and PerformancePoint in your site.
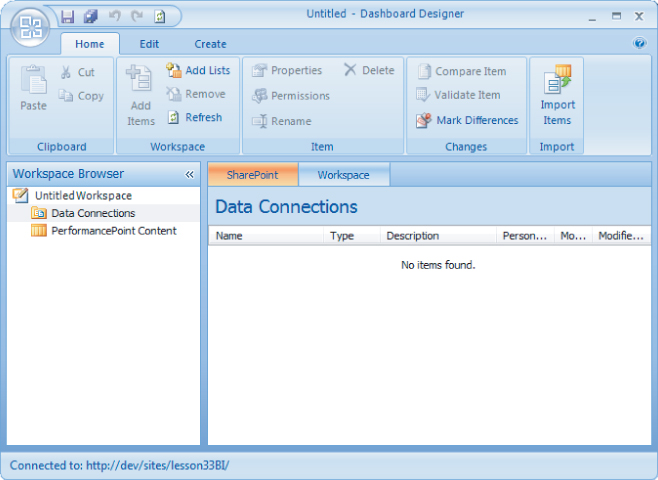
A basic component of a PerformancePoint site is the status list. An example status indicator list is provided with the site template. A sample status indicators list enables you to set a goal and measure your progress toward it. A set of icons is used to highlight targets and issues, for example, targets that are not currently being met. At this stage, you can simply enter the information manually. For example, you can set a goal for travel expenses in a department of $500 per month. You can then manually enter a monthly value of $600. The status indicator list reflects this by using a “danger” icon to show that you are over budget. Of course, at another level, this data can be pulled out of a financial system and automatically populate your list. Figure 33.4 shows the travel expenses example in a status indicator list. You can see that the value for expenses exceeds the goal; this is indicated by the red diamond-shaped icon.
The status list can also be populated from values held within another SharePoint list, which can be centrally maintained or created using the Dashboard Designer. You do of course need permissions to use different aspects of the Dashboard Designer. The following permissions are required:
- To open the Designer: Any authenticated user can open the designer.
- To create dashboard items: Contribute permissions are required.
- To view and use dashboard items: Read permissions are required.
- To add or edit permissions: Full control permissions are required.
Keep in mind that if you access external data sources, you need at least read permissions on those sources. These are in addition to whatever permissions you have in SharePoint.
Running the Dashboard Designer requires only a simple button click within the BI site and it is downloaded and opened, ready for you to start. The Designer can also be opened to add specific content to PerformancePoint lists using the list Ribbon. If you take this approach, the following items can be added once the Designer opens:
- PerformancePoint KPI
- PerformancePoint Score Card
- PerformancePoint Indicator
- PerformancePoint Report
- PerformancePoint Filter
- PerformancePoint Dashboard
After the Designer is open, you can begin to add data sources and other objects to your site and amaze your users with interactive dashboards.
Microsoft's website technet.microsoft.com provides you with more information on PerformancePoint, SharePoint, and instructions for their use.
In this exercise, you will do the following:
- Activate the publishing infrastructure at the site collection level.
- Activate the PerformancePoint features on a standard team site.
- Create a business intelligence site.
- Open the Dashboard Designer and add a data connection to SQL Server and an Excel Services workbook stored in SharePoint.
Lesson Requirements
To complete this Try It exercise, you need the following:
- A sample data set in SQL Server. You can download sample SQL Server 2008 data from codeplex.com if you would like to create the same data connection used in this example.
- A new team site collection in which to enable the various features.
- A workbook stored in a SharePoint document library.
Step-by-Step
To start, you activate the PerformancePoint features on a SharePoint team site. To proceed from within a team site, do the following:
1. Click Site Actions.
2. Click Site Settings.
3. Click Site Collection Features within the site collection administration group.
4. Scroll down through the Features screen and click the Activate button for the SharePoint Server publishing infrastructure.
5. Scroll down through the Features screen and click the Activate button for the PerformancePoint Services site collection features.
6. Return to Site Settings and click Manage Site Features under the Site Actions category.
7. Click Activate for the PerformancePoint Services site features.
You configured the SharePoint environment to support PerformancePoint features and sites. To continue with the process, do the following:
8. Click Site Actions.
9. Click New Site.
10. In the Data category select Data.
11. Click the Business Intelligence Center to select it.
12. Enter Business Intelligence as the title.
13. Enter bisite as the URL.
14. Click Create.
The BI site should open. Figure 33.5 shows the new site open in the browser. Click around to examine the various examples and tutorial links available in the new site.
You can also open the Dashboard Designer to begin learning how this additional tool works. To continue and open the Designer, do the following:
1. Click Monitor Key Performance.
2. Click the Start Using PerformancePoint Service link that appears.
3. Click the Run Dashboard Designer button to download and open the Designer.
4. In the Designer windows, right-click Data Connections.
5. Select New Data Source from the menu.
6. Select SQL Server Table.
7. Click OK.
Figure 33.6 shows the new window that opens to enable you to configure the SQL Server connection.

8. Enter the name of your SQL Server into the Server text box.
9. Using the Database drop-down, select the database required.
10. Using the Table drop-down, select the table you require from the list presented.
11. Click the Properties tab and enter a name for your connection. In this case, as I am using the AdventureWorks example database, I entered AdventureWorksDW. You can download the database from codeplex.com.
At this point you have seen how to enable PerformancePoint on an existing team site, open the Dashboard Designer, and create a connection to SQL Server.
As I said at the start of this lesson, PerformancePoint is a topic for a book of its own, and it is impossible to cover in any detail here. For further information on this complex tool and to continue your training with BI, I recommend SharePoint 2010 Business Intelligence 24-Hour Trainer by Adam Jorgensen, Mark Stacey, Devin Knight, Patrick LeBlanc, and Brad Schacht, also published by Wiley.
Please select Lesson 33 on the DVD or visit www.wrox.com/go/sp2010-24 to view the video that accompanies this lesson.