
4
Raindrops Keep Falling on My Head and Other Goodies
Which weighs more, all of the air in the world or all the water, and how much more? What would happen if all the ice in the world were to melt? What is the average rainfall in the world? What is the velocity and kinetic energy of a raindrop? How much power is in rainfalls? How many times has the world's air been breathed by humans and the world's water drunk by humans?
We now obtain answers to these awesome questions. Nothing difficult in the way of theoretical analysis is introduced. However, there will be quite a few numbers and calculations to consider. We shall be using information given in the text on oceanography by Sverdrup, Johnson, and Fleming (1942) and the intriguing book on environmental science by Harte (1985).
Amount of Air in the World
It is fairly easy to determine how much air there is in the world. We know that at sea level the atmospheric pressure is p0 = 1.01325 × 10⁵ newtons/m2. By definition, this amount is simply the weight of the column of air acting on each square meter of the earth's surface. If we divide this value by the gravitational acceleration, g = 9.82 m/s2, we obtain p0 = 10,318 kg/m2. This is the mass of air resting on every square meter of the earth.
Well, how many square meters are there? The average radius of the earth is R = 6.37 × 10⁶ m and the area of a sphere is A = 4πR2. So we determine that A = 5.10 × 10¹⁴ m2 is the area of the earth.
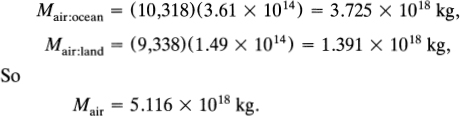
With the above information, the total weight of the air—or, more precisely, the total mass of the atmosphere—is
![]()
This answer can be improved slightly. Recall that P0 is the pressure at sea level. However (and thank goodness), not all of the earth's surface is at sea level. According to Harte (1985), the average elevation of the continents is z = 840 m above sea level. In addition, from Harte, we know that the area of the oceans is A0 = 3.61 × 10¹⁴ m2 (70.8% of the total) and the area of the continents is AC = 1.49 × 10¹⁴ m2 (29.2%).
Since the average elevation of the land surface is 840 meters above sea level, it is clear that the atmospheric pressure is less than at sea level and, in turn, the mass of the air column is less.
It is possible to calculate the atmospheric pressure at a specified elevation by substituting the so-called general gas law into the equation of fluid statics. Doing so, we obtain the expression
![]()
in which p0 is the atmospheric pressure at sea level and p is the atmospheric pressure at any elevation, z, above sea level. The quantity e is the base of natural logarithms; it has the numerical value e = 2.71828. Later on we shall examine this famous number, e, to quite an extent. The other quantities in equation (4.1) are
R*: gas constant; R* = 8.314 joule/°K mol
m: molecular weight of air; m = 28.96 × 10⁻³ kg/mol
g: gravitational acceleration; g = 9.82 m/s2
T: absolute temperature; T (°K) = °C + 273°; T = 15° + 273° = 288 °K
Substitution of these numerical values into equation (4.1), along with z = 840 m, gives p/p0 = 0.905.
This result indicates that at a temperature of 15°C and an elevation of 840 meters, the atmospheric pressure is 90.5% of the pressure at sea level. Consequently, the mass of air acting on each square meter of land surface is 9,338 kg. By the way, to simplify the analysis leading to the result of equation (4.1), we had to assume an isothermal (constant temperature) atmosphere. Although this is not a very realistic assumption, equation (4.1) is surprisingly accurate for elevations up to 3,000 meters.
Now we are able to compute the total mass of air somewhat more precisely:
Amount of Water in the World
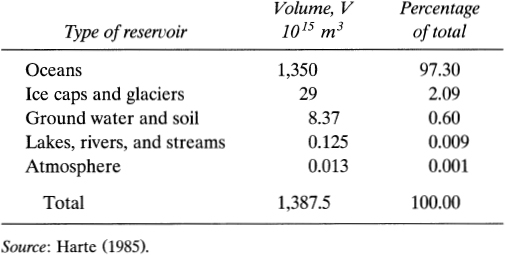
There is no way we can calculate how much water there is in the world; we simply have to look it up. Table 4.1 lists this information; it gives the volumes of water according to type of reservoir.
We note that the oceans hold over 97% of the earth's water. The Pacific contains 52.8% of the ocean total, followed by the Atlantic (including the Arctic) with 25.9% and the Indian with 21.3%.
The total volume of the five Great Lakes of North America is 0.0227 × 10¹⁵ m3. Together they contain about 18% of the world's surface fresh water.
From table 4.1 and the formula M = ρV, where ρ is the density, we easily compute the total mass of water in the world:
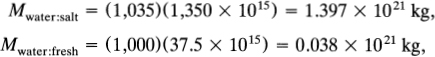
TABLE 4.1
Volume of water in the world

We now summarize the results of this brief analysis. The ratio of the mass of water to the mass of air is 1.435 × 10²¹ kg/(5.116 × 1018 kg) = 280. So the answer to the question at the beginning of this chapter is that all of the water in the world weighs 280 times more than all the air in the world. This is an interesting result. However, an even more interesting aspect of this short problem is that we were able to determine the two total weights, water and air, and their ratio, without much uncertainty and with relatively little difficulty.
Suppose that All the Ice Were to Melt
Here is an interesting question to examine. What would happen if all the ice presently locked up mostly in the polar ice caps and glaciers were to melt? How much would the surface of the ocean rise? How much of the present land areas of the world would be flooded?
From table 4.1 it is seen that the volume of water contained in the ice caps and glaciers is Vice = 29 × 1015 m3. The surface area of the oceans is A0 = 3.61 × 10¹⁴ m2. Dividing the first of these quantities by the second gives the increase in depth, z = 80.3 m.

FIG. 4.1
The hypsometric curve: A plot showing the earth's solid surface area above any given elevation or depth. (From Sverdrup et al. 1942.)
However, as the ocean depth increases, due to melting ice, the ocean area will enlarge as water begins to flood the low-elevation regions of the world. Consequently, the increase in ocean depth will be something less than 80 meters.
To answer the questions we need the so-called hypsometric (or hypsographic) curve shown in figure 4.1. This curve shows the percentage of the earth's solid surface above any given depth or elevation. For example, 29.2% of the earth's land surface is above z = 0 (sea level), 7.9% is above 1,000 meters, and so on.
We now construct a simple mathematical model to guide our analysis. A moment ago we established that the increase in ocean depth due to the melted ice will be something less than 80 meters; how much less is the problem. To solve the problem, it is clear that we need an equation of the hypsometric curve shown in figure 4.1 for values of the elevation z less than, say, 100 meters or so.
As precisely as we can, we match or fit the hypsometric curve of figure 4.1 with a simple straight line relationship applicable for small values of z. Doing so yields the following result:
![]()
in which land Pland is the area of the earth's land surface as a percentage of the earth's total area. Thus, if z = 0 (i.e., present sea level) in equation (4.2), we obtain Pland = 29.2%, a result we already have. If z = 100 m, for example, then Pland = 23.4%.
Next, using the relationship Pland + Pocean = 100.0%, we alter equation (4.2) to the form,
![]()
where Pocean is the area of the earth's ocean surface as a percentage of the earth's total area.
Finally, knowing that the earth's total area is AT = 5.10 × 10¹⁴ m2, we obtain the expression,
![]()
in which A is the area of the ocean surface when the surface is at elevation z and A0 = 3.61 × 10¹⁴ m2 is the area when z = 0. Solving this equation for A, we obtain
![]()
Now we are ready for the final step. From table 4.1, the volume of the ice caps and glaciers is V = 29 × 1015 m3. Since all this ice melts into the ocean, we have
29 × 1015 = z[(3.61 × 10¹⁴) + (0.0030 × 10¹⁴)z]
or
![]()
This is a quadratic equation in z. Recall that if the quadratic equation is written in the general form,
![]()
then its solution is given by
![]()
Using this expression, the solution to equation (4.6) is z = 75 m. So we have our answer. If all the world's ice were to melt, the oceans would rise by about 75 meters (246 feet).
Finally, we note that the quantity A – A0 represents the area of land surface flooded by the rise of the ocean. We easily compute from equation (4.5) that the flooded area is 0.225 × 10¹⁴ m2 or approximately 22.5 million km2. The area of the contiguous 48 states of the United States is 7.62 million km2. So we conclude that the total area flooded by the melted ice, worldwide, would be about three times larger than the 48 states of the United States.
A SUGGESTION FOR A TERM PAPER. Are you looking for an interesting subject for a term paper in your course in geography, science, or mathematics? Well, you might want to use this topic of ice melting in the oceans, but explore the matter to a much greater extent. A good place to begin your analysis is the interesting book by de Blij and Muller (1996).
For example, let's assume that the ocean level rises by 75 meters due to the melted ice. In your term paper, you could examine and respond to the following questions:
What would the substantially altered map of North America look like? What would be the new area of the forty-eight states of the United States? What major cities would be submerged?
Most of Florida vanishes. What about the other low-elevation states, such as Delaware, Louisiana, Mississippi, and Rhode Island? How much of Hawaii disappears?
How are the Saint Lawrence River Valley, Niagara Falls, and the Great Lakes affected? What happens to the Panama Canal?
How are the Central Valley, Death Valley, and Imperial Valley in California changed? Where are the mouths of the Colorado, Mississippi, Columbia, Rio Grande, and Hudson Rivers?
In the United States, approximately how many people have to move to higher ground?
Some Items Involving the Hydrologic Cycle
Most of us have heard about the so-called water cycle or hydrologic cycle. This is the process featuring evaporation of water from ocean and land surfaces, retention of this water vapor in the atmosphere for a relatively short period of time, precipitation of this water, usually in the form of rain, onto oceans and lands, and retention of the water in the ocean, ground, lakes, and rivers for a relatively long period of time. An important component of the cycle is the drainage or runoff of water from land surfaces to the oceans. A diagram illustrating the hydrologic cycle is shown in figure 4.2.
First, we consider evaporation. As indicated in the figure, the total rate of evaporation is Q = 456 + 62 = 518 × 1012 m3/yr. The rate from the surface of the oceans is given by the equation q = Q/A0 = (456 × 1012)/(3.61 × 1014) = 1.263 m/yr, or about 49.7 inches per year. From land surfaces the rate is 0.416 m/yr or 16.4 inches per year. Worldwide, the average rate of evaporation is q = 1.016 m/yr = 40.0 in/yr.
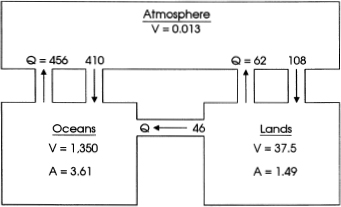
FIG. 4.2
The hydrologic cycle. Units of the quantities are (a) V: 1015 m3, (b) A: 1014 m2, and (c) Q: 1012 m3/yr.
Next, the matter of average retention time or residence time in the atmosphere is examined. Suppose we have a tank containing V = 30 gallons and that water flows into and out of the tank at the rate Q = 5 gallons per minute. Then the average residence time of a water particle in the tank is T = V/Q = 6 minutes.
By the same token, from figure 4.2 it is noted that the amount of water stored in the atmosphere is V = 0.013 × 10¹⁵ m3, and the rates of inflow (evaporation) and outflow (precipitation) are Q = 518 × 1012 m3/yr. Accordingly, the average residence time of a water molecule in the atmosphere is T = 0.025 yr = 9.2 days.
Now we go to the topic of precipitation or rainfall. From the figure we see that the total rate of precipitation is Q = 410 + 108 = 518 × 1012 m3/yr. The average rainfall rate over the oceans is q = 1.136 m/yr = 44.7 inches per year and over land surfaces q = 0.725 m/yr = 28.5 inches per year.
On a worldwide basis, the average rainfall is 1.016 m/yr or 40.0 inches per year. Needless to say, there is a wide range of rainfall rates. Rainfalls of nearly 500 inches per year have been recorded in Hawaii and India. At the other extreme, in desert regions in various parts of the world there is virtually no rainfall whatsoever. The Atacama desert in northern Chile holds the record, with an average annual rainfall of 0.02 inches.
Returning to the matter of residence time, we saw that a water molecule is retained in the atmosphere for an average of only 9.2 days between the time it is evaporated and the time it is precipitated. We make the same kind of computation of average residence time for a water molecule on the earth's surface. That is, T = V/Q = (1,387.5 × 1015)/(518 × 1012) = 2,679 yr. This means that, on the average, a water molecule falling in 680 BC. was finally evaporated in 1999 in order to spend about nine days in the atmosphere before falling back to earth once again. Of course, the residence time of 2,679 years is the average. The residence time of a particular molecule could be a few minutes or it could be many thousands of years.
Finally, a word about runoff. The water balance diagram of figure 2.4 shows a drainage of Q = 46 × 1012 m3/yr from the lands to the oceans. This represents the combined discharges of all the world's rivers, streams, and underground aquifers into the Pacific, Atlantic, Indian, and Arctic oceans. The annual flow indicated above is equivalent to Q = 1,460,000 m3/s. To give a scale to this quantity, we note that the world's mightest river, the Amazon, has an average discharge at its mouth of about 180,000 m3/s. So the Amazon alone handles around 12% of all the world's runoff to the seas.
Our thrilling saga will continue after a brief pause.