
12
How Fast Should You Run in the Rain?
There is a steady downpour of rain, you have no raincoat and no umbrella, and you must get from here to there without delay. And instinctively, you want to get the least wet as you make the excursion of specified distance.
If you walk slowly in the rain, only the top of your head and shoulders get wet; your front stays relatively dry as do your shoes and socks. However, with a slow walk you are out in the rain that much longer. If you jog at moderate speed, your front gets wet and your shoes get soggy from splashing water on the pavement; however, in this case your trip time is reduced. And if you run at full speed, the top of your head and shoulders avoid most of the rain, your front is drenched and your shoes and socks are entirely waterlogged. Even so, in this instance the time you are out in the rain is least.
So the question is asked: with what speed should you move to get least wet? This problem has been examined by Rizika (1950) and by Edwards and Hamson (1990). Both of these earlier analyses included the effect of nonvertical rainfall due to wind but disregarded pavement splashing. We shall do the reverse: neglect wind action but include splashing. This illustration demonstrates the usefulness of differential calculus in solving problems involving maxima and minima.
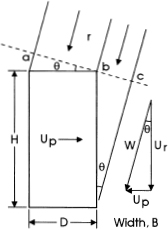
FIG. 12.1
Definition sketch for the rainfall problem.
Analysis of the Problem
The basic dimensions and units of our problem are the following: mass of water (kilograms), distance (meters), and time (seconds). The main variables are a person's velocity Up (m/s), raindrop velocity Ur (m/s), and rainfall rate r (m/s or mm/hr). To characterize the person's dimensions we select an esthetically unattractive but mathematically simple rectangular prism with height H, width B, and thickness D. The person moves in a direction parallel to the D dimension, that is, perpendicular to the BH plane.
A definition sketch is presented in figure 12.1. We note that the combination of velocities Up and Ur establishes a resultant velocity ![]() , inclined at an angle θ to the BH plane.
, inclined at an angle θ to the BH plane.
The volume of rain crossing plain ab per second is
![]()
This is the amount of water collected on the person's head and shoulders (i.e., the top of the prism). Similarly, the volume of rain crossing plane bc per second is
![]()
and this amount of water is retained on the person's front (i.e., the front of the prism).
Next we need an expression to describe the volume of water q3 collecting on the person's shoes and socks (i.e., the bottom of the prism) due to pavement splashing. This is a more difficult problem. A complete examination of this feature would involve three aspects: (a) dimensional analysis, (b) mathematical modeling, and (c) experimental investigation.
Dimensional analysis is a very useful technique that starts, in our problem, with the qualitative statement that the volume of splashing water may depend on a number of parameters. That is, we suppose that
![]()
This expression indicates that the magnitude of q3 is probably affected by the depth of water on the pavement (d), by the bottom dimensions (B and D), by the person's velocity (Up), and by the rainwater's mass density (ρ), dynamic viscosity (μ), surface tension (σ), and gravitational force (g).
A dimensional analysis of the variables listed in equation (12.3) yields the relationship
![]()
where Re, We, and Fr are, respectively, the so-called Reynolds, Weber, and Froude numbers. These quantities are very important in the field of fluid mechanics. Barenblatt (1987) is an easy-to-understand book that deals with all of these topics.
Augmenting the techniques of dimensional analysis are straightforward mathematical analysis and experimental studies. With regard to our rainfall problem, reference is made to the experiments of Mutchler and Larson (1971) concerning the mechanics of raindrop splash erosion of soil. Utilizing their results, as well as those of dimensional and mathematical analyses, we establish that the volume of water splashing onto the bottom plane BD per second is
![]()
where c is a dimensionless constant, d is the water depth on the pavement, and ![]() is the kinematic viscosity of water.
is the kinematic viscosity of water.
Utilizing the relationships ![]() and
and ![]() we combine equations (12.1), (12.2), and (12.5) to obtain
we combine equations (12.1), (12.2), and (12.5) to obtain
![]()
which expresses the total volume of water collected on the person per second. The total number of seconds during the journey of length L is ![]() Using
Using ![]() , the total volume of water collected on the trip is
, the total volume of water collected on the trip is
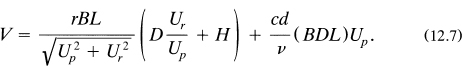
This equation can be put into the following dimensionless form:

in which ![]() is the wetness factor, S = Up/Ur is the speed ratio, n = D/H is the aspect ratio, and finally f = cdUp2/vr is the splash number.
is the wetness factor, S = Up/Ur is the speed ratio, n = D/H is the aspect ratio, and finally f = cdUp2/vr is the splash number.
A word about this last parameter, the splash number. This is simply an index or scale to describe how wet the pavement or ground surface is. In this sense, it is like the Dow-Jones index for the stock market, the Richter scale for earthquakes, or the Beaufort number for a sea-wind condition. A short list of splash numbers is presented in table 12.1.
The main result of our analysis is equation (12.8). This expression indicates that the amount of wetness, Z, depends on the person's speed as a fraction of raindrop velocity. Several plots of (12.8) are shown in figure 12.2 for various values of splash number f, with a constant value of aspect ratio, n = 0.15.
TABLE 12.1
Splash number f for various surfaces
| surface description | value of f |
| Dry pavement or dry grass | 0 |
| Damp grass | 5 |
| Wet pavement | 10 |
| Puddly pavement | 15 |
| Gutter or very shallow stream | 20 |
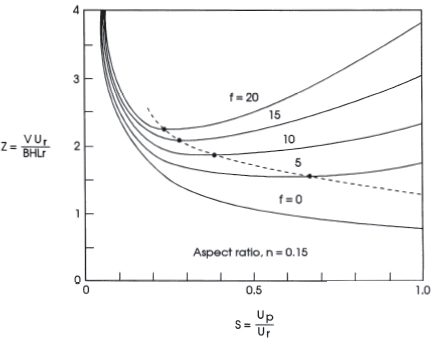
FIG. 12.2
Wetness factor Z as a function of the speed ratio S for various values of the splash number f.
In the figure we note several things. First, if f = 0, that is, the pavement or grass is dry, there is no optimum point on the curve. In this case, a person should run as fast as possible to minimize the amount of rain collected. However, for values of f > 0 there are optimum speed points that do provide minimum wetness. Furthermore, as f increases, the optimum speed decreases. In this case, a person should adjust his or her speed in order to minimize wetness.
Now one could determine the “best” speed ratio directly from figure 12.2. However, if we utilize the methods of differential calculus we can be more precise. This involves a step known as “taking the first derivative” of equation (12.8). Basically, this procedure allows us to compute the “slope” at any point on one of the curves of figure 2.12. We note that when the slope is zero (i.e., a line parallel to the S-axis), we have identified the value of S corresponding to the minimum value of Z. Of course, this is what we are after.
If we take the first derivative of equation (12.8) and set it equal to zero, we obtain
![]()
where Sm is the value of the speed ratio corresponding to the minimum value of the wetness factor, Zm. Now in a great many problems involving determination of minimum values it is possible to solve an equation analogous to (12.9) to obtain the desired quantity. In our problem, however, we cannot obtain an explicit solution for Sm. Nevertheless, for specified values of f and n, it is not difficult to compute Sm from equation (12.9) by trial-and-error calculation. Table 12.2 lists the minimum points for the curves displayed in figure 12.2. The dashed line in the figure is the locus of these points.
There is considerable information about the velocity of raindrops. A typical study is that of Dingle and Lee (1972), who show that the terminal velocity of a drop depends primarily on its diameter. A list of raindrop velocities at sea level, computed from their equation, is shown in table 12.3.
TABLE 12.2
Optimum velocity coordinates

TABLE 12.3
Raindrop velocities at sea level
| Diameter, mm | Ur, m/s | |
| 1.0 | 3.9 | |
| 2.0 | 6.6 | |
| 3.0 | 8.1 | |
| 4.0 | 8.8 | |
| 5.0 | 9.1 |
Of course, in a particular rainstorm there is a wide distribution of raindrop diameters and hence raindrop velocities. If the rainfall rate r = 25 mm/hr, the mean diameter is about 1.9 mm, and if r = 100 mm/hr, the mean drop size is approximately 2.5 mm. Accordingly, a typical raindrop velocity is around 6 to 7 m/s.
An Example
A young lady leaves her office at the end of the day to face her customary (L = 500 m) trip to the train station. Unfortunately, there is a pouring-down rain. Indeed, it has been raining all afternoon; the soggy route to the station can best be characterized as “puddly pavement” (f = 15).
The young lady's dimensions, brutally simplified, are B = 55 cm, D = 24 cm, and H = 160 cm; accordingly, n = D/H = 0.15. Before she steps out into the rain to begin her trek, she quickly ascertains that the rainfall rate is r = 25 mm/hr and the raindrop velocity is Ur = 6.5 m/s.
Then she makes the following rapid calculations. From table 12.2 she determines that Sm = 0.278 and Zm = 2.110. Since Sm = Up,m/Ur and Ur = 6.5 m/s, she easily computes that her jogging speed to get least wet should be Up,m = 1.81 m/s = 5.93 ft/s. At this speed she will be able to reach the train station in T = 500/1.81 = 276 seconds = 4.6 minutes.
As she jogs to the station, she remembers the first of the relationships following equation (12.8):
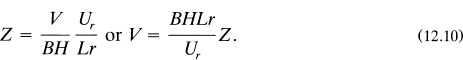
Making certain that all quantities are in consistent (MKS) units, she substitutes the numbers into (12.10):
to determine that ![]() of water has collected or will collect on her person during her jog. The weight of this water is 991 grams or about 2.19 pounds. Finally, from the relative values of the terms of equation (12.8) she determines that 224 grams (24.6% of the total) of water collects on her head and shoulders, 453 grams (45.7%) on her jacket and slacks, and 294 grams (29.7%) on her shoes and socks.
of water has collected or will collect on her person during her jog. The weight of this water is 991 grams or about 2.19 pounds. Finally, from the relative values of the terms of equation (12.8) she determines that 224 grams (24.6% of the total) of water collects on her head and shoulders, 453 grams (45.7%) on her jacket and slacks, and 294 grams (29.7%) on her shoes and socks.
This point concerning distribution of collected water is illustrated in figure 12.3 for the case f = 15 and n = 0.15. We note from the figure that the Z1 and Z3 curves descend and ascend, respectively, with increasing speed ratio S. However, the Z2/Z (frontal wetness) curve possesses a maximum point. To determine this point we simply construct the ratio of the second term of equation (12.8) to the sum of the three terms. Then, as before, we take the first derivative of the resulting expression and equate it to zero. The answer is
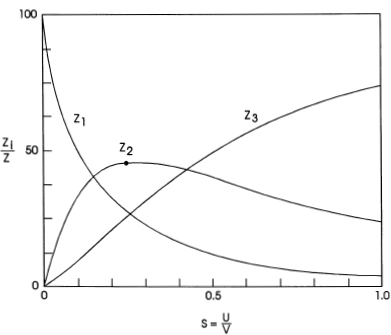
FIG. 12.3
Percentage distribution of collected rainfall. Top plane, frontal plane, Z2, bottom plane, Z3. Splash number f = 15; aspect ratio n = 0.15.
in which S* is the speed ratio corresponding to the maximum value of Z2/Z. In our example, S* = 0.247, (Z2/Z)* = 0.459, and Z* = 2.116. We note that the critical point (S*, Z*) is very close to the more important critical point (Sm, Zm).
Back to our clever young lady. Clearly, if she is wearing a new hat or has a new hairdo she should, according to the Z1/Z curve of figure 12.3, run as fast as possible. Alternatively, if she has a new pair of shoes then, from the Z3/Z curve, she should walk quite slowly. Finally, if she has a new hat, a new pair of shoes, and a new jacket and slacks, she should take a taxi to the station.