
Chapter 13. Specifying data requirements
Long ago I led a software project on which the three developers sometimes inadvertently used different variable names, lengths, and validation criteria for the same data item. In fact, I used different lengths for the variable that held the user’s name in two programs I wrote myself. Bad things can happen when you interconvert data of different lengths. You can overwrite other data, pick up stray pad characters at the end, have unterminated character strings, and even overwrite program code, eventually causing a crash. Bad things.
Our project suffered from the lack of a data dictionary—a shared repository that defines the meaning, composition, data type, length, format, and allowed values for data elements used in the application. As soon as the team began defining and managing our data in a more disciplined way, all of those problems disappeared.
Computer systems manipulate data in ways that provide value to customers. Although they were not shown explicitly in the three-level requirements model in Figure 1-1 in Chapter 1 data requirements pervade the three levels. Anywhere there are functions, there is data. Whether the data represents pixels in a video game, packets in a cell phone call, your company’s quarterly sales figures, your bank account activity, or anything else, software functionality is specified to create, modify, display, delete, process, and use data. The business analyst should begin collecting data definitions as they pop up during requirements elicitation.
A good place to start is with the input and output flows on the system’s context diagram. These flows represent major data elements at a high level of abstraction, which the BA can refine into details as elicitation progresses. Nouns that users mention during requirements elicitation often indicate important data entities: chemical request, requester, chemical, status, usage report. This chapter describes ways to explore and represent the data that’s important to your application’s users, along with ways to specify any reports or dashboards your application needs to generate.
Modeling data relationships
Just as the data flow diagram described in Chapter 12 illustrates the processes that take place in a system, a data model depicts the system’s data relationships. A data model provides the high-level view of the system’s data; the data dictionary provides the detailed view.
A commonly used data model is the entity-relationship diagram or ERD ([ref200]). If your ERD represents logical groups of information from the problem domain and their interconnections, you’re using the ERD as a requirements analysis tool. An analysis ERD helps you understand and communicate the data components of the business or the system, without implying that the product will necessarily even include a database. When you create an ERD during design, you’re defining the logical or physical (implementation) structure of the system’s database. That implementation view extends or completes the understanding of the system begun during analysis and optimizes its realization in, say, a relational database environment.
Entities could represent physical items (including people) or aggregations of data that are important to the business you’re analyzing or to the system you intend to build. Entities are named as singular nouns and are shown in rectangles in an ERD. Figure 13-1 illustrates a portion of the entity-relationship diagram for the Chemical Tracking System, using the Peter Chen notation, one of several common ERD modeling notations. Notice that the entities named Chemical Request, Vendor Catalog, and Chemical Stockroom Inventory appeared as data stores in the data flow diagram in Figure 21-1 in Chapter 12. Other entities represent actors who interact with the system (Requester), physical items that are part of the business operations (Chemical Container), and blocks of data that weren’t shown in the level 0 DFD but that would appear on a lower-level DFD (Container History, Chemical). During physical database design of a relational database, entities normally become tables.
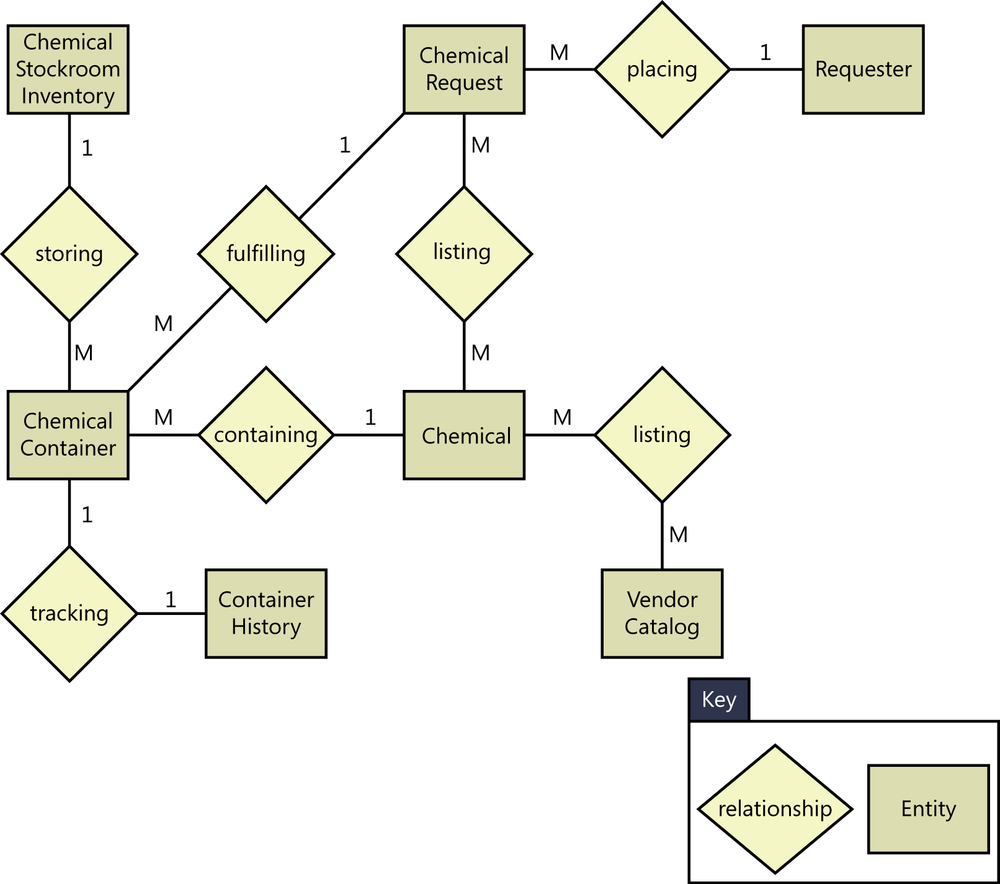
Each entity is described by one or more attributes; individual instances of an entity will have different attribute values. For example, the attributes for each chemical include a unique chemical identifier, its chemical name, and a graphical representation of its chemical structure. The data dictionary contains the precise definitions of those attributes, which helps ensure that entities in the ERD and their corresponding data stores in the DFD are defined identically.
The diamonds in the ERD represent relationships, which identify the logical linkages between pairs of entities. Relationships are named in a way that describes the nature of the connection. For example, the relationship between the Chemical Request and the Requester is a placing relationship. You can read the relationship as either “a Chemical Request is placed by a Requester” (left-to-right, passive voice) or as “a Requester places a Chemical Request” (right-to-left, active voice). Some conventions would have you label the relationship diamond “is placed by,” which makes sense only if you read the diagram from left to right. If you happened to redraw the diagram such that relative positions of Requester and Chemical Request were reversed, then the “is placed by” relationship name would be incorrect when read left to right: “a Requester is placed by a Chemical Request” is wrong. It’s better to name the relationship “placing” and then just restate “placing” in whichever way is grammatically logical—“places” or “is placed by”—when you read the statement.
When you ask customers to review an ERD, ask them to check whether the relationships shown are all correct and appropriate. Also ask them to identify any missing entities or any possible relationships between entities that the model doesn’t show.
The cardinality, or multiplicity, of each relationship is shown with a number or letter on the lines that connect entities and relationships. Different ERD notations use different conventions to represent cardinality; the example in Figure 13-1 illustrates one common approach. Because each Requester can place multiple requests, there’s a one-to-many relationship between Requester and Chemical Request. This cardinality is shown with a 1 on the line connecting Requester and the placing relationship and an M (for many) on the line connecting Chemical Request and the placing relationship. Other possible cardinalities are one-to-one (every Chemical Container is tracked by a single Container History) and many-to-many (every Vendor Catalog lists many Chemicals, and some Chemicals are listed in multiple Vendor Catalogs). If you know that a more precise cardinality exists than simply many (one person has exactly two biological parents), you can show the specific number or range of numbers instead of the generic M.
Alternative ERD notations use different symbols on the lines connecting entities and relationships to indicate cardinality. In the James Martin notation illustrated in Figure 13-2, the entities still appear as rectangles, but the relationship between them is labeled on the line that connects the entities. The vertical line next to Chemical Stockroom Inventory indicates a cardinality of 1, and the crow’s foot symbol next to Chemical Container indicates a cardinality of many. The circle next to the crow’s foot means that the Chemical Stockroom Inventory stores zero or more Chemical Containers.

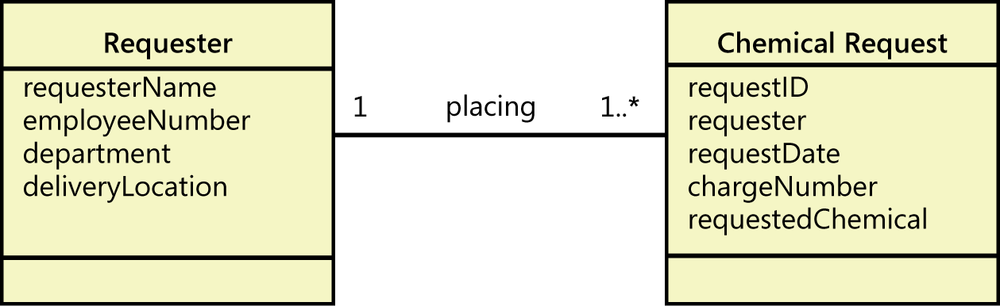
Other data modeling conventions are available besides the various ERD notations. Teams that are applying object-oriented development methods will draw UML class diagrams, which show the data attributes for individual classes (which correspond to entities in the ERD), the logical links between classes, and the cardinalities of those links. Figure 13-3 illustrates a fragment of a class diagram for the Chemical Tracking System. It shows the one-to-many relationship between a Requester and a Chemical Request, each of which is a “class” shown in a rectangle. The “1..* notation means “one or more;” several other cardinality (or multiplicity) notations also can be used in class diagrams ([ref006]). Note that the class diagram also lists the attributes associated with each class in the middle section of the rectangle. Figure 13-3 shows just a simplified version of the class diagram notation. When class diagrams are used for object-oriented analysis or design, the bottommost section of a class rectangle (empty in this example) normally shows the operations, or behaviors, that an object of the class can perform. For data modeling, though, that third section of the class rectangle is left empty.
It’s not important which notation you select for drawing a data model. What is important is that everyone involved with the project (and ideally, everyone in the organization) who creates such models follows the same notation conventions, and that everyone who has to use or review the models knows how to interpret them.
Of course, the system must also contain the functionality that does something useful with the data. The relationships between entities often reveal such functionality. Figure 13-1 showed that there is a “tracking” relationship between the entities Chemical Container and Container History. Therefore, you’ll need some functionality—perhaps captured in the form of a use case, a user story, or a process flow—to give the user access to the history for a given chemical container. As you analyze your project requirements with the help of the data models, you might even discover unneeded data that came up in the discussion but that isn’t used anywhere.
The data dictionary
A data dictionary is a collection of detailed information about the data entities used in an application. Collecting the information about composition, data types, allowed values, and the like into a shared resource identifies the data validation criteria, helps developers write programs correctly, and minimizes integration problems. The data dictionary complements the project glossary, which defines application domain or business terms, abbreviations, and acronyms. We recommend keeping the data dictionary and the glossary separate.
During requirements analysis, the information in the data dictionary represents data elements and structures of the application domain ([ref013]). This information feeds into design in the form of database schemas, tables, and attributes, which ultimately lead to variable names in programs. The time you invest in creating a data dictionary will be more than repaid by avoiding the mistakes that can result when project participants have different understandings of the data. If you keep the data dictionary current, it will remain a valuable tool throughout the system’s operational life and beyond. If you don’t, it might falsely suggest out-of-date information, and team members will no longer trust it. Maintaining a data dictionary is a serious investment in quality. Data definitions often are reusable across applications, particularly within a product line. Using consistent data definitions across the enterprise reduces integration and interface errors. When possible, refer to existing standard data definitions from a repository of enterprise knowledge, using a smaller, project-specific set to close the gaps.
As opposed to sprinkling data definitions throughout the project documentation, a separate data dictionary makes it easy to find the information you need. It also helps avoid redundancies and inconsistencies. I once reviewed some use case specifications that identified the data elements that made up certain data structures. Unfortunately, these compositions weren’t the same in all the places where they appeared. Such inconsistency forces a developer or tester to track down which—if any—of the definitions is correct. Maintaining the integrity of the replicated data structures as they evolve is also difficult. Compiling or consolidating such information so that there is only one instance of each definition that is readily accessible by all stakeholders solves these problems.
Figure 13-4 illustrates a portion of the data dictionary for the Chemical Tracking System. The notations used are described in the following paragraphs. Organize the entries in the data dictionary alphabetically to make it easy for readers to find what they need.
Data Element | Description | Composition or Data Type | Length | Values |
Chemical Request | request for a new chemical from either the Chemical Stockroom or a vendor | Request ID + Requester + Request Date + Charge Number + 1:10{Requested Chemical} | ||
Delivery Location | the place to which requested chemicals are to be delivered | Building + Lab Number + Lab Partition | ||
Number of Containers | number of containers of a given chemical and size being requested | Positive integer | 3 | |
Quantity | amount of chemical in the requested container | numeric | 6 | |
Quantity Units | units associated with the quantity of chemical requested | alphabetic characters | 10 | grams, kilograms, milligrams, each |
Request ID | unique identifier for a request | integer | 8 | system-generated sequential integer, beginning with 1 |
Requested Chemical | description of the chemical being requested | Chemical ID + Number of Containers + Grade + Quantity + Quantity Units + (Vendor) | ||
Requester | information about the individual who placed a chemical request | Requester Name + Employee Number + Department + Delivery Location | ||
Requester Name | name of the employee who submitted the request | alphabetic characters | 40 | can contain blanks, hyphens, periods, apostrophes |
Entries in the data dictionary can represent the following types of data elements.
Primitive A primitive data element is one for which no further decomposition is possible or necessary. Primitives defined in Figure 13-4 are Number of Containers, Quantity, Quantity Units, Request ID, and Requester Name. You can use other columns in the data dictionary to describe each primitive’s data type, length, numerical range, list of allowed values (as with Quantity Units), and other pertinent attributes.
Structure A data structure (or a record) is composed of multiple data elements. Data structures shown in Figure 13-4 are Chemical Request, Delivery Location, Requested Chemical, and Requester. The “Composition or Data Type” column in the data dictionary is a place to list the elements that make up the structure, separating the elements with plus (+) signs. Structures also can incorporate other structures: the Requester structure includes the Delivery Location structure. Data elements that appear in a structure must also have definitions in the data dictionary.
If an element in a data structure is optional (a value doesn’t have to be supplied by the user or the system), enclose it in parentheses. In the Requested Chemical structure, the Vendor data element is optional because the person submitting the request might not know or care which vendor supplies the chemical.
Hyperlinks are useful in such a data dictionary layout (although storing the information in a tool that permits defining such links is even better). As an illustration, the data item called Quantity in the Requested Chemical data structure in Figure 13-4 is shown as a hyperlink. The reader could click on that link and jump to the definition of Quantity elsewhere in the data dictionary. Navigation links are very helpful in an extensive data dictionary that could span many pages, or even multiple documents if a project’s data dictionary incorporates some definitions from an enterprise-wide data dictionary. It’s a good idea to include hyperlinks for all items found in the “Composition or Data Type” column that are defined in the data dictionary.
Repeating group If multiple instances of a particular data element can appear in a structure, enclose that item in curly braces. Show the allowed number of possible repeats in the form minimum:maximum in front of the opening curly brace. As an example, Requested Chemical in the Chemical Request structure is a repeating group that appears as 1:10{Requested Chemical}. This shows that a chemical request must contain at least one chemical but may not contain more than 10 chemicals. If the maximum number of instances in a repeating field is unlimited, use “n” to indicate this. For example, “3:n{something}” means that the data structure being defined must contain at least three instances of the “something” and there is no upper limit on the number of instances of that “something.”
Precisely defining data elements is harder than it might appear. Consider a data type as simple as alphabetic characters, as is indicated for the Requester Name entry in Figure 13-4. Is a name case-sensitive, such that “Karl” is different from “karl”? Should the system convert text to all uppercase or all lowercase, retain the case in a looked-up or user-entered value, or reject an input that doesn’t match the expected case? Can any characters other than the 26 letters in the English alphabet be used, such as blanks, hyphens, periods, or apostrophes, all of which might appear in names? Is only the English alphabet permitted, or can alphabets with diacritical marks—tilde (~), umlaut (¨), accent (´), grave (`), cedilla (¸)—be used? Such precise definitions are essential for the developer to know exactly how to validate entered data. The formats to be used for displaying data elements introduce yet another level of variability. There are many ways to show timestamps and dates, for example, with different conventions used in different countries. [ref253] describes many considerations to keep in mind when specifying various data types.
Data analysis
When performing data analysis, you can map various information representations against one another to find gaps, errors, and inconsistencies. The entities in your entity-relationship diagram are likely defined in the data dictionary. The data flows and stores in your DFD are probably found somewhere in your ERD, as well as in the data dictionary. The display fields found in a report specification also should appear in the data dictionary. During data analysis, you can compare these complementary views to identify errors and further refine your data requirements.
A CRUD matrix is a rigorous data analysis technique for detecting missing requirements. CRUD stands for Create, Read, Update, and Delete. A CRUD matrix correlates system actions with data entities to show where and how each significant data entity is created, read, updated, and deleted. (Some people add an L to the matrix to indicate that the entity appears as a List selection, M to indicate moving data from one location to another, and perhaps a second C to indicate copying data. We’ll stick with CRUD here for simplicity.) Depending on the requirements approaches you are using, you can examine various types of correlations, including the following:
Figure 13-5 illustrates an entity/use case CRUD matrix for a portion of the Chemical Tracking System. Each cell indicates how the use case in the leftmost column uses each data entity shown in the other columns. The use case can create, read, update, or delete the entity. After creating a CRUD matrix, see whether any of these four letters do not appear in any of the cells in a column. For instance, if an entity is updated but never created, where does it come from?
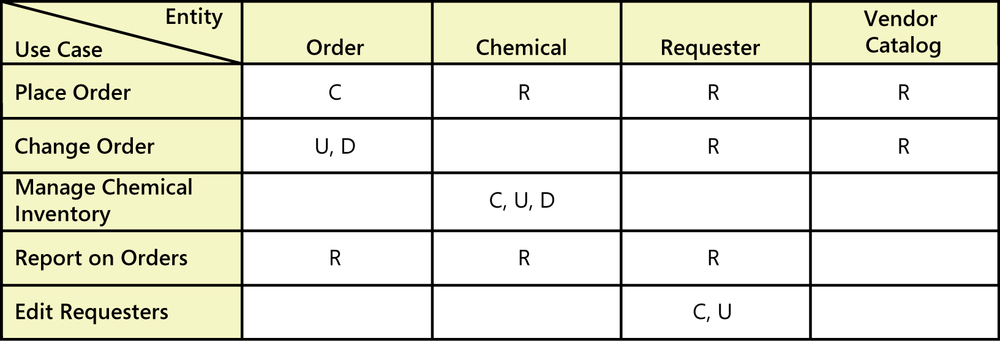
Notice that none of the cells under the column labeled Requester (the person who places an order for a chemical) contains a D. That is, none of the use cases in Figure 13-5 can delete a Requester from the list of people who have ordered chemicals. There are three possible interpretations:
Deleting a Requester is not an expected function of the Chemical Tracking System.
We are missing a use case that deletes a Requester.
The “Edit Requesters” use case (or some other use case) is incomplete. It’s supposed to permit the user to delete a Requester, but that functionality is missing from the use case at present.
We don’t know which interpretation is correct, but the CRUD analysis is a powerful way to detect missing requirements.
Specifying reports
Many applications generate reports from one or more databases, files, or other information sources. Reports can consist of traditional tabular presentations of rows and columns of data, charts and graphs of all types, or any combination. Exploring the content and format of the reports needed is an important aspect of requirements development. Report specification straddles requirements (what information goes into the report and how it is organized) and design (what the report should look like). This section suggests specific aspects of reports to ask about and information to record. A template for specifying reports also is included.
Eliciting reporting requirements
If you’re a BA working with customers on defining reporting requirements for an information system, consider asking questions like the following:
What reports do you currently use? (Some reports from an existing system, or manually generated reports from the business, will need to be replicated in the new system.)
Which existing reports need to be modified? (A new or revised information system project provides an opportunity to update reports that don’t fully meet current needs.)
Which reports are currently generated but are not used? (Perhaps you don’t need to build those into the new system.)
Can you describe any departmental, organizational, or government standards to which reports must conform, such as to provide a consistent look and feel or to comply with a regulation? (Obtain copies of those standards and examples of current reports that meet them.)
[ref253] describes a pattern and template for specifying report requirements. [ref013] also offer extensive guidance for specifying reports. Following are some questions to explore for each customer-requested report. The first set of questions deals with the context for the report and its usage:
What is the name of the report?
What is the purpose or business intent of the report? How do the recipients of the report use the information? What decisions will be made from the report, and by whom?
Is the report generated manually? If so, how frequently and by which user classes?
Is the report generated automatically? If so, how frequently and what are the triggering conditions or events?
What are the typical and maximum sizes of the report?
Is there a need for a dashboard that would display several reports and/or graphs? If so, must the user be able to drill down or roll up any of the dashboard elements?
What is the disposition of the report after it is generated? Is it displayed on the screen, sent to a recipient, exported to a spreadsheet, or printed automatically? Is it stored or archived somewhere for future retrieval?
Are there security, privacy, or management restrictions that limit the access of the report to specific individuals or user classes, or which restrict the data that can be included in the report depending on who is generating it? Identify any relevant business rules concerning security.
The following questions will elicit information about the report itself:
What are the sources of the data and the selection criteria for pulling data from the repository?
What calculations or other data transformations are required?
What are the criteria for sorting, page breaks, and totals?
How should the system respond if no data is returned in response to a query when attempting to generate this report?
Should the underlying data of the report be made available to the user for ad hoc reporting?
Can this report be used as a template for a set of similar reports?
Report specification considerations
The following suggestions might be useful as the BA explores reporting requirements.
Consider other variations When a user requests a specific report, the BA could suggest variations on that theme to see if altering or augmenting the report would add business value. One variation is simply sequencing the data differently, such as providing order-by capability on data elements beyond those the user initially requested. Consider providing the user with tools to specify the column sequence. Another type of variation is to summarize or drill down. A summarized report aggregates detailed results into a more concise, higher-level view. “Drill down” means to produce a report that displays the supporting details that fed into the summary data.
Find the data Ensure that the data necessary to populate the report is available to the system. Users think in terms of generating the outputs they want, which implies certain inputs and sources that will make the necessary data available. This analysis might reveal previously unknown requirements to access or generate the needed data. Identify any business rules that will be applied to compute the output data.
Anticipate growth Users might request particular reports based on their initial conceptions of how much data or how many parameters might be involved. As systems grow over time, an initial report layout that worked well with small quantities of data might prove intractable. For instance, a columnar layout for a certain number of company divisions would fit nicely on one page. But doubling the number of company divisions might lead to awkward page breaks or the need to scroll a displayed report horizontally. You might need to change the layout from portrait to landscape mode or to transpose the information shown from columnar layout to rows.
Look for similarities Multiple users—or even the same user—might request similar, but not identical, reports. Look for opportunities to merge these variations into a single report that provides flexibility to meet diverse needs without requiring redundant development and maintenance effort. Sometimes the variations can be handled with parameters to provide the necessary user flexibility.
Distinguish static and dynamic reports Static reports print out or display data as of a point in time. Dynamic reports provide an interactive, real-time view of data. As underlying data changes, the system updates the report display automatically. My accounting software has this feature. If I’m looking at an expense report and then enter a new check I recently wrote, the displayed expense report updates immediately. Indicate which type of report you are requesting and tailor the requirements accordingly.
Prototype reports It’s often valuable to create a mock-up of the report that illustrates a possible approach to stimulate user feedback, or to use a similar existing report to illustrate the desired layout. Generating such a prototype while discussing requirements can lead the elicitation participants to impose design constraints, which might or might not be desirable. Other times, the developer will create a sample report layout during design and solicit customer feedback. Use plausible data in the mock-up to make the prototype experience realistic for the users who evaluate it.
A report specification template
Figure 13-6 suggests a template for specifying reports. Some of these report elements will be determined during requirements elicitation; others will be established during design. The requirements might specify the report contents, whereas the design process establishes the precise layout and formatting. Existing reporting standards might address some of the items in the template.
Report EIement | Element Description |
Report ID | Number, code, or label used to identify or classify the report |
Report Title |
|
Report Purpose | Brief description of the project, background, context, or business need that led to this report |
Decisions Made from Report | The business decisions that are made using information in the report |
Priority | The relative priority of implementing this reporting capability |
Report Users | User classes who will generate the report or use it to make decisions |
Data Sources | The applications, files, databases, or data warehouses from which data will be extracted |
Frequency and Disposition |
|
Latency |
|
Visual Layout |
|
Header and Footer | The following items are among those that could be positioned somewhere in the report header or footer. For each element included, specify the location on the page and its appearance, including font face, point size, text highlighting, color, case, and text justification. When a title or other content exceeds its allocated space, should it be truncated, word-wrapped to the next line, or what?
|
Report Body |
|
End-of-Report Indicator | Appearance and position of any indicator that appears at the end of the report |
Interactivity |
|
Security Access Restrictions | Any limitations regarding which individuals, groups, or organizations are permitted to generate or view the report or which data they are permitted to select for inclusion |
Not all of these elements and questions will pertain to every report. Also, there is considerable variation in where elements might be placed. The report title could appear just on the top of the first page or as a header on every page. Use the information in Figure 13-6 as a guide to help the BA, customers, developers, and testers understand the requirements and design constraints for each report.
Dashboard reporting
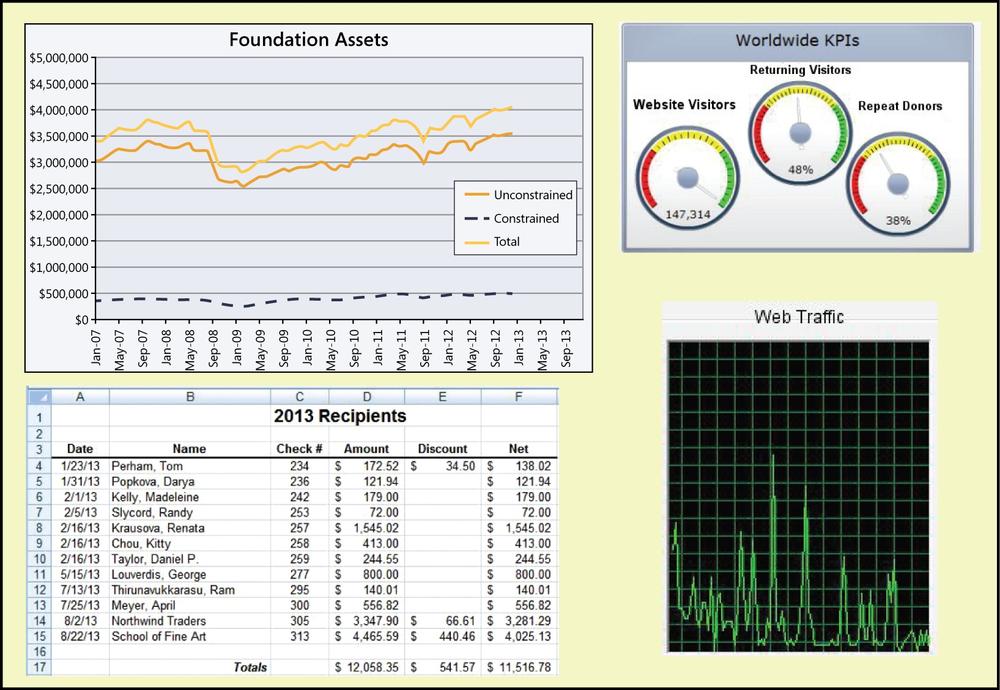
A dashboard is a screen display or printed report that uses multiple textual and/or graphical representations of data to provide a consolidated, multidimensional view of what is going on in an organization or a process. Companies often use dashboards to pull together information about sales, expenses, key performance indicators (KPIs), and the like. Stock trading applications display a bewildering (to the novice) array of charts and data that the skilled eye can scan and process at a glance. Certain displays in a dashboard might be dynamically updated in real time as input data changes. Figure 13-7 shows a hypothetical reporting dashboard for a charitable foundation.
Specifying the requirements for a dashboard involves the following sequence of elicitation and analysis activities. Many of these steps are also useful when specifying individual reports, as described earlier in the chapter.
Determine what information the dashboard users need for making specific decisions or choices. Understanding how the presented data will be used helps you choose the most appropriate display techniques.
Identify the sources of all the data to be presented so you can ensure that the application has access to those feeds and you know whether they are static or dynamic.
Choose the most appropriate type of display for each set of related data. Should it appear as a simple table of data, a modifiable spreadsheet containing formulas, blocks of text, bar chart, pie chart, line chart, video display, or one of many other ways to present information?
Determine the optimal layout and relative sizing of the various displays in the dashboard, based on how the user will absorb and apply the information.
Specify the details of each display in the dashboard. That is, treat each of them as a separate mini-report. The questions listed in the Eliciting reporting requirements section earlier in this chapter and the template in Figure 13-6 will be helpful for this discussion. Following are some additional topics you might want to explore:
If the displayed data is dynamic, how frequently must the data be refreshed or augmented, and in what way? For instance, does the current data scroll to the left as new information is added to the right end of a fixed-width window?
What parameters should the user be able to change to customize a display, such as a date range?
Does the user want any conditional formatting to have sections of a display change based upon the data? This is helpful when you are creating progress or status reports: use green if the data meets the criteria for “good,” yellow to indicate “caution,” and red for “Whoa, this is messed up!” Remember, when using colors in a display, also use patterns to accommodate viewers who have difficulty distinguishing colors and those who print and distribute the display in monochrome.
Which displays will need horizontal or vertical scrollbars?
Should the user be able to enlarge any display in the dashboard to see more detail? Should she be able to minimize or close displays to free up screen space? In what ways do the user’s customizations need to persist across usage sessions?
Will the user want to alter the form of any of the displays, perhaps to toggle between a tabular view and a graphical view?
Will the user want to drill down in any of the displays to see a more detailed report or the underlying data?
Prototyping a dashboard is an excellent way to work with stakeholders to ensure that the layout and presentation styles used will meet their needs. You can sketch out possible display components on sticky notes and have the stakeholders move them around until they find a layout they like. Iteration is a key both to refining the requirements and to exploring design alternatives.
As usual with requirements specification, the amount of detail to provide when specifying reports or dashboards depends on who makes decisions about their appearance and when those decisions are made. The more of these details you’re willing to delegate to the designer, the less information you need to supply in requirements. And, as always, close collaboration among the BA, user representatives, and developers will help ensure that everyone is happy with the outcome.