
Chapter 25. Business analytics projects
Most normal people don’t look at data sets just for fun. They study views of the data to make decisions about what to do, be it a decision to take some specific action or a decision to do nothing at all. In some cases, software systems automate the decision-making processes by interpreting data and taking actions based on predefined algorithms and rules. The main purpose of business analytics (also called business intelligence or reporting) projects is to develop systems that turn large and often highly complex data sets into meaningful information from which decisions can be made. Many other classes of projects might have business analytics components; the concepts presented in this chapter apply to those projects as well.
The decisions that people make using business analytics systems can be strategic, operational, or tactical. An executive might look at his sales team’s global performance dashboard to decide who to promote (tactical), which products need different marketing strategies (operational), or which products to target by markets (strategic). Generally speaking, all software systems that include an analytics component should enable users to make decisions that improve organizational performance in some dimension.
There are many software applications commercially available to implement business analytics solutions. The business analyst who wants to use one of those applications might need to perform requirements activities for tool selection and implementation, using the process described in Chapter 22.
This chapter is meant only as an introduction to issues to consider when developing software requirements for business analytics projects. [ref029] authored an extensive resource for performing business analysis on these types of projects. He provides many definitions of the core concepts, specific domain examples, questions to ask, and issues you might encounter.
Overview of business analytics projects
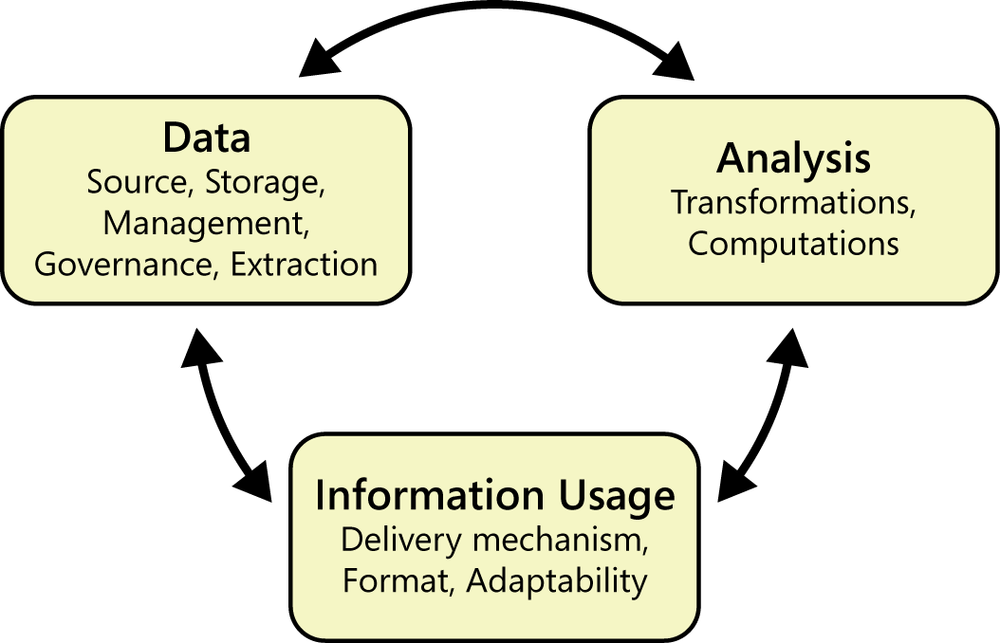
For most information systems, reports represent a small portion of the functionality implemented. However, on business analytics projects, complex reports and the ability to manipulate their contents constitute the core functionality. Often, the output of analysis is embedded in applications that automate decision making. Business analytics projects have multiple layers, all of which might need to have software requirements defined for them. These projects must deal with understanding what data is required, the operations performed on the data, and the formatting and distribution of the data for use (Figure 25-1). There is no rigid sequence to these activities. A user might work with the data, then realize she needs different analysis performed on the data, and perhaps even different data sources.
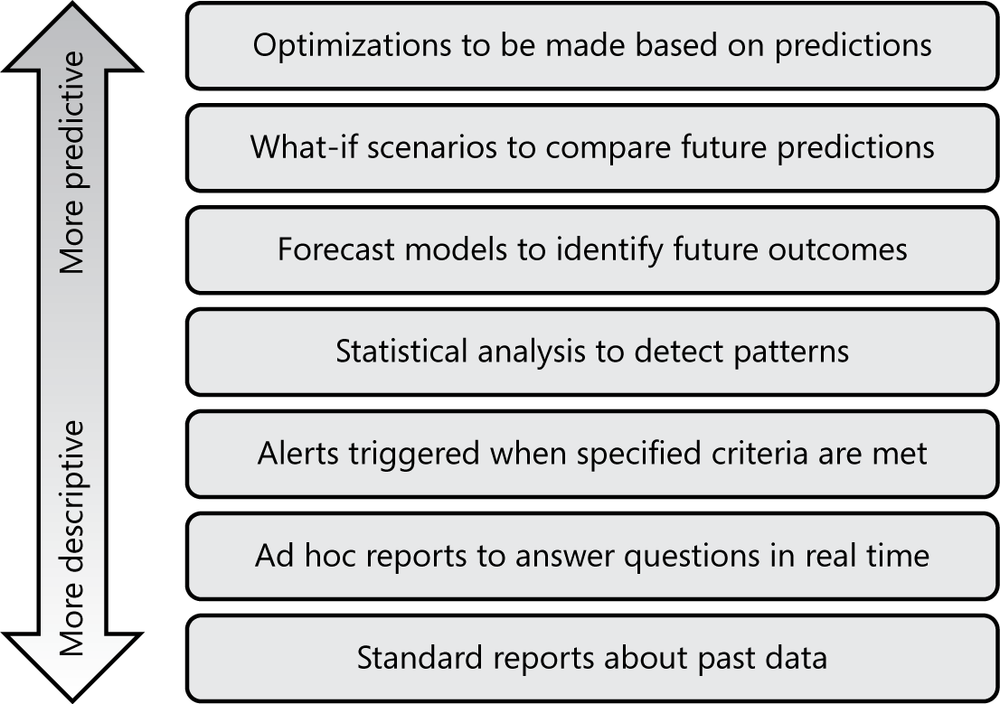
In the past, organizations that deployed analytics projects primarily focused on what the [ref121] calls “descriptive analytics.” This includes looking at reports that tell stakeholders what is happening—or has happened—in their organization. Recent trends indicate a shift toward more organizations using “predictive analytics.” Users organize, manipulate, and analyze information to predict what might happen in the future, as opposed to interpreting the past. Figure 25-2 shows where various applications of analytics fit on a spectrum ranging from more descriptive to more predictive.
As organizations embark on analytics projects, business analysts will find themselves tasked with eliciting and specifying requirements for these projects, but perhaps not knowing where to start. The strategic possibilities, the new analytics technologies, and the rapidly growing quantity of collected data can be intimidating. The end products of requirements development for a business analytics project will be similar to those for any other project: a set of business, user, functional, and nonfunctional requirements. However, many of the requirements practices described in this book are not sufficient to elicit and specify requirements for these types of projects. Process flows, use cases, and user stories can reveal that someone needs to generate analytics results, and performance requirements describe how quickly they need results, but none of these uncovers the complex knowledge required to implement the system.
If an organization is new to analytics, it should pilot a few small projects to demonstrate the value of analytics and to learn from the experience ([ref099]). Analytics projects are good candidates for incremental development if the team can identify the most important or most time-critical decisions that can be implemented in the next development iteration.
Another reason to consider incremental development is that business stakeholders sometimes have a hard time articulating and prioritizing the business problems they want to solve with an analytics project, particularly if it’s their first. Some stakeholders might have had little practice thinking strategically. Others might find it hard to envision the possibilities that analytics technologies offer beyond their familiar spreadsheets. Users might get so excited about new analytics capabilities that they overwhelm the development team with features that sound potentially valuable. Elicitation might need to begin with some education about what new capabilities a business analytics solution can provide over traditional data reporting tools ([ref119]). Developing the analytics solution in small chunks will give the users an opportunity to explore the initial capabilities and clarify their ideas of what they really need.
Requirements development for business analytics projects
As with other software projects, business analytics projects first need to have business objectives defined to establish and prioritize the scope of work. If stakeholders request an analytics project, they’ve already decided on that as a solution and might not have thought through their objectives carefully. Exploring the underlying business objectives might reveal that business analytics are not the right solution at all. To help stakeholders state their actual business objectives, you might ask the following questions:
Why do you think an analytics solution will help you achieve the desired business outcomes?
What do you want to accomplish by implementing analytics reporting?
How do you expect to use analytics to improve your business outcomes?
How are you hoping to use improved reporting capabilities or prediction results?
An effective subsequent elicitation strategy is to drive requirements specification based on the decisions that stakeholders need to make to achieve their business objectives. Try the following thought process ([ref228]):
Describe the business decisions that will be made using outputs of the system.
Link those decisions to the project’s business objectives.
Decompose the decisions to discover the questions that need to be answered, the hierarchy of precursor questions that need to be answered to feed the main questions, and what role the analytics information plays in producing the answers to those questions.
Determine how analytics could be applied to assist in making these decisions.
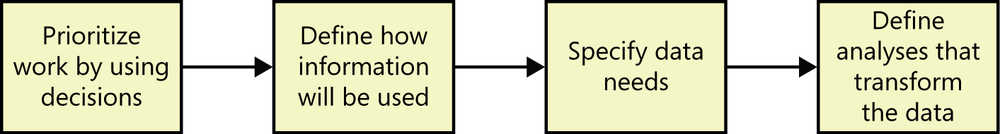
Figure 25-3 outlines an approach to elicit and specify requirements for analytics projects. User requirements should be defined to describe how the analytics information will be used and what decisions will be made from it. Understanding the expected usage modes allows you to specify how the generated information should be distributed to end users and what information they need to see. This knowledge in turn allows you to define requirements for the data itself and for the analyses to be performed. The rest of the chapter describes each of these steps in more detail.
Prioritizing work by using decisions
On most types of projects, features can be prioritized by considering how they contribute to satisfying the business objectives. The same consideration is valid on analytics projects, except that there aren’t discrete “features” to prioritize. Instead, you use the business objectives to prioritize the business decisions that the solution will enable, based on how much they contribute to achieving the objectives. For example, deciding which products to sell will have a greater impact on increasing revenue than making decisions about a sales team’s vacation time. Therefore, you would likely implement the analytics and reports to determine which products to sell first.
Decisions should be stated as unambiguously as requirements. An example of a good decision statement is, “The vice president of marketing needs to decide each quarter how much marketing budget to allocate to each region based on current and targeted sales by region.” As with requirements elicitation on other software projects, it’s important to understand the underlying stakeholder need instead of just focusing on a presented solution. If stakeholders request certain data or reports, ask questions such as “Why do you need that information?” and “How will the recipient use that report?” Then work backward to identify their decisions and objectives.
Decision management techniques are available to help stakeholders identify the decisions they could or should make ([ref227]). A decision model that maps information (data) and knowledge (policies or regulations that constrain decisions) to related decisions can help organize the decisions to permit prioritization ([ref228]).
Defining how information will be used
The results of complex analytics must be delivered in a usable form to the stakeholders or systems that need to act on the information. The BA must also determine how smart the system is—that is, how much of the decision making is done by a human user and how much is automated in the system. This distinction will drive the type of elicitation questions the business analyst will ask.
In one organization, the executive sales team wanted to see a dashboard report every morning showing multiple views of the data. This report had to include the previous day’s sales by product line, quarterly sales by product line, total sales compared to competitors’ sales, and sales volume by price band. They wanted 10 different filters (such as timeframe, increment, and region) that they could modify to see immediate changes in the reports. For example, if a user noticed a sales issue within a specific price band, she could change the filter to see a more precise view of the price band data by region. She could further drill down to look at another layer of detail that shows price band by region and by product line. This sort of flexibility is a common capability needed by business analytics systems.
Information usage by people
After you understand the decisions that users will need to make with the outputs of the analytics system, you can determine the best ways to deliver the information to them. The business analyst will need to consider the following three aspects of information delivery:
Delivery mechanism. How is information physically made available to the end user? What tools can the user employ to view it: email applications, portals, mobile devices, others?
Format. In what format is the information delivered: reports, dashboards, raw data, other?
Flexibility. To what extent must the user be able to manipulate the information following delivery?
The spectrum of information delivery ranges from having each user create his personal view of the data (a local copy of a spreadsheet), to distributing a central aggregation of the data to users (emailed spreadsheets with standard dashboard views), to exposing data for users to manipulate on their own (a portal that permits ad hoc querying of a set of data).
As with requirements for other types of software systems, information usage on an analytics project is most commonly captured in the form of user requirements and report specifications. Techniques described elsewhere in the book—such as process flows, use cases, and user stories—apply for identifying how users plan to use the information in their daily tasks. Rather than focusing on specifying the data fields in the reports, though, use the decisions to be made to determine how users should receive the analytics output, how it should look, and how they need to be able to manipulate it.
Report tables, as described in Chapter 13 are useful on most analytics projects. You might have to extend these models for more complex options by using layers in the report specifications ([ref013]). Users of analytics data often like to see information presented in a dashboard view, with multiple charts and reports laid out in a single display. The Dashboard reporting section in Chapter 13 will help you specify such dashboard requirements. Some reports give the user the ability to manipulate views of the reports in predefined ways, such as with filters ([ref077]). The display-action-response model described in Chapter 19 is valuable for specifying more comprehensive requirements for manipulating data in reports, when a simple report table structure won’t suffice. These models capture complex interactive user interface elements on reports, such as filters or changes in display from drill-downs.
Beyond user requirements and reporting requirements, understanding information usage might also reveal new processes and security requirements that need to be defined. For example, the president of a small company might receive a weekly profit-and-loss report. If it looks correct, he will share it with his executive team—but only with his executive team, which implies the need for access controls. Security requirements, as described in Chapter 14 might also be needed for data attributes, report views, or portal access. Perhaps regional sales vice presidents can see sales data for their region only, but a global vice president can view it for the entire organization. These sorts of quality attribute requirements apply to business analytics projects just as they do to any other software project.
Information usage in systems
It’s important to note that the information from analytics projects might be used directly within software systems instead of being delivered to human users. The analytics might be embedded in the application as part of its daily operations. For example, some retail organizations use a customer’s purchasing history to determine what products to apply personalized discounts to, in hopes of getting that customer to buy more from them. One retail chain determined that I was pregnant within a month of my knowing it, and they started sending email advertisements to me for baby products (this is obviously Joy’s story!). Other examples include a system that prints coupons for a grocery shopper based on his current or prior purchases, customized ads displayed to website visitors, and call center applications that determine what offers to make to a particular customer who just called.
In these situations, the information delivery mechanism and format might be specified through external interface requirements. However, it is still important to understand how the information will be used so that the correct data is transformed as needed and delivered to the interfacing system in a usable form.
Specifying data needs
Data forms the core of all business analytics solutions. Many organizations employ data experts to develop and maintain their data solutions for these projects. BAs can define requirements for data sources, storage, management, and extraction mechanisms, although they might engage data specialists early in the requirements efforts to help. BAs can help explore what types of data need to be collected and analyzed, the total quantity of data the organization will be dealing with, and how much data they will accumulate over time. However, the data experts will be more familiar with what data is available, where it’s located, what challenges it might present, and how it can best be exploited.
Because analytics projects often aim to discover new strategies for companies, these projects might involve identifying new data sources to analyze. It’s important to fully understand the data requirements so technical teams can design the often complex infrastructures needed to support analytics. For example, architects might have to completely redesign an existing data storage solution to meet your project’s needs.
Big data
The term big data typically describes a collection of data that is characterized as large volume (much data exists), high velocity (data flows rapidly into an organization), and/or highly complex (the data is diverse) ([ref077]). Managing big data entails discovering, collecting, storing, and processing large quantities of data quickly and effectively. [ref065] provides a summary of what big data entails from the perspective of management and governance.
To really conceptualize big data, think about your personal data-based interactions from a single day: social media, email messages, videos, digital images, and electronic transactions. Consider that a commercial aircraft generates 10 terabytes of data during a 30-minute flight ([ref210]). The nature of businesses today is that the data available to them is undergoing explosive growth. Applications that help users glean valuable knowledge from the mountains of data are therefore increasingly important.
The data models described in Chapter 13 are best suited to representing relational data stores. If the data objects relate to one another in some logical way, the BA can model those objects by using entity-relationship diagrams (ERDs). If the data attributes are known and consistent, data dictionaries also can be useful. Unfortunately, big data is often only semi-structured or even unstructured.
Unstructured data, exemplified by voice mails and text messages, doesn’t lend itself to representation in traditional rows and columns. The challenge with unstructured data is that you have no idea where or how to begin looking for the information you seek ([ref053]). For instance, software operated by a security-related government agency might scan Internet traffic for instances of a word such as “bomb,” but they need to see it in context to know the meaning of the word of interest. “Bomb” could indicate a terrorist threat, refer to an article on aerial combat in World War II, or describe a bad play’s opening night.
The good news is that most data does possess some structure in the form of accompanying metadata, or data about the data ([ref077]). Semi-structured data sources include email messages, image files, and video files. Because semi-structured data has associated metadata that provides some information about the data’s structure and contents, you might be able to create entity-relationship diagrams and data dictionaries to represent what you do know about the data.
Data-based (not “database”) requirements
Many of the data requirements that need to be specified for analytics projects are similar to those for other information systems projects. Although the nature of those requirements might not be the same, the questions you ask to elicit them are often similar. Keep in mind that most big data is generated by automated systems and usually represents a new data source for an organization, which means that it will take more work to determine the data requirements ([ref077]). You can derive many data requirements from the decision-management criteria that you elicit from appropriate stakeholders. For example, decisions that need to be made hourly will likely have different underlying data needs from those that are made just once per calendar quarter. They might differ in terms of how frequently the source data is refreshed, when the data is extracted from the source, and how long the data must be retained.
[ref029] provides a checklist of common expectations that stakeholders might have about business analytics and types of questions that can elicit those expectations. Following are some examples of questions a BA can ask to elicit data-related requirements:
Data sources
What data objects and/or attributes do you need? From what sources will you get that data?
Do you already have each of those data sources available? If not, where is the data? Do you need to develop requirements to populate those sources with the necessary data?
What external or internal systems are providing data?
How likely are these sources to change over time?
Is there a need for an initial migration of historical data from an old to a new repository?
Data storage
How much data is there today?
How much is the data volume expected to grow and over what period of time?
What types of data do you need to store?
How long do you need to store the data? How securely must it be stored?
Data management and governance
What are the structural characteristics of the data?
How do you expect the data structure or values to change over time?
What data transformations need to occur before the raw data is stored or analyzed?
What transformations are needed to standardize the data from disparate systems?
Under what conditions can old data be deleted? Does old data need to be archived? Destroyed?
What integrity requirements apply to protecting the data from unauthorized access, loss, or corruption?
Data extraction
How fast do users expect queries to return results?
Do you need real-time or batched data? If not real-time, then at what frequency do you need it to be batched?
As with all requirements, ensure that the data-related requirements do not constrain developers with unnecessary design.
Defining analyses that transform the data
Analysis is the computational engine of the projects described in this chapter; it transforms the data and leads to answers to the questions posed ([ref077]). A user defines a problem, receives data that he hopes will contain an answer, analyzes the data to find the answer, and decides on a solution to the problem. Or maybe the system analyzes the data to find the answer and then takes an action accordingly.
All of this is great, if you know what you are looking for. However, one challenging aspect of many business analytics projects is that the decision maker might not know just what he’s looking for in the data. He might want to have certain data objects and attributes exposed in tools that allow him to explore, running different queries to ask what-if questions about the data. He literally doesn’t know what he doesn’t know, but he’s hoping that by studying the data he’ll glean something useful to act on. This is why it’s important to start by understanding what decisions the stakeholders are trying to make. Even if he doesn’t know exactly what he’s looking for yet, a stakeholder should be able to define the type of problem he’s trying to solve. Defining the necessary data analysis involves big-picture thinking ([ref053]). A BA with good creative-thinking skills can work with stakeholders to determine what new ideas might be explored with the analysis results.
As Figure 25-2 showed, analytics results lead to decision-making capabilities ranging from descriptive to predictive. To elicit the data analysis requirements, you might ask questions such as the following ([ref053]):
What time frame are you trying to analyze: past, present, or future?
If past, what kinds of insights about the past are you looking for?
If present, what do you need to understand about the current situation so that you can take immediate actions?
If future, what kinds of predictions or decisions do you want to make?
These questions will help you define functional requirements that specify the analyses the system must perform. Because analytics is a completely new capability for many organizations, you might do some research to discover how other organizations are using similar data to improve decision making. A business analyst has the opportunity—perhaps even the responsibility—to help the stakeholders learn how analytics could be used in ways they hadn’t previously envisioned.
Some analysis requires sophisticated algorithms to process, filter, and organize the data ([ref182]). Suppose a retail store wants to play targeted video ads when a customer walks in the store. A camera might scan her, perhaps by using facial recognition software, and the system will combine what it can learn about the customer (gender, age, attire, where she is looking) with logic built into the system to decide which ad to play. This type of decision logic can often be represented by using decision tables or decision trees, as described in Chapter 12.
It is important to understand the implications of automated decision making and be explicitly clear when defining the desired decision-logic system behaviors. A cautionary example is provided by systems that can scan social media and make stock trade movements accordingly. In 2013, a false piece of social media news reported that the president of the United States was injured in an explosion. The algorithms built into certain automated systems triggered them to start selling stocks, which led other systems to also sell stocks when they detected the market’s decline, all within moments of the news release. Fortunately, the hoax was discovered quickly, and human decisions reversed the sudden sharp stock market drop caused by the automated trading systems. Perhaps the systems behaved exactly as intended, but maybe there was decision logic missing that could have limited the impact.
One of the most valuable aspects of business analytics systems is that they can enable future-state strategic analysis, such as exploring what-if scenarios. Consider questions such as, “If we offered our product on a new platform, what would we expect our future sales numbers to be?” or “If we offered our customers products targeted to their gender, how much more would they buy?” The system can run models and algorithms to enable these types of data extrapolations or predictions. Those models and algorithms need to be specified in the software requirements. If they are highly complex, a BA might enlist the help of data experts, statisticians, and mathematical modelers to help define them.
The analyses might require statistical or other computations to transform the data prior to it being presented to the user or delivered to a system for action. Either business rules in the organization or other industry standards could define these calculations. For instance, if analysis includes reporting gross profit margins by region, you need to specify exactly how that margin is calculated in your organization. The calculation formula requirement pattern described by [ref253] can be used to specify literally any calculation that is needed to transform the data. A specified formula should include a description of the value to be calculated, the formula itself, the variables used, and where their values come from. Also, specify any response time requirements for those calculations.
The evolutionary nature of analytics
Figure 25-1 illustrated the back-and-forth interactions between data, its analysis, and its usage ([ref077]). Occasionally, the user receives a report and makes a decision, and then she’s done. More commonly with business analytics applications, the user starts with a question and requests a report containing information relevant to the decision she must make. Someone extracts the requested data from available repositories, applies the relevant analytics processing, and delivers the report to the user. But after she sees the information, the user will think of new questions that require further analysis, which leads to requests for new reports and yet more analyses.
The key to defining requirements for analytics projects, therefore, is to start somewhere. Because the requirements might change over time, begin with what the stakeholders already know they want to learn from the available information, and plan for their questions to evolve. Also, understand how much the users expect their needs to evolve. For example, if they believe their needs from the business analytics solution will change significantly over time, they might require a solution that is easily adaptable and requires minimal additional development work.
An analytics solution should take into consideration the forms and conditions the data is in at the times it is extracted from a source, analyzed, and viewed by a user. For example, do users want certain raw data to be delivered to them so they can generate reports manually to examine? Or do they want a software application to organize that data for them and deliver it in a predefined, structured format? Do the users have a set of questions to which they want the answers every week for the next year? Or do they want to be able to ask new questions every day, rapidly developing new forms of data analysis and presentation to keep pace with rapidly changing business needs? The answers to these types of questions will tell your development team whether to make sets of data available for users to manipulate themselves or whether an analytics team will have to generate and format new information for those users to view ([ref077]).
Your job as a BA on a business analytics project is to work with the project’s stakeholders to understand their decision processes. Use those decisions to elicit the requirements that will access the necessary data, specify the analyses to be performed, and define the data presentation. You should understand what results stakeholders expect from an analytics solution, the decisions they hope the data will help them make, and how they want to dynamically modify the analyses or their presentation. Look for opportunities to help users be more successful by envisioning solutions that they might not have imagined were even possible.