
Monitoring is crucial for a production environment. We want to be able to see all the needed metrics that can show us whether our Solr cluster is healthy. We want to be able to see the operating system and Java Virtual Machine metrics, such as network statistics, garbage collector work, and so on. By default, Solr comes with the administration panel that allows you to see the basic statistics regarding it and the JMX connectivity so that we can integrate it with monitoring systems such as Ganglia. This recipe will show you what information you can get by looking at the Solr administration panel.
- When opening the Solr administration panel in our browser (
http://localhost:8983/solr/#/), we will see a view similar to the following one: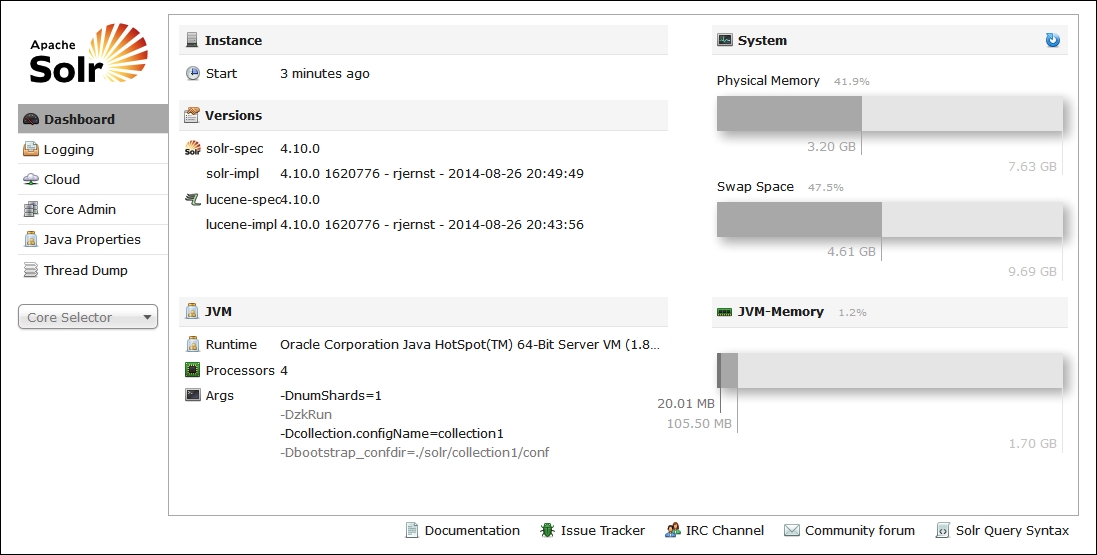
- Next, let's take a look at the cluster state view. We can do this by pointing our web browser to
http://localhost:8983/solr/#/~cloud. We will see a view similar to the following one: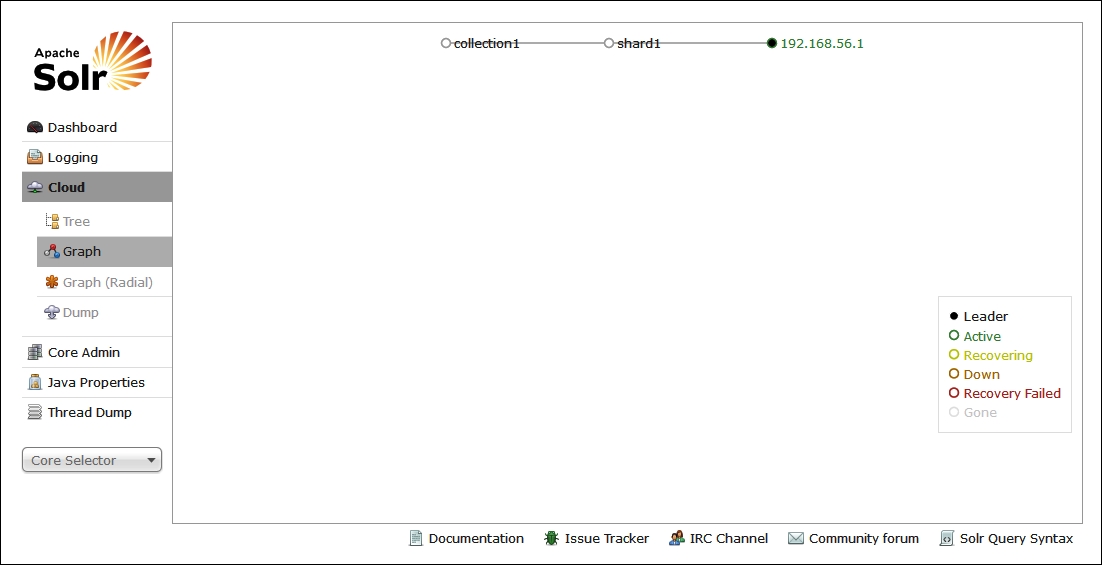
- Of course, the cloud view is not the only thing. When choosing our collection from the left-hand side of the administration panel or going to
http://localhost:8983/solr/#/collection1, we can see an overview of the collection as follows: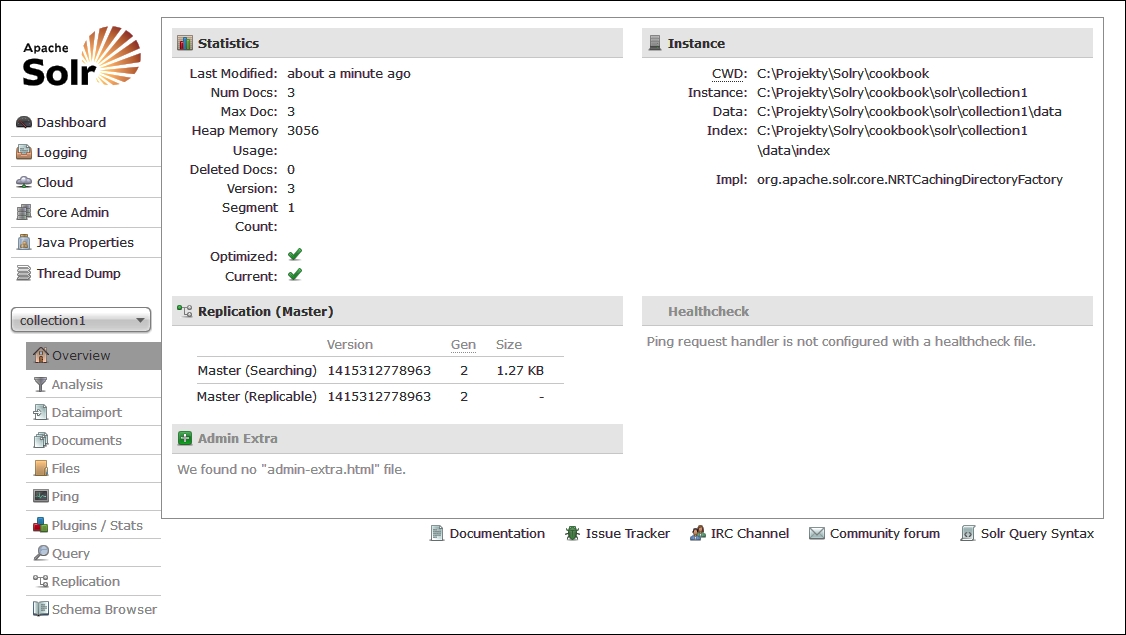
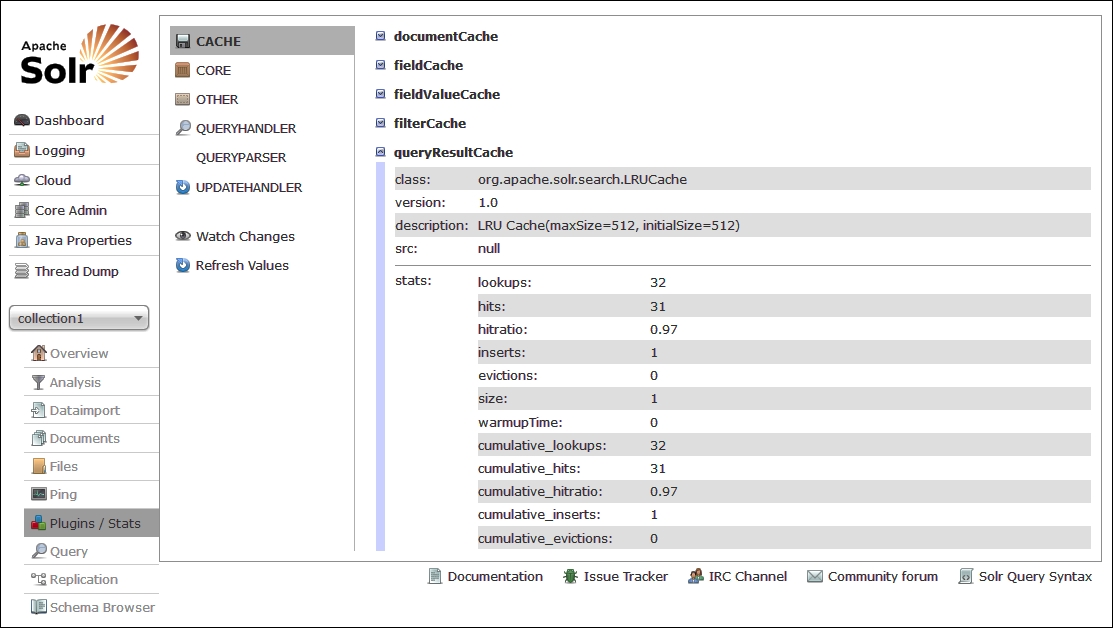
- We can go even further and look at the statistics provided by each of Solr components. For example, when we take a look at the query result cache statistics, we will see a view similar to the following one:
- We can also see extended statistics for each of the handlers and components, both when it comes to searching and indexing. For example, if we take a look at the
/selecthandler statistics after running a few queries, we will see the following: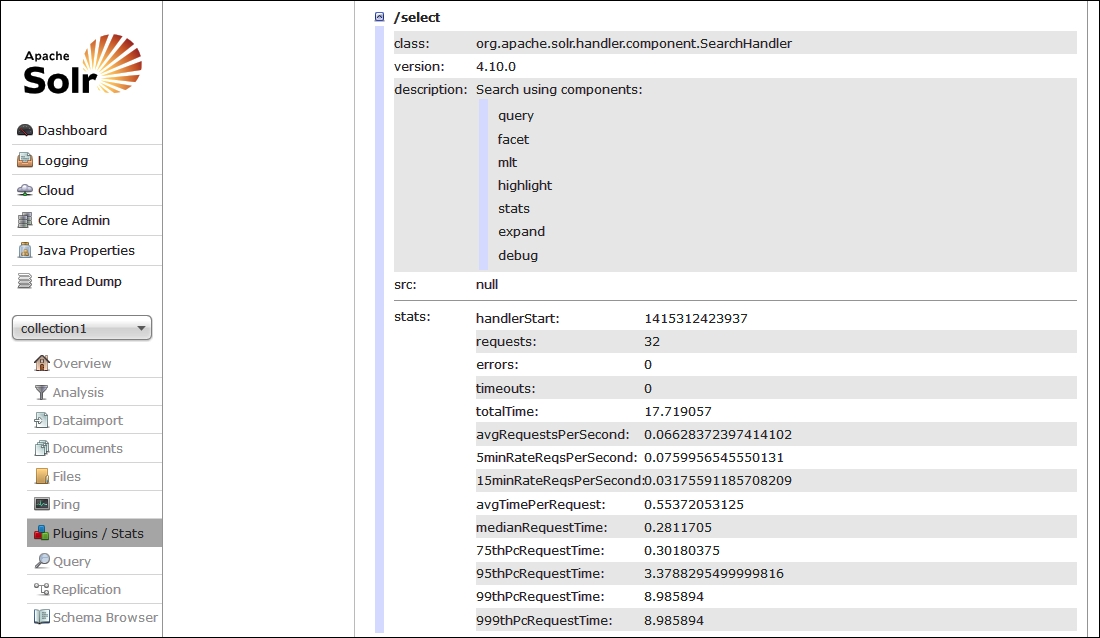
We can, of course, continue the discussion and show more screenshots from the Solr administration panel, but I would just advise you to run Solr and just click through the functionality. Let's now take a look at what all this functionality provides.
On the main page of the Solr administration panel (Dashboard), we can see various metrics related to Solr. We can see the version of Solr we are running, when the instance was started, what the configuration parameters were, which Java version was used, and so on. In addition to this, we can see the memory statistics. We can see the physical memory and how much of it is used, we can see the swap memory available, and finally, we can see the JVM memory—the one that Solr uses.
The next thing is the cluster state and layout. The cluster state view provides us with information about the topology of the cluster, what collections are deployed on our cluster, what are the shards of each collection, where they are deployed, and what their roles and statuses are. Remember that this view is only available when running Solr in SolrCloud view.
The Overview page for a collection gives you basic statistics about the core of the collection such as number of documents, heap memory usage, version of the index, number of segments, and so on. We can also see the directories and directory implementation used.
Finally, we looked at the statistics of different Solr components—the query result cache and the search handler registered under the /select name. As we can see, Solr provides different metrics depending on the component we are looking at. For example, the query result cache provides information on the size, number of hits, hit ratio, number of inserts and evictions, and so on. The search handler on the other hand provides information about a number of requests and errors, total time requests that were running, time-based statistics, and percentiles.
Of course, the Solr administration panel gives you a pretty good view on what is currently happening with Solr, but it doesn't allow you to compare metrics, see them graphed for ease of viewing, and so on. And the one main thing that really makes us look for a proper type of production monitoring software is that it doesn't store all the metrics. If something happens or is restarted, we lose the metrics.
There is one more thing when it comes to Solr monitoring that I want to mention.
Of course, working with the Solr administration panel or JMX is good, but when it comes to monitoring and performance analysis, you usually want to have a good view of what happened in the past, you want to be able to compare different periods, and have alerting functionality so that you are on top of things when something goes wrong. Such functionalities are not a part of Solr, but there are solutions out there that provide all the required pieces of a good monitoring platform. One of these solutions is SPM Performance Monitoring & Alerting (http://sematext.com/spm/index.html) provided as SaaS and on premises software by Sematext Group (http://sematext.com). There are also open source tools, such as Ganglia (http://ganglia.sourceforge.net/) with jmxtrans (http://www.jmxtrans.org/). For example, this is how the default SPM dashboard looks like, showing you the most interesting information related to Solr on one page:
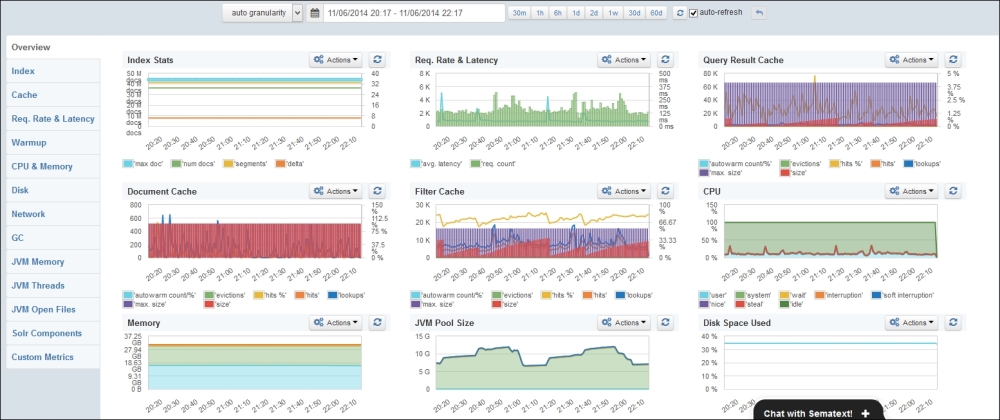
The default SPM dashboard
In addition to providing all the relevant and needed Solr metrics, SPM gives you an insight on JVM and operating system related metrics. Apart from this, it provides you with alerting capabilities and algorithmic anomaly detection that can help you foresee problems that are not yet present. Even though SPM is a commercial product, it has a free version that allows you to keep the last 30 minutes of your metrics for free and doesn't care about the maintenance of additional software inside your organization.