Merchandising, Video Games, Hotels, Pay-Per-View and Transactional VOD Roots, Airlines, and Other Markets
 |
More content from this chapter is available at www.focalpress.com/9780240824239 |
This chapter combines a bit of a hodgepodge of revenue streams, but that is because an intellectual property asset, by its divisible and malleable nature, lends itself to being exploited via endless permutations, associated with a dizzying array of physical products, and distributed by any platform capable of attracting eyeballs. Given this open-ended sandbox to bring in additional dollars, in exceptional cases revenues from “ancillaries” can become the proverbial tail wagging the dog, generating more money than the property in its original incarnation. Merchandising, a category that could mean a thousand different products (ranging from toys, to games, to apparel), is what one tends to associate with ancillary revenue. I will accordingly devote the bulk of this chapter to merchandising (in the broad sense), and while it is beyond the scope of this book to delve too deeply into the games business, I will both touch on games as they relate to film/TV ancillaries and also discuss elements of social gaming. The evolution of data analytics, which is ever being fine-tuned by the gaming world, will inevitably influence all media consumption metrics and related advertising tracking and pricing.
Notwithstanding the importance of merchandising in the film and television world, in the context of distribution, a series of ancillary streams have carved out additional niche windows for exploiting content. The most prominent of these include:
■ hotel/motel
■ pay-per-view
■ video-on-demand (VOD) (here focused on its roots, briefly touching on Internet VOD, as OTT services are generally discussed in Chapter 7)
■ airlines
■ non-theatrical.
I will only cover these markets in broad concept, in part to illustrate their relative relationship to the more important revenue drivers. What is interesting is how the landscape has changed: in my first edition, I included transactional video-on-demand within this section, but have now moved the discussion of transactional VOD to the video chapter (as VOD has, as predicted, become the new face of rental video), a discussion of SVOD to Chapter 6 (as subscription VOD has become akin to pay TV), and Internet VOD to Chapter 7 (as part of the description of streaming OTT services). In the new order, VOD is truly everywhere, and as discussed throughout the book the increasingly ubiquitous access to content in an on-demand manner is collapsing the value drivers in Ulin’s Rule and putting unrelenting stress on the historical window system.
Finally, a quick note about online revenues—it would be fair to add online generally into this mix of “ancillaries,” because many view online as just another additive revenue stream. However, I am treating online as a separate almost “super category,” focusing on how it is impacting mainstream and ancillary revenue windows alike. In summary, that is the challenge of convergence: Are revenues from downloading a TV show to an iPod or streaming content to a tablet ancillary revenues, or rather new kinds of digital exploitation changing the very character of traditional markets (electronic sell-through supplanting DVD retail, and streaming content challenging the nature of what is TV)?
Merchandising revenues can be so significant that this ancillary market actually becomes the primary revenue stream targeted. Many animated properties originate from toys or with the intent of generating toy sales, with the producer sometimes viewing the cartoon (and, in extreme cases, its telecast) as a marketing expense. The challenge is that mer chandising revenues can be even more fickle than the film business, with toy vendors wary of the high risks even when dealing with name properties.1 Basing toys on a movie runs a dual risk that the movie will work and then that the movie’s performance can be converted into retail success with products based on the movie and its characters.
And yet, when a merchandising program takes off, it can be extremely big—in select cases, even bigger than all other traditional media streams combined. I had the privilege of cross-promoting videos with Star Wars merchandise, the all-time leader in merchandising sales from a film property. Commenting on cumulative sales generated over 35 years since the debut of the original film, the Hollywood Reporter summarized: “Over the span of Star Wars’ lifetime, $20 billion and counting of licensed goods has been sold, this on top of the $4.4 billion in tickets and $3.8 billion in home entertainment products.”2
In the era of social networking and digital versions of content, transmedia has been ballyhooed as a new buzzword for extending stories into other media and platforms; in general, the term refers not to sequels and remakes, but rather the production of new stories and content via different platforms and media, which serve to expand the fabric and experience of the core content. Whether this is fundamentally different than the notion of migrating a property into a franchise that is larger than the sum of its parts is difficult to define. Those trying to frame transmedia exploitation may argue that the difference is in planning: independent tangents are enabled from the get-go in an effort to create a broad, immersive experience where storylines are not linked, yet all tie together because of common grounding (which, in legal terms, reflects all the related properties being derivative works). No doubt, digital media helps enable these different threads. I would argue, though, that big enough franchises spawn an end result akin to transmedia storytelling, whether the end result is designed or simply evolves from opportunities to monetize different elements.
Star Wars, again, provides a good example. The following are some of the key tentacles of brand extension:
■ Toys: Toys such as action figures and lightsabers have been a staple consumer retail product for decades, defining the franchise as an evergreen.
■ Books: Searching the Web, one can find more than 100 different books (excluding graphic novels and comics) expanding upon the Star Wars universe, ranging in age demographics (e.g., young adult) and segmented by timeline (before or after X period of “history” in the saga). Additionally, the books include longtime relationships with leading brands such as Random House and Scholastic, several New York Times bestsellers, and estimates of more than 160 million copies of books in print.3
■ Video games: LucasArts was among the top independent games publishers for almost 20 years, with Star Wars games both tying into and expanding the Star Wars universe. (Note: LucasArts was closed in 2013 post Disney’s acquisition of Lucasfilm.) Lego alone has sold more than 15 million units of the Lego Star Wars video game, and the MMO Star Wars: The Old Republic (developed in collaboration between LucasArts and Electronic Arts’ BioWare), launched during the 2011 holidays, sold more than 2 million copies in its first two months, and according to the Hollywood Reporter about 1.5 million people were paying an average subscription of $15 per month during Q1 2012.4
■ Theme park rides: Star Tours, a staple flight simulator ride at Disney theme parks globally, debuted in 1987, and was then revamped in 2011.
■ Education: There have been multiple Star Wars learning products over the span of the franchise, including in the last few years a range of interactive educational games from leading children’s educational software company LeapFrog.
■ Television: The franchise has led to a series of documentaries, ranging from behind-the-scenes productions to Discovery Channel’s The Science of Star Wars. Additionally, the hit animated series The Clone Wars was among Cartoon Network’s top shows since its debut in 2008, averaging 2.2 million daily viewers, and has ranked as the top show for the boys 2–14 demographic.5
Arguably, books, video games, and television series taking characters and themes in different and new directions, in different media, often set in different time periods, enabling different and often immersive experiences yet all grounded in common iconography, is a form of transmedia storytelling. What is new today, however, when people often refer to transmedia, is the launching of a “franchise” with different elements from conception, enabling viral growth, which helps define and build a franchise. The formal definition of transmedia, or whether the tail wags the dog (or vice versa), though, is less important than the ability of intellectual property to be molded into different forms, formats, product, and media, which all can be independently monetized.
As Risky and Lucrative as the Film Business
What Properties Can Spawn Successful Merchandising Programs?
Most successful film- or TV-based merchandising programs are built around either franchise properties or properties targeted at the kids/family demographic such as animated features. To the extent that a property crosses over to both categories, namely franchises and kids, then the potential is that much greater. This is why films based on comic books have become so hot, and why brands such as Marvel have seen a resurgence. Even with this type of triangulation, nothing is a sure thing. Batman has been a success story, and more recently Spider-Man has hit its stride, but product based on Superman has struggled by comparison.
Star Wars has been the industry’s leading and enduring success story, somehow managing to strike a continuing chord with multigenerational fans and collectors. It is a legendary industry story how Lucasfilm was caught by surprise by the product demand back in the 1970s following the launch of the original film. Demand was so high that toy company Kenner shipped empty boxes with vouchers for product that would be shipped later. This story is instructive to illustrate (again) the similarity of vicissitudes to the film business; namely, the market is hit-driven and no one can fully predict what will catch on and when. Accordingly, the business tends to segment into two major categories: established properties, where the merchandise becomes part of a larger franchise management program, and newly released properties that launch with the hype of presumed success (e.g., a new Pixar film).
It then becomes the challenge of major product providers, such as toy companies, to place large upfront bets. The two largest U.S. toy companies, Mattel and Hasbro, are heavily courted by every studio and network, because having a major toy program in place not only validates the expectations for an upcoming release, but also provides cross-promotion via the brand marketing of the toy company. It is like joining a craps table, but now there are more people betting on the roll, with the energy and expectations feeding on each other; moreover, the drama is heightened by the fact that everyone gets only one roll (the film’s opening box office, or a TV series initial airings).
The Difference with TV
In many ways, merchandising driven off of TV is a much better business. This is because, with a continuing story, it is possible to hold back and see how a property is performing before ramping up too far. It is not unusual to wait for the second season of a series before launching major product; the time delay allows programs to be built around what the merchandisers now know is a hit. Moreover, with TV there is the ability to keep the property in front of its consumers week after week. The combination of a more calculated risk and a longer tail should produce a healthier ROI, a fact further buttressed because TV production costs should be lower than film costs.
Among the great success stories in this space is Power Rangers, a series/franchise that became so strong that it (together with thousands of hours of other animated content controlled by Saban Entertainment) allowed producer Haim Saban to launch and co-own Fox Kids with NewsCorp; Saban then netted a huge personal payoff (in the billions) when he sold the kids cable network to Disney (which then rebranded the network ABC Family).6 (See Chapter 7 for a discussion of how these profits were leveraged to make billions more with the purchase and sale of one of Germany’s leading commercial TV networks.)
Another prime example over the last 10–20 years has been an explosion of anime-based properties, including Pokémon, Yu-Gi-Oh!, and Dragon Ball Z, hitting U.S. television (properties that are, in turn, often derivative of manga magazines and graphic novels). Nintendo’s Pokémon turned into a phenomenon, becoming such a figure of pop culture that it appeared on the cover of Time magazine and the New Yorker, and a gigantic Pikachu balloon floated through the Macy’s Thanksgiving Parade.7 As an aside, I remember meeting the woman in Tokyo who created the signature yellow pocket monster character Pikachu, and autographs were so in demand that she regularly kept stickers with her to sign. In terms of numbers, Pokémon sales figures were daunting: from over 1,000 licensed products, it is estimated that global Pokémon merchandise sales exceeded $5 billion. And these numbers are from legitimate licenses—in 1999, Nintendo of America, the licensing agent for Pokémon, asked a New York court to crack down on pirates, alleging they were losing $725 million per year from counterfeit goods.8
It is the hope of these types of returns that excites the executives at all channels focused on kids programming. At Nickelodeon, SpongeBob SquarePants sustained a successful merchandising program for years. Disney uses its Disney Channel airtime to keep key characters fresh, such as with a CG-animated Mickey Mouse; moreover, it is also able to cross-promote items through its theme parks, networks, videos, etc., thus creating purchasing demand among each new generation of toddlers. Disney has also been able to expand its success into the teen demographic, as evidenced by its Disney Channel special High School Musical. This TV musical and its sequels (e.g., High School Musical 2), per Variety, “have sold nearly 15 million CDs, 50 million books, 4.8 million video games, and spawned stage shows, concerts, and an ice tour.” In terms of financial return, at the height of the High School Musical frenzy (2009), Disney targeted $2.7 billion from High School Musical and Hannah Montana products.9
In contrast, name a successful TV or film merchandising program not aimed at kids. There are a few, such as around The Simpsons and South Park, but outside of these edgy shows where the merchandising leverages the cult appeal of the show, there are hardly any examples. Dramas, police shows, action movies, romantic comedies, sitcoms, and even niche genres such as horror do not lend themselves to converting property interest to product purchases. Why? Arguably, it is all about time, focus, and independence. As people grow older and are more independent with their choices, with more influences competing for their attention, marketing messages are diluted, and the desire to affiliate with a character or item becomes less compelling. Simply, think of a graph, where the Y axis is range of choice and influences, and the X axis is age. The older you get, the more choices and the more exposure. In contrast, children watch hours of certain TV shows each week (if not each day), and a particular property is more integral to their lives.
Chicken and Egg: When Merchandise Drives TV
As outlined in Chapter 6, on occasion producers will pay for airspace and take on the risk of selling the commercial inventory to guarantee a broadcast slot. This risk tends to be limited to instances where there are strong ancillary revenues, such as built-in merchandising from an established brand, where the P&L is not simply based on advertising sales. A prime example several years ago was 4Kids Entertainment’s deal with Fox (4Kids holding TV merchandising and broadcast rights to Pokémon and other hit anime titles).
According to 4Kids Entertainment’s annual report, “The Company, through a multi-year agreement with Fox, leases Fox’s four hour Saturday morning children’s programming block. The agreement, which commenced in September 2002, requires the Company to pay annual fees of $25,312 through 2006.”10 The annual report continued:
The Company, through a multi-year agreement with Fox, leases Fox’s Saturday morning programming block from 8 a.m. to 12 p.m. eastern/pacific time (7 a.m. to 11 a.m. central time). In January 2005, the Company changed the name of the Saturday morning programming block from Fox Box to 4Kids TV. The Company provides substantially all programming content to be broadcast on 4Kids TV. 4Kids Ad Sales, Inc., a wholly-owned subsidiary of the Company, retains all of the revenue from its sale of network advertising time for the four-hour time period.11
Fox secured over $100 million over four years without any risk, presumably on the assessment that it could not sell $25 million of advertising per year in this space or otherwise net better than this amount after programming costs. The network’s bet seemed to pay off based on the 4Kids report, which lists advertising media and broadcast revenues for 2002, 2003, and 2005, respectively, as $11.2 million, $22.54 million, and $24.1 million. In addition to running a deficit on the airtime, 4Kids had programming costs to amortize. And yet, as the report further noted, the company’s belief that TV exposure would drive other revenues tied to the already established franchise justified the risk: “The ability of the Company to further develop its merchandising, home video, and music publishing revenue streams were significant components of its evaluation process which resulted in the decision to lease the 4Kids TV Saturday morning programming block.”12
In the context of leveraging well-known brands with strong merchandising lines, the 4Kids Entertainment strategy of broadcasting new (and inexpensive-to-produce) series on network to drive awareness for ancillary revenue streams was a bold play. However, absent this context the notion of paying for production, receiving no license fee (and, in fact, having a negative license fee given the lower ad revenues versus the cost of the airtime), and betting the entire economics on ancillary revenues may carry worse odds than gambling.
Most Extreme Example: Toys Programming a Whole Network
The natural extension of the 4Kids experiment with Fox and programming a block of TV content is to take over and program an entire channel. With exposure difficult and a few key players controlling the network flow, both independents and toy companies recently changed strategy and have opted to become both the programmer and owner.
In 2009, Hasbro bought 50 percent of Discovery Kids to launch The Hub, a new children’s network with a reach of approximately 60 million subscribers. While Discovery continues to manage advertising sales, programming is the responsibility of Hasbro—meaning that a toy company is leveraging a major cable network to promote its brands (e.g. Transformers), with animated series such as Transformers Rescue Bots and Transformers Prime.
Another example of a children’s production company launching a network is PBS Kids Sprout. The channel originally launched in 2005 as a partnership among Comcast, HIT Entertainment, PBS, and Sesame Workshop. HIT Entertainment, launched originally as the overseas television arm of the Jim Henson Company (Henson International Television), had gone public and bought the iconic U.K. brand Thomas the Tank Engine. The new network enabled HIT to have a direct television outlet via which to air series and cross-promote its brands. (Note: In 2011, Mattel bought HIT Entertainment, bringing not only Thomas the Tank Engine, but global brands Barney and Bob the Builder under its umbrulla; however, HIT’s ownership interest in Sprout was not part of the transaction. This makes sense given the educational focus and mission of PBS and Sesame Workshop, which would arguably have been in direct conflict with having one of the two largest toy companies (Mattel) as a major owner.)
In A World of Apps, Do Toy Company–Network Partnerships Make Sense?
Given the growth of the app space, and the rise of brands such as Angry Birds into global franchises, it will be interesting to watch whether the appetite for toy companies to invest in linear television programming continues. Rovio, the Finnish developer of Angry Birds, riding the crest of over 500 million downloads (mobile and online) reportedly turned down a $2.5 billion bid from social games pioneer Zynga at the end of 2011.13 This phenomenal growth in under two years is an example of digital power—the downloads combine use across cell phones, tablets, Web browsers, and computers, and according to Rovio users engagement was a staggering combined playtime of 200,000 years and 400 billion in-game bird launches.14 Because apps and TV measure metrics so differently, it is difficult, if not impossible, to compare like-for-like value; nevertheless, if one were to harmonize a metric of user engagement, no doubt Angry Birds would come out near the top, if not a clear leader.
The number of toys and other merchandise that Angry Birds spawned would be the envy of any toy company. Rovio targeted sales of 20 million Angry Birds toys at Christmas 2011, and in an interview with Forbes, GM North America Andrew Stalbow noted the following statistics in highlighting the company’s efforts on bridging the digital and physical world in 2012: “We’re selling over 1 million plush toys every month. We have apparel in stores like Walmart and JC Penney. We have three new books in stores now—the cookbook and two dootle books. We had the number one ‘most searched for’ Halloween costume.”15
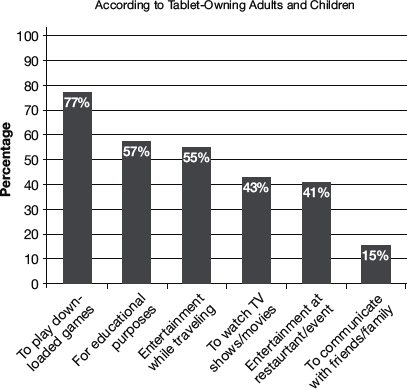
Figure 8.1 How do Children Use Tablets? Reproduced by permission of Nielsen
Reproduced by permission of Nielsen
With the power of the app-driving-merchandise model proven by Rovio, a toy company looking to market its brands would then need to ask whether this is a fluke, or whether there is a broader phenomenon building in terms of digital devices grabbing the attention of its core consumers (i.e., kids). A study by Nielsen in Q4 2011 implies yes: of households with tablets, 77 percent of children under 12 used the tablets to download games, compared to 43 percent that used them to watch TV (Figure 8.1).
These statistics suggest something even more powerful—clever marketing and integration that could take advantage of a tablet’s combined power for downloads and watching TV/video suggests that a brand leveraging the power of new digital devices can drive penetration, consumption, and brand awareness on an unprecedented scale. Moreover, because the cost of developing apps is a fraction of producing linear television (suite of top apps in the hundreds of thousands of dollars, versus the cost of a season of animated TV programming in the millions of dollars), access is not controlled by the filter of programming executives (apps can be democratically launched across multiple platforms). Further, since marketing and advertising costs for apps are lower (though costs are increasing, costs are still significantly lower, as well as capable of being more finely targeted direct-to-consumer rather than direct-to-demographic), toy companies with investments merely focused on controlling a slice of airtime are likely to find themselves playing catchup with those that can optimize this new ecosystem.
E-Commerce Plus Web-Based and Social Media Extensions
Although discussed in Chapter 9 regarding marketing, it is important to highlight in the context of merchandising the role the Internet plays. Virtually all films and major TV shows have dedicated websites, and within these websites users can often directly link to e-commerce applications to buy related merchandise. When I took over managing www.starwars.com, I was pleasantly surprised to learn (and I guess I really should not have been surprised) that one of the thriving parts of www.starwars.com was the Star Wars shop. This store, like many other Internet boutiques, was able to include within its product mix special online exclusives; more targeted marketing, and the ability to offer limited quantities, will sometimes allow a diverse SKU of unique items that may not be viable in the hyper-competitive environment of retail shelf space.
Since my first edition, the concept of dedicated “sites” has expanded such that a website is now not enough; all key brands also have parallel social networking sites, such as a Facebook page. Social networking sites can help cross-promote and link merchandising elements, even if the store may be embedded elsewhere. Additionally, video/TV properties lend themselves particularly well to apps, and a major franchise is apt to drive consumption via a combination of apps, social networking, and websites, all leveraging each other and capturing user data across the spectrum. As discussed in Chapter 9, the challenge today is to create efficient metrics and dashboards to enable brand managers to optimize engagement around key branding events (e.g., launches), capture user data to efficiently update and market to “fans” between events, and push out messaging that is configured for personalized storage and virally spread when touched (be that consumed, viewed, recommended, etc.). The critical element to this new paradigm is the personalized level of communication; in terms of merchandising, it is therefore not surprising that the trend has been pushed down to the personal level as well.
The tangible manifestation of everything being pushed down to the individual level is customization of merchandise, with e-commerce platforms able to create “print-on-demand” solutions for a range of product. Café Press and Zazzle are among the biggest names, with companies enabling fans of shows to customize a range of items, from apparel, to housewares (e.g., coffee mugs), to cell-phone covers. Images and even buzz slogans from characters can be customized with your name, or in a pattern chosen by the consumer. Because (in theory) this business does not require inventory, but rather companies can print or manufacture product on a 1:1 basis based on the particular customer order, a material business can be created with relatively small staff. All order manufacturing, invoicing, marketing, etc. is done via the website, fulfilment can be performed using third-party delivery services (leveraging the Amazon model), and, depending on the product, it is even possible to outsource the actual production. Not surprisingly, there are various companies, such as MashOn, leveraging this new on-demand model to deliver customized products tied to movies, TV series, and even games.
In addition to enabling e-commerce merchandise applications (both for digital and physical product, including items available only via the Web), the Web has enabled the phenomenon of secondary markets. Everyone is familiar with stories of the value of old comic collections, and eBay has enabled a vibrant marketplace for collectors—in essence, giving an entire new life to the collectibles market. While eBay is obviously a broader phenomenon, it is a boon to the world of merchandise.
A licensing program is based around trademarks affiliated with a movie or TV show, and creates a variety of product categories leveraging the brand and key characters. The categories are as diverse as one can imagine, and the following is just a sample list:
■ toys and games (including now app-based and social games)
■ apparel and accessories (including backpacks)
■ publishing (e.g., books, magazines, activity books)
■ interactive (e.g., computer games, platform games)
■ mobile (ringtones, wallpaper, etc.)
■ domestics (e.g., sheets, towels, bath and bath accessories)
■ housewares
■ social expression (including greeting cards, stationery, etc.)
■ sporting goods
■ food (including salty snacks, cereals, packaged goods, frozen, etc.)
■ gifts and collectibles.
Top brands can have literally hundreds of licensed properties, and the range of the program and how fine the categories are segmented depends on the property and philosophy of the licensor. The digital and online world is further expanding the possibilities, as movie sounds and music have been adapted for popular ringtones, and it is now possible to license avatars and digital accessories in a variety of environments.
Product merchandising, however, is an area where more is not always better, and the success of a program will depend on the commitment of the licensees and the licensor’s ability to exercise controls both with licensees and with retail to ensure quality and a level playing field for product.
Retail Buy-In and Support
A licensing program does not stop with concluding licensing deals, because a successful campaign will also have the licensor working with key retail accounts and licensees to ensure placement and coordination at retail outlets, which today also includes e-tailers. Amazon has a form of retail space and with home page placement, e-mail blasts, alerts, targeted marketing, and cross promotions, a campaign can materially influence the success of tied merchandising. A challenge with online, though, is that it can adjust more quickly and more democratically to index promotions to search and purchase metrics; thus, a successful product may build on its traffic (successful sales lead to a virtuous cycle of more frequent or better-placed search results and cross references), but it is harder to influence an underperforming product as the results, not promise of results, will dictate exposure (i.e., if underperforming, a producer will argue that warrants greater promotion since the title is not being found as expected, and yet the search results and indexing for promotion will actually be reduced since they are often linked to actual results, creating a downward spiral of reduced promotion; the nature of the online metrics linking to actual results tends therefore to accentuate the extremes, adding promotion to what is already successful, and perhaps too early bailing on a title not yet performing). As for large physical retailers such as Walmart, Target, and Toys “R” Us, these key accounts will stock a variety of products related to the brand, but will be dealing with separate and unrelated licensees, with each pushing its product at the level of the department buyer. To the extent an event (e.g., movie launch) or brand warrants it, special standees and sections can be created, pulling product from multiple departments, creating incremental retail placement, and highlighting the brand; moreover, if the retailer buys in and believes aggregating product will drive traffic, then the retailer is also more likely to promote and advertise the selection, either in circulars and/or with hard media using co-op advertising funds. When the last Star Wars movie was released, for example, the merchandising program was robust enough that Walmart even participated in special “tent” events at select locations: What could be better than not having to leave the parking lot to fight with a lightsaber?
Any successful licensing program will therefore focus on retail-specific programs. You know you have stepped into a licensing meeting when an executive is talking planograms and live on-shelf dates. Another reason retail engagement is so critical is that the very nature of product merchandising speaks franchises, and if there is oversupply of product or too many licensees, such that the retailers get hurt (as opposed to the product licensees), then a campaign is not only unsuccessful, but the future is undermined. Some will take a “take the money and run” approach, focusing on guarantees, but a successfully managed campaign will spend as much time working retail engagement, placement, and metrics as the deals for the products themselves.
Licensing has a longer development/planning cycle than any of the traditional media categories (e.g., theatrical, video, and TV distribution), which often puts crazy pressure on divisions to lock in plans before the details of a project are even worked out. If cutting a trailer for a film is difficult because the movie is not yet done, then creating product for that movie takes the challenge one step further because decisions often need to be locked before the filming even starts.
Timing
Lead times of two years are not unusual, and anything short of 18 months may make developing product and getting it on-shelf in time impossible. This is simply the nature of product development—the entire supply side, from designs, to materials, to molds, etc., takes time. Virtually everything is outsourced for manufacturing, which means location and subcontractor decisions are involved, plus product samples need to be made and approved. (Note: Product placements (which can sometimes be confused with merchandising), such as a special car being featured in a film, similarly need long lead times, as the integration has to occur before filming. See Chapter 9 for a discussion of product placements.)
Style Guides and Quality Approval
Before any product is made, the licensor will create a detailed style guide. This guide will include the logos and typefaces to be used (including a variety for different types of packaging and sizing), approved artwork for characters, including in different poses and turnarounds (e.g., flat and dimensional), approved trademark and copyright notices, approved color palates, approved phrases, approved peripherals (such as weapons or vehicles from the property), approved size charts (relative scale of one character to another), etc. KidScreen magazine, describing how a style guide can differentiate a pitch and is at the heart of any consumer product program, referred to style guides as “doing overtime as a calling card, a presentation piece, a licensee manual and a brand road map all at once. So getting the right style guide is crucial to scoring a [merchandising] hit.” It then continued to detail the elements of a guide: “Most guides start off with a general description of the film or TV show and then get into the nitty-gritty graphic components, including icons, logos, color guides (breaking out main, secondary, and accent palettes), character and background art, prints, borders, patterns, phrases and text that can be used, fonts and sample product applications.”16
The goal of the style guide is to create brand consistency. If over 100 products are made in varying media and mediums, the licensor needs to provide a blueprint around which specific items are then designed. In the case of Barbie, which has approximately 1,000 licensees working across 45 product categories, there is a template to rein in too-divergent elements, but Mattel claims that while “you do need a few rules, because that’s how a brand becomes clear and cohesive,” they strive to work with licensees throughout the process and avoid steering the process through too narrow a creative tunnel.17 The style guide then provides a working anchor for quality control, as sample designs and product must stay within the parameters outlined. To the extent the product is consistent, then the licensor’s review for quality approval is infinitely easier.
This is one of those areas where I touch upon it in a paragraph or two, but the execution of the style guide and approval over designs and sample product are the lifeblood of the merchandising campaign. Failure to timely approve items or to properly inspect quality are the surest way to doom a program, and cannot be taken for granted. This becomes an economic consideration, because once deals are signed, there is the temptation to assume “licensees know what they’re doing” and relax. In fact, it is tempting to cut budgets around personnel to review product, especially as the numbers and categories grow. Almost all merchandising managers will testify that they have rarely seen cutting corners pay off, because there is nothing more competitive than the retail shelf, and consumers are always savvier than anticipated. This is why companies will invest significant funds up front in the creation of a style guide (most aspects of which can apply to online/digital representations as well), with the bill ranging from tens of thousands to well over one hundred thousand dollars.
I have waited until this point to describe key elements of licensing deals to punctuate the point made earlier that while signing up licensees is obviously critical, if a licensor puts full stock in that element at the expense of developing sophisticated plans for approvals, style guides, and retail management, then, at best, license deals will not be optimized and, at worst, undermined.
Licensed Products and Property
“Licensed product” is exactly as it sounds: the specific products being authorized, such as action figures, T-shirts, key chains, digital avatars and accessories, or wallpapers. The “Licensed property,” in contrast, refers to the underlying rights (e.g., trademarks) upon which the products may be based.
Licensed Rights—Exclusive versus Nonexclusive Rights to Licensed Properties
The license agreement will make it clear (hopefully) whether the licensor conveys either exclusive or nonexclusive rights to use the licensed property in connection with a defined category of licensed products (and to add further legal boundaries, of course during a limited term, and restricted to the defined territory). Because the license rights ultimately derive from the ability to use the licensor’s trademarks with products based on the underlying property, to the extent the licensor is allowing multiple products, then conceptually the license is nonexclusive; however, most licenses carve out a measure of category exclusivity, such as the exclusive right to make watches or trading cards. It is this niche level of exclusivity (whether a de facto practice adhered to on a relationship basis, or expressly granted) that allows franchises to spawn hundreds of licensed goods and obtain minimum guarantees against narrowly defined category exclusives.
Although most film-based licenses tend to be category-exclusive, one can also find general market examples of nonexclusive product licenses. A prominent example is found in sports, where individual teams may permit a number of manufacturers to make a product such as multiple companies creating apparel using team logos (in which case, one shirt may bear trademarks of Nike and Team X, and another shirt Team X plus Y).
Not only can the license be bounded by time, territory, product category, and exclusivity, but even by types of distribution outlets (e.g., novelty stores, grocery stores). This is somewhat akin to the video market, which is differentiated into retail categories (such as rental and sell-through), though ultimately much more complex because the segmentation adds the complexity of the character of the outlets rather than resting on the clearer dividing line of price and type of transaction (see Figure 8.2).
Economics: Minimum Guarantees/Advances
Minimum guarantees are important at two levels: first and foremost, they ensure the licensor a revenue floor, and second, they create incentives for the licensee to push the product to meet and hopefully exceed the guarantee. Licensing deals rarely stray from the concept of an advance against royalties, with these two items as the focal point of negotiations. This is not to trivialize other elements of the deal, or argue that when and how advances and royalties are paid is not critical, but it is important to recognize that at the heart of any licensing deal are relatively simple and direct economic terms. Unlike net profits from a film (see Chapter 10), Hollywood has not evolved arcane accounting standards around merchandising: at its guts are how many units are being sold, what the royalties are (and how they are calculated), and what amount, if any, the licensee will front against the royalties.
One wrinkle that can arise around minimum guarantees is that a licensor may want minimum royalty payments over defined periods such as on an annual basis. These thresholds are designed to ensure that licensees are continuing to market and push products; if certain sales targets are not met, this could trigger the right to terminate the license (or, conversely, extend the license if they are met).
Licensors are dealing with brands that have inherent awareness and goodwill (here, someone willing to pay money pursuant to a trademark license to associate a consumer product), and the ability to guarantee continued levels of sales and exposure can be as critical to brand management as the associated revenues. These types of licensors will not “take the money and run,” but rather take the money and make the licensees keep running. This is fundamentally different from deals based on straight license fees (e.g., TV, assuming no ratings bonuses), in which initial marketing commitments may be established, but thereafter the broadcaster has flexibility. In the context of TV, broadcasters typically have the obligation to pay the license fee, but then assuming the fee is paid they do not actually have to broadcast the property. Merchandising deal structures are more like video, where product sales are dependent on shelf space, retail execution, and thousands of points of purchase; similarly, both are consumer products, upsides are generally tied to volume, and with a licensor’s participation set as a per-product royalty.
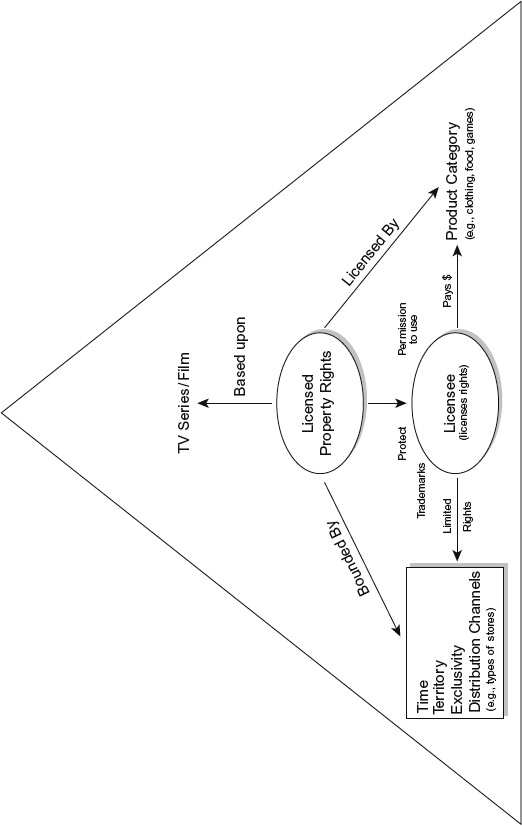
Figure 8.2 Licensing: Product Merchandising Ecosystem
Royalties
Royalty calculations are generally straightforward, and are expressed as a percentage of sales. The challenge is in defining sales, and then specifying what, if any, adjustments or deductions are permitted. First, in terms of sales, the product can be sold at multiple levels, such as wholesale and then retail (with further wrinkles if a product may be purchased from an overseas manufacturing facility where the pricing is pre-shipment and wholesale markup). Much like the context for video sales/royalties, the only pot of money a licensor taps into is at the wholesale level. A licensee makes its product and sells it to a customer (e.g., a retailer), and any corresponding royalty needs to be based on the gross revenue derived at this level. This is nearly an exact parallel to royalties/revenue that are accounted for at the wholesale price with respect to video. The one wrinkle here regards digital goods, for a digital asset—such as a character upgrade or weapon/accessory in a game—does not need to be manufactured, and accordingly royalties will be set off the consumer price.
Once the “gross” pot is defined from which the royalty is calculated, the next concern is defining whether there are any adjustments to this gross; a concept that is sometimes made confusing by defining this gross amount as “net sales.” There are multiple elements that may come into play to reduce the base from which royalties are calculated (e.g., Can a licensee apply trade and other discounts, such as cash discounts? Can a licensee have an allowance for free or promotion goods?). While it is standard to allow some deductions, as well as apply a cap on total deductions, much of the risk ends up transferred to the licensee. As noted earlier, the concepts of net and gross track common sense expectations and generally do not devolve into arcane accounting schemes.
Finally, it is worth touching on setting royalty rates. Unlike the video context, where there is a relatively clear economic logic to splits (see Chapter 5 for a discussion of setting royalties to approximate cost of the top splits), royalty rates in the merchandising areas tend to be set on straightforward percentages without the parties trying to match a cost of the top split or other structure (likely because of the low cost of goods, the production of which has been outsourced to Asia/lower-cost production centers decades before this became trendy in other businesses, and the opportunity costs of having to deal with this calculation on hundreds of different products). Of course, the notion of splits underlies the setting of any royalty, but the point is that there is less of a conscious mechanism here; rather, the percentages tend to be within customary bands per product category.
It is a trade secret what those bands are, but suffice it to note that certain product categories may be in the very low single digits, while others can be a multiple of this range and command double digits. The Los Angeles Times, quoting a toy analyst, noted regarding the range: “The studios license the rights to toy manufacturers and also receive royalties of 7 percent to 15 percent of the sales, said Chris Byrne, an independent toy analyst and contributing editor of Toy Wishes magazine.”18 The Hollywood Reporter, in its survey article prior to the annual New York Toy Fair (2008), pegged the numbers a bit higher; estimating for top properties that licensors usually receive an advance guarantee in the $1 million range, it references a group publisher from License Global magazine in citing that studio licensors receive a 10–15 percent royalty on wholesale (and that wholesale is roughly 50 percent of retail), and that for certain franchises such as Pixar’s Toy Story, the percentages can be even higher.19
A final element worth mentioning in the context of merchandising royalties is the impact of distribution fees, which tend to be much higher than those applied for non-ancillary streams. It is not uncommon for a merchandising agent/distributor to charge fees from 30–50 percent, the high percentage justified by the presumably tougher job of managing (and selling) multiple product SKUS, timelines, and quality control (see also “Role of Agents” below). Accordingly, the net to the licensor is impacted by comparatively low royalty rates (to an extent driven by thin margins) and very high off-the-top fees—a formula that means only a fraction of the wholesale revenues (and remember, this is a fraction of the often-quoted retail sales) ends up paid to the producer/owner of the TV show or film upon which the product is based.
Premiums are licensed product that are given away to consumers rather than sold. This may take the form of a figure included with a kids’ meal at a fast food restaurant chain, and the issue for the licensor is on what basis is it paid: the consumer has not paid anything for the item of merchandise, and yet the licensor needs to be compensated. Economically, there are two theoretical routes for compensation. The first would be to allocate a portion of the sale, treating the premium as a bundled good and attributing a percentage of the purchase price to the premium. This, however, is not feasible for a variety of reasons: (1) the retailer (e.g., restaurant) is not going to allocate away from its core product; (2) the product is temporary, in that the premiums are offered only during a short promotional window, which means that the same allocation would need to be offered for all product among competitors (e.g., Burger King is not going to give Warner Bros. a better deal in March for the product packed in a kids’ meal than they will give Universal the following month); and (3) there may be no wholesale price (as the retailer will sometimes directly commission and manufacture the item).
Given these complications, compensation, to the extent there is direct compensation at all and this is not viewed as marketing, may instead be based on the manufacturing price of the item. A royalty would then be calculated based on the production cost, which amounts to a nominal number per item. The licensor will agree to this small basis because the nature of premiums is promotional (and at some level it is only mutual leverage that keeps them from having to pay for this promotion), the products are very inexpensive (almost disposable), and, at essence, royalties on the product are an incremental upside and not the driver of the deal.
Licensing at an elemental level is about sales, and every company has to make economic decisions balancing the cost/benefit of an in-house licensing department versus outsourcing the function. Even with a large in-house staff, however, some elements will still be outsourced to ensure global coverage (there is simply not enough consistent throughput for most companies to have dedicated staff in all major markets worldwide).
Most companies will therefore utilize either a master agent or a network of agents, managing this sales staff via commission structures. The agent will be responsible for sourcing deals, helping negotiate contracts, monitoring quality and performance levels of the licenses, and in some cases even overseeing collections. The licensor then has the decision of what level of autonomy to authorize, and to what degree it will delegate management functions either up front (deal terms/selecting licensees) or during management and maintenance (e.g., product approvals). The degree of work will dictate whether the agent receives only a commission tied to royalties, or has an additional retainer/higher fees for performing overhead functions.
In addition to agents scouring the market to set up product licenses, the business is now so big that Hollywood agencies separately represent toy companies and individual properties to try to set up tie-in movie and TV deals (e.g., WME represented Hasbro to turn games such as Trivial Pursuit and Candy Land into film and TV products tapping its talent roster).20
Toys are the sweet spot of most merchandising programs, and a licensor leveraging a film property will usually first attempt to sign a master toy license. Such a toy license will cover a range of potential products, such as toy vehicles, action figures, and themed props (e.g., swords, guns, apparel). For perspective, it is important to understand the breadth of the market, not simply in overall licensing program terms, but also in terms of diversity of toy revenue. For example, while action figures are undoubtedly a key driver, creating stimulus for kids’ role-playing and buying ancillary accessories and props, action figures make up only a part of the puzzle. Action figure sales have hovered around the same percentage of the overall market in the last several years—$1.25 billion of the $22.6 billion overall toy market in 2006, and $1.3 billion of the $21.18 billion market in 2011 (both estimates by NPD group).21
In terms of how big merchandising tied to an individual film can be, it is possible to earn in the hundreds of millions of dollars. Business Week, in an article describing how Marvel and the whole industry underestimated the extent to which The Avengers (summer 2012) would be a hit, noted that Hasbro would make around $150 million in sales from Avengers product. While that may seem like a great success, in quoting an analyst from BMO Capital Markets, it noted: “Normally, a movie that makes more than $1 billion at the box office would produce $250 million to $300 million in toy sales …”22
Mega Deals: Star Wars and Spider-Man
The amount of money that can be made from toys can reach extraordinary heights, as evidenced by Hasbro’s success with Transformers and its deal with Lucasfilm for Star Wars merchandise (pre Disney’s acquisition of Lucasfilm). Discussing an extension of its initial $590 million agreement with Lucas Licensing (Lucasfilm’s merchandising arm), Hasbro advised that, in addition to a term extension, the new agreement lowered “the minimum payment guaranteed to the film producer George Lucas because of less-than-expected sales. The minimum payment was reduced by $85 million, to $505 million.”23
Another example is Marvel (also pre its acquisition by Disney), where Hasbro put up a $200 million-plus guarantee for toy and game rights across Marvel’s properties, including Spider-Man, Fantastic Four, and X-Men for five years; Spider-Man was clearly the driver in the deal, as the New York Times reported the “license guarantees Marvel $205 million in royalty and service fee payments, of which $70 million and $35 million would be payable on the theatrical release of Spider-Man 3 and Spider-Man 4, respectively.”24
These types of guarantees and deals are clearly high stakes. In the case of Hasbro and Star Wars, to some degree the toy manufacturer bet the company, as in addition to paying huge guarantees, Lucasfilm was granted $200 million in warrants for Hasbro common stock, which Hasbro had the right to repurchase.25
In recouping guarantees in this order of magnitude, one also has to keep in perspective that the dollars available are based on the wholesale amounts. As discussed previously, just like box office and film rentals, the relevant sums here to recoup advances are based on the net wholesale revenues, which extrapolate up to staggering sums needed at retail to break even. In analyzing the risks Hasbro was taking on its Marvel licensing deal covering Spider-Man sequels, one analyst that ultimately believed the deal would be profitable, despite its cost, was quoted by the Los Angeles Times as saying: “The company needs $1 billion in Marvel-related sales over the next five years to make a profit on the license …”26
Perhaps with this much at stake, it is not surprising that studios, and in particular Disney, have tried to leverage their consumer products infrastructure to optimize merchandising sales tied to key film properties. Disney, which in the last few years has bought both Marvel and Lucasfilm for the franchise value of their key brands (e.g., Iron Man, Star Wars), clearly looked to merchandising upsides as part of its rationale for the deals. When acquiring Lucasfilm, the Hollywood Reporter referred to Disney’s CFO Jay Rusulo’s statements in paraphrasing: “in 2012, Lucasfilm revenue from licensing and merchandising will be around $215 million, which is roughly equal to what Marvel was doing when they acquired that brand in 2009. Since then, Marvel has seen big increases in consumer product sales and Disney expects the same to happen with Star Wars.27
Rank |
Company |
2011 sales |
Brands |
1 |
Disney Consumer Brands |
37,500 |
Mickey Mouse, Disney Princesses, Disney Fairies, Toy Story, Cars, Marvel Brands (Note: Marvel, which in 2007 was #5 overall, in 2011 contributed $6 billion of Disney’s $37 billion-plus.) |
5 |
Warner Bros. Consumer Brands |
6,000 |
DC Comics superheroes, new characters for film and TV |
6 |
Nickelodeon and Viacom Consumer |
5,550 |
Dora, Diego, SpongeBob SquarePants, South Park, Neopets, miscellaneous TV Products properties |
14 |
DreamWorks Animation |
3,000 |
Miscellaneous animated properties/films |
15 |
Lucas Licensing (pre acquisition by Disney) |
3,000 |
Star Wars, Indiana Jones |
With this level of sales, it is not surprising that studios, networks, and producers controlling franchise rights are among the largest sellers of licensed merchandise, along with sports leagues and other major consumer brands (e.g., clothing, electronics, autos). License Global magazine, which performs an annual survey of the industry, listed several media companies in its top rankings (see Table 8.1).28
Coming Full Circle: Toys Spawn Films Spawn Toys
In the ultimate example of coming full circle, the Hasbro toy brand Transformers spawned a movie, with the movie then serving as the catalyst for a diversified product licensing program. The Los Angeles Times noted that Hasbro, confident of boosting its Transformers brand, had “signed deals with 230 licensees worldwide for T-shirts, bedding, cell phones and shoes.”29 This Transformers campaign turned into a huge success, with the initial film garnering more than $300 million at the U.S. box office (and more than $700 million worldwide) and increasing Hasbro’s sales of Transformers toys fivefold from $100 million to $500 million, proving synergy between merchandising and toys.30 The franchise has since gone on to include three sequels, with Transformers 4 set for summer 2014, and Transformers: Dark of the Moon itself grossing over $1 billion at the worldwide box office in 2011.
This Transformers synergy was so successful that the company aggressively moved to repeat this type of success. In 2009, Hasbro and Paramount partnered on G.I. Joe: The Rise of Cobra, which garnered more than $300 million at the global box office and led to a sequel, G.I. Joe: Retaliation. With its proof of concept, Hasbro struck a multi-picture deal with Universal to develop films related to its other key brands, including Monopoly, Candy Land, and Battleship.31 Despite significant media hype over this partnership, the companies parted ways at the beginning of 2012. Their biggest film project, Battleship, starring Liam Neeson, reputedly cost $209 million32 to make, but grossed only $65 million from the U.S. box office, debuting in May 2012 leading off the summer season.33 Hasbro and Universal continued to partner on Ouija, but on an entirely different investment scale, with the film originally in the $100 million range and then later reputedly targeted in a low budget range of $5 million for a 2013 release.34
The thirst for tie-ins and the perceived virtuous cycle of toys spawning films spawing toys, however, continues, as Sony quickly jumped in to work with Hasbro, partnering with Adam Sandler and his Happy Madison Productions to develop a movie based on the hit game Candy Land.35 Accordingly, if Candy Land comes to fruition, Hasbro will have launched major feature films based upon its toy lines with three different studios, generating global box office well over $1 billion, and making it one of the leading independent production companies in the world.
Toys and the Internet—Growing Crossover with Avatars and Virtual Worlds
One would think, conceptually, that toys, dolls, and stuffed animals would be one category somewhat isolated from the impact of the Web. This is not the case, as toy companies and studios are finding ways to cross over categories, creating new interactive elements to established franchises and growing entirely new brands and worlds.
Mattel, which previously took Barbie from a doll to TV movies and direct-to-videos, launched www.barbiegirls.com, where kids can play with avatars and unlock “VIP” content (by paying for them, or plugging in a Barbie MP3 player bought at retail that unlocks characters when connected). Rival toy company Hasbro built a virtual world to complement its Littlest Pet Shop, where each pet has a code in its collar that allows users to enter the site. Not to be outdone by the toy companies, Disney experimented with a couple of Web-related toy lines, including “Clickables,” based on Disney fairies, which enables kids to interact with a linked virtual world. Summarizing the trend at the 2008 annual toy conference, Toy Fair, the Hollywood Reporter noted: “The biggest trend industrywide at Toy Fair … is the increasing number of toys being sold that connect to Internet play and, with the inputting of special codes found on the toys, unlock virtual worlds.”36 And when there is new value, everyone starts to jump on the bandwagon: one of the original success stories, Webkinz, had a value in 2008 estimated by some in the $2 billion range. Their website is kid-friendly and simply states: “Webkinz pets are lovable plush pets that each come with a unique secret code. With it, you enter Webkinz World where you care for your virtual pet, answer trivia, earn KinzCash, and play the best kids games on the net!”37
As noted above in the context of Rovio’s Angry Birds, apps are becoming a leading outlet for creating virtual worlds and playing with avatars. This is apparent by looking at the paid app section of Apple’s iTunes store, where apps tied to leading kids brands are often among the top sellers. In fact, the Wall Street Journal noted how three of the top five apps in summer 2012, and in fact the top three slots at one point (including Temple Run: Brave, tied to the Pixar film Brave, and top app Where’s My Perry? linked to a character from Disney television cartoon Phineas and Ferb) were from Disney. The Wall Street Journal, focusing on the trend of kids playing apps on smartphones, noted: “Now, with kids spending more and more time playing games on their iPhones, big companies like Walt Disney Co…. are increasingly using apps as a distribution channel for their own brands while hunting for hits they can exploit in their broader operations.”38
Whether or not an avatar, used in a virtual world, on a mobile phone (e.g., tied to instant-messaging services), in a tablet app, or in social networking sites (where the lines are being blurred for kids, as in communities such as Club Penguin), is a type of virtual ragdoll is up for debate. What is clear is that toy companies and entertainment brands are striving to find ways to expand their characters and worlds into the virtual space. Moreover, once this transition is made, the entire merchandising food chain starts anew in the virtual world, with opportunities for e-commerce (pay to dress up your character or buy him or her accessories), linked games, apps, etc.
In my prior edition, I asked Howard Roffman, then president of Lucasfilm Licensing, who had overseen Star Wars-branded merchandise for over 20 years, what he thought about the online world’s impact and whether virtual merchandise would become as big as toys. He stated:
The online world is definitely beginning to impact the world of merchandise licensing, and that impact is rapidly evolving; we are just seeing the beginning today. Online retailers can offer higher-end collectibles that would be challenging to sell through traditional retail, such as the very large and expensive building sets that are offered exclusively through Lego’s online “Shop at Home” outlet. Online also offers opportunities for customization and targeting discrete market segments that would not be practical through brick-and-mortar outlets. While it is hard to imagine purely “virtual” goods such as avatars and ringtones becoming as large a market as traditional toys and many other popular mass-market categories, the day is clearly coming when content-driven items such as video games and DVDs will be consumed primarily via the Internet, all but eclipsing traditional retail.
Extending the Franchise: Video Games, Books, etc.
Video games and books are somewhat unique within the merchandising realm, because as opposed to toys or T-shirts, video games and books are derivative properties that often branch a story in a different direction. While still grounded in a movie, or the core iconography or characters of a franchise, games and books allow the creative freedom to explore different tangents and backstories, extending the core franchise (see also prior transmedia discussion). Of course, certain games and books are merely direct translations of a property into another medium, such as a novelization of a film, but the bigger a franchise and the deeper the fan base, the more options the rights holder has for creating new intellectual property grounded in, but not directly parroting, the underlying franchise (see also companion website for discussion of console games).
To an extent paralleling the move of toy companies to control more of their destinies—create channels and content to control more of the pie, rather than simply licensing their properties—book publishers have even set up their own film and TV divisions. Motivated by diverse factors, including watching the erosion of their traditional business, fearing pending additional disruption via e-book companies such as Amazon launching their own publishing arms, and seeing the lion’s share of profits from film adaptations of book series go to the studios, publishers such as Random House and Macmillan have launched in-house film and TV arms.39 Although there is logic in retaining more control, that control comes with a cost and associated high risk—it remains to be seen whether these traditional publishers will have the stomach or cash reserves for the roller-coaster process of financing films, and it is more likely that the experiments will first play out in TV, where there is lower risk and a natural fit for serialized stories. Given the overall challenges of the publishing business and the demise of major bookstore chains and specialists alike, the cycle of “ancillary markets” overtly feuling films that then fuel more ancillaries is unlikely to be commonplace and therefore disruptive to the traditional ancillary cycle. Publishers have done quite well historically with the symbiotic relationships of launching properties (from books) and creating properties (novelizations) tied to Hollywood, and the associated risks and costs in the name of hypothetically increasing profits is probably too big a bet outside the companies’ core expertise. Moreover, there is an unspoken snobbery in the book world, where the written word, so engrained for millennia in culture, is perceived either as a higher art form or a more learned form of intellectual property; accordingly, licensing rights to a hit novel is seen as opportunistic capitalism, while consciously targeting film has a whiff of debasement to the purists—meaning development of films within venerable publishing houses is apt to face cultural hurdles.
Growth of Social Games and Importance of Data Analytics
Zynga, which went public with a market capitalization more than $7 billion in 2011 (before its stock fell severely back down to earth in 2012), in many ways defined the social games space. Moving beyond its success with traditional games (e.g., poker) and themes (e.g., Mafia Wars), Zynga created original properties such as Farmville, CityVille, and Empires & Allies, leveraging a model utilizing database/customer mining, a freemium economic model, viral growth (as an almost positive parasite feeding off of social network traffic and interactions), and virtual goods. The power of the model not surprisingly spawned other social games companies, with Playdom gobbled up by Disney, Electronic Arts acquiring Playfish (which went on to launch the hugely successful The Sims Social, extending The Sims brand into this realm), and core-gamer focused independents (Kabam) raising venture capital in amounts exceeding what many IPOs generate. I do not plan to present a case study of or otherwise analyze Zynga or other social game companies; what I do want to highlight are some of the underlying metrics that make it and other social games companies tick.
The Zynga model, grounded in data analytics, has the potential to upend traditional metrics because these companies have tapped into the Holy Grail of customer engagement: networks and Hollywood do not know who their end customer is and rely on statistical samples such as from Nielsen to approximate consumer adoption and engagement, while social games develop a direct personal relationship with their consumers. Social games companies know who you are, can market new games directly to their user base, and can segment their marketing and offerings to users’ specific behavioural patterns. A good example is the release of Empires & Allies: because of Zynga’s customer database, it was able to report an astonishing 21 million-plus MAUs 20 days after launch in June 2011 (see below for a discussion of MAUs and metrics).40 What would Warner Bros. have paid with a film series such as Harry Potter to be able to directly market and engage with potential viewers based upon whether it knew that you had seen the first movie, the prior two, all priors in the series, had bought X items of merchandise …? Think about the discussion in Chapter 9 regarding trailering, which is trying to match demographics to target awareness, in an attempt to break down the barriers inherent in experience goods—how valuable would it be for a studio launching a new film in genre X, starring actor Y, to be able to directly market to the specific individuals who had watched/rented/bought a similar film that the studio is using to identify its target market? This is the power of Google and ad targeting brought to bear on the experience good quandary at the microscopic level of the individual.
Social Games Metrics
The metrics behind social game monetization are relatively straight-forward. In simple terms, social games focus on segmenting populations, much like traditional loyalty rewards programs, to create a funnel optimizing revenues (see Figure 8.3). Imagine a tornado, and at the top where the cylinder is the widest is the total population of users who have ever tried a game. How to measure this total population is a function of how a service or site captures registered users. For traditional games, this tends to be counting client downloads of associated software; for social games, the measuring stick is similar, but because they are browser or app-based, it is usually expressed in application installations. From this base, the key metric is then defining from whom this population of “registered users” can then be defined as active users. There is no precise definition of active users; however, because companies (and the industry, in terms of leaderboards) track users on a daily and monthly basis, an active user is usually quantified as an individual that has taken some action to be meaningfully engaged with the game (product) within a one-month period (hence the often-quoted category of monthly active users, or its acronym “MAUs”). What that user has to do within a 30-day period to be labelled “active” is somewhat murky; ideally, he or she should have logged into the game and spent some de minimis time playing. By defining active users, a company automatically also defines inactive users, and in theory the registered users can be segmented into MAUs, those who are active but not on a monthly basis (have not lost them entirely), and truly inactive users (remember, the inactive can still be an important basket to track, as companies have a 1:1 relationship with them, and it may be that they do not like one game, but are participants in another).
Daily active users (“DAUs”) are then a subset of the MAU base, with the calculation not exact (based on averages), but still precise in that it is simply a tracking/database management issue to identify those participants who are engaging daily. Akin to theatrical box office, these top-line numbers of MAUs and DAUs are publically reported by the bigger companies, and available on sites such as www.appdata.com. These numbers are then used to create leaderboards, and report relative positions on a daily and weekly basis, enabling rankings on both a per-game and per-developer (publisher) basis. Although tracking very different elements, the net result looks a lot like box office rankings, comparing films (what is up/down) and studios; rather than weekend box office, the reports are simply aggregating weekly performance. I have not looked into data in terms of what days are most important, but one can surmise that it is the inverse of box office; whereas box office is dominated by the weekend when people have free time to attend movies, social games are (to the disdain of employers) are often played at work with quick check-ins, and generate heavy weekday traffic.
All of the above is interesting, but falls short of the key metric, which is: Who is paying? Social games employ a freemium model, meaning participation is free, but once hooked in order to accelerate performance, move on, or enjoy the key features, it may be necessary to purchase something (e.g., a weapon, a character, a building); the trade-off is often time, but can also be a substitution for playing with a multitude of friends (as the games incentivize social behavior, to gain a level or complete some equivalent task to move on you may need to have three people join you; if you do not, then the equivalent of paying for a virtual friend to join you will suffice). Accordingly, the most critical metric is average revenue per user (ARPU). Again, how ARPU is calculated may vary. It can be calculated as total monthly revenue divided by the total number of monthly active users; for social games, the calculation, though, is often tied to DAUs (daily revenue divided by DAUs).
From this segmentation, companies then can delve deeper and look at the lifetime value of a user (LTV) and the average revenue per paying user (ARPPU). Lifetime value is simply an extrapolation of how long a user is expected to engage at a certain frequency and monetization rate, and can be calculated in accounting terms much like traditional forecasting. ARPPU is critical as it is capturing the amount of money generated per user from those users that actually pay (real dollars) during a defined period (can again, in theory, be tied either to daily or monthly use, but is almost always viewed as a monthly calculation, as focusing on people that pay everyday is slicing the pie to thin). Once again turning to our tornado, the paying user is the point at the bottom of the funnel. It is this bottom point that is the most important number, and that developers then segment into finer slices, trying to identify the most valuable of the valuable (again, think of traditional customer loyalty programs). The term of art that has developed for the most valuable of these paying customers is “whales”—whales are individuals that can spend thousands of dollars per month paying for virtual items. Different companies then attach varying thresholds, but, for example, whales may represent a small (but critical) fraction of paying users, often in a 10 percent or less range (e.g., could be 2–3 percent). The other 90 percent can then be segmented as well; if half of the paying users pay $2 or less per month (“minnows”), then the other 40 percent (given that 10 percent are whales) are in the mid range. This categorization can then be translated into ARPPU thresholds, such as whales may be those with a value of more than $X (e.g., $50 per month), etc.
How to manage the analytics then becomes as important as the measuring sticks themselves, as all numbers and averages can become misleading. A decline in ARPU, for example, may not be a bad thing if it is correlated with a significant increase in total active users (namely, less on average from an expanded base may generate more revenue). In the end, more users and more payers is everyone’s endgame at a macro level, with a focus then on monetizing the most valuable users (the whales). Because the business mode, though, is heavily dependent on mining the whales, it will be interesting to see if this remains sustainable, which in turn depends on the strength of product offerings. The natural comparison is gambling, but the “addiction” motivating players there is true money, while the payoff in social games remains virtual and status (leaderboard) oriented. Logic would argue that a business built on maintaining cash flow from a couple of percent of users is subject to upheaval, and the success to date of the leaders has been because of early entry and building remarkably large funnels.

Figure 8.3
On top of these numbers, companies then layer on traditional market segmentation such as age and gender, and can run reports that will show X percent of revenue comes from women between 25 and 40 who are DAUs. These trends can then be correlated with specific actions taken (types of virtual goods bought, areas visited). It is not difficult to see the possible permutations, and the value in managing the database both for monetization and for marketing. It is also an advertiser’s dream to have this level of data on customers interested in their brand (see below regarding implications for other media).
Films as Social Games
Not surprisingly, with the explosive growth of the social games market, creating a social game based on a film is a new ancillary exploitation. While these have been limited to date, this is a growing trend, as evidenced by social game-maker Kabam’s licensing deal with Warner Bros. to produce games tied to the new The Hobbit films. Venture Beat noted: “Kabam will make two multiplayer strategy games that will be free to play, where users play for free and pay real money for virtual goods. The Hobbit: Kingdoms of Middle-Earth will debut on mobile devices. The Hobbit: Armies of the Third Age will debut on Web browsers.”41
Sony, leveraging its animation and interactive units, sees similar synergies, and in fall 2012 announced the launch of a Facebook game The Hotel Transylvania Social Game (www.facebook.com/hoteltgame) tied to its animated theatrical film Hotel Transylvania.42 For the films, these efforts provide, at minimum, a marketing boost and viral reach through social media—in the best case scenario, the studios gain marketing breadth, guaranteed licensing revenue (if a brand license, such as in the case of The Hobbit), and an upside linked to the success of virtual goods sales.
I asked Chris Carvalho, chief operating officer of Kabam and former head of business development at Lucasfilm, whether he saw projects such as The Hobbit as exceptions, or going forward we would see movies, and especially franchise-type movies, launch social games with the type of regularity that films tie into traditional console games. He noted:
Absolutely, the market for social games based on licensed film properties will expand. The traditional console world is really struggling—people, and especially families with kids, are no longer as willing to spend $50-plus for a game, especially when there are now such engaging free alternatives. The free-to-play model proven by social games first on Facebook and now on smartphones and tablets is disrupting traditional gaming. At the end of 2012, Kabam had several games that grossed over $1 million per month, including two games where we licensed rights from Hollywood studios. We’re already working with Warner Bros. on our The Hobbit games, with Paramount on The Godfather: Five Families, and with NBC Universal for The Fast and the Furious. All these companies entrust their jewels with us because we have consistently delivered extremely high-quality experiences that engage fans with new story arcs, create a touch point to reach new fans, and deliver material financial returns to the studios. And unlike console titles, these games can be developed in 9–12 months—in order to release day-and-date with theatrical releases—and are updated every two weeks like a TV series. Not only do these games make money, but they help extend the franchise and build a community that can create an annuity, rather than just a one-time spike around a release. Our original franchise, Kingdoms of Camelot, has been played by over 25 million people, and is now the seventh-largest strategy game of all time in the history of gaming. It is still going strong three and a half years after release. People vested with finding licensing opportunities will, at one simple level, follow the money, the engagement, and the ease of taking games to market, and that means more free-to-play-based social games.
The companion website includes a short discussion of film-based games in the context of the historical games market; further, to set the context, this section addresses basic video game economics (again historical only, focused on the console market), including game development costs, platform history/dynamics (i.e., history of consoles), revenue splits, and pricing.
Additional Ancillary Revenue Streams: Books, Film Clips, Music, Live Stage, etc.
It is beyond the scope of this book to delve into the niche economics of each of these categories. What I want to point out is that depending on the property, any one of a number of categories could be fundamental either to the initial planning for a property, or the ultimate revenues downstream. There are countless films where music is an inherent element (e.g., 8 Mile, starring Eminem, Mama Mia, Les Misérables), and expectations of music-related sales can be as important an element in the overall forecasting as the video expectations. In contrast, a musical is a classic ancillary capable of out-earning a related film, but would rarely (if ever) be conceived of at the time of a movie. Mel Brooks’ Broadway musical The Producers (originally starring Matthew Broderick and Nathan Lane) almost assuredly earned a multiple of the return on the original film (starring Gene Wilder and Zero Mostel), yet it is highly unlikely these potential monies were factored into the calculus of whether the movie, made decades earlier, was to be made in the first place.
Surely, there was similarly no thought as to Spamalot, the 2005 Tony award-winner for best Broadway musical, when Monty Python released Life of Brian in 1979. The endurance of the Monty Python franchise almost reads as a testament to the power of ancillary rights, as well as evidence of the Internet as the next great sandbox. The International Herald Tribune elaborated: “For decades, Eric Idle has made sure that the Monty Python name continued to grace books, DVDs, concert tours, a Broadway show, even ringtones and video games. And now, he is helping bring Monty Python to the Internet. www.pythonline.com, a social network and digital playground, offers clips of old material so that people can make mash-ups, perhaps inserting their own pet in the killer rabbit scene from Monty Python and the Holy Grail.”43
Ancillaries regarding books are much more common than musicals. Most major films have “novelizations” of the movie that bring in material revenues, and are planned to hit shelves within the marketing window of the related theatrical release. Of course, a movie based on a book or series of books (e.g., The Lord of the Rings/The Hobbit, Harry Potter, Pride and Prejudice, The Hunger Games) has a built-in audience, and if successful will cause an uplift in existing book sales. If a franchise is big enough, it may spawn spin-off books (as distinct from novelizations of a particular film) that are an extension of the film’s universe or characters, exploring different tangents or time periods (such as the young adult series of Young James Bond novels). Star Wars is, again, a prime example, with countless New York Times best-selling books branded with Star Wars and grounded in the films’ iconography, but not directly related to a particular movie. In all cases, the producer or copyright owner may secure an advance for a license to the book based on its brand, and then earn negotiated royalties after the publisher has recouped any initial advance/minimum guarantee.
When speaking of ancillary revenues, the line becomes blurred between what may be referred to as an “ancillary” revenue stream and what is classic merchandising. The previous discussion regarding books is generally considered a merchandising exploitation, as are video game sales, whereas live stage productions and licensing of film clips tend to fall into the ancillary basket. This simply punctuates the importance of clearly defining rights and distribution channels, because deals for books, video games, and live stage rights have little in common other than the root ability to license the exploitation right to each category based on the underlying intellectual property rights in the originating film or TV production. Managed carefully, each of these rights can yield in the millions of dollars and are anything but “ancillary” to the entities tailoring the exploitation of these rights within their discrete markets.
And, if there is a distribution/revenue opportunity and it has not been exploited (e.g., a Batman musical?), you can be assured that it has been discussed, analyzed, and someone has made an offer for the rights. The danger with ancillary exploitation is that it crosses over into brand management, and it can sometimes be just as important to a franchise what opportunities it turns down as what to license/exploit. For every Disney on Ice, there is a disaster on ice looming.
The hotel and motel window is just as it sounds: this is the service you see when in a hotel room, and typically have a choice of several firstrun movies that can be ordered (with payment simply added to your hotel bill). All studios offer their first-run movies to the various providers, and the window is typically triggered by notifying the provider of a film’s availability. This notification will usually be several weeks prior to availability, as the services need to program available “slots.”
As an interesting and not unexpected anecdote, this is a distribution window where “adult entertainment” paces the field. Although statistics are not readily available, the buy rate for adult programming is a significant multiple of the average buy rate for a top Hollywood title (e.g., more than five times). Hotels wised up several years back, changing the billing to simply “film” or “movie” regardless of the program purchased, easing corporate expense accounts (and significant others) of the burden of questioning the details of the charge on the $300 per night hotel bill.
This is a market (US) of a few million hotel rooms that are serviced by various providers, although given the relatively small scale a few providers have historically dominated the market (e.g., LodgeNet, which a few years ago purchased rival On-Command).44
As with other distribution windows, the hotel/motel window is jockeying for its exclusive bite of the entertainment pie. Traditionally, this window has been slotted between the theatrical release and the video release. Regarding theatrical, the concern is to capitalize on the exposure in theaters and the awareness generated by the theatrical marketing campaign, while not taking any business away from the theaters. Accordingly, the window generally started in the range of 8–12 weeks from the theatrical release. Very few movies today remain in theaters for this long, however, and to the extent the films are playing out that far, the locations and screen counts have diminished to a marginal number. The issue, then, is: What is “marginal,” and would the availability of the film in a hotel detract from potential box office? Most theatrical executives would argue no, and the window from theatrical has been growing shorter over time.
A key factor influencing the timing is also seasonality, as hotels have peaks around holiday times, especially in the summer. Accordingly, July and especially August tend to be peak months. While the rhythm of the market used to be monthly, even the hotel/motel market is impacted by changing technology and the switch to digital media. With the ability to deliver and program digitally (versus physical tapes), hotels can now switch out programs with ease. This means that hotels are able to rotate in new programming more frequently, and in the last few years it has become possible for movies to have variable start dates (as opposed to the historical pattern of first of the month rotation tied to physical elements). Additionally, as availability dates can now be programmed flexibly, it is fair to hypothesize that a form of pay-per-view (PPV) will fully cannibalize the hotel window, and this revenue cycle will be absorbed and consolidated into a VOD/pay-per-view revenue pattern.
Finally, the length of the window is variable, but in some cases can run several months. Intuitively, this is longer than one would expect, because it cuts into the video window. To permit a longer window, it is therefore fair to posit that the distributor: (1) will assume the impact on video will be nominal (reasonable if viewed as an impulse buy, and non-substitutional if assuming you would not rent a video out of town, though a weakened argument as all access moves to VOD-based); and/or (2) has a compelling economic justification, such as receiving an advance guarantee (which, if high enough, needs time to be earned out). It will be interesting to watch whether this flexibility remains as video windows transition to on-demand viewing, and whether hotel/motel remains separate or becomes consolidated into VOD generally; because there is little incentive to upgrade systems and hotels earn margin on higher pricing from captive audiences (see below), any transition may apt to be slower than the pace of what technology enables.
Hotel/motel revenues are obviously dependent on guests paying to view a movie, and the frequency of ordering a program in the hotel is labeled the “buy rate.”
In terms of pricing for buys, the average consumer price is at a slight premium to a theatrical ticket price and can be even higher for a hot new title (e.g., $11.95). Pricing in this window, unlike theatrical pricing, has a fair measure of elasticity; the cost may be less for an average title or discounted when a title plays later in the availability cycle. In summary, the overall pricing range is on the high side both because the audience is relatively captive (stuck in a hotel room) and because the availability generally is early; namely, in advance of any other in-home/in-room availability such as on DVD. The resulting revenues are then split between the distributor and the service provider in a negotiated formula (e.g., sliding scale), which no doubt takes into account anticipated buy rates, the speculative nature of buys, and the limited peak window.
The total amount of money generated in this window is small when compared to the major revenue streams of theatrical, video, and television; hence, this is a classic “ancillary” revenue source. The order of magnitude for gross revenues (buy rate multiplied by amount charged) on a major title should, in theory, be capped in the few million dollars range, given the relatively limited points of access.
Let us assume that one room is available for 90 days (e.g., six months, with an occupancy or turnover frequency of every other day), which means five buys equates to 5.5 percent. Compared to redemption rates, which tend, as a general rule, to be in the low single digits for most coupon-type offers, this buy rate appears high, and this in turn supports the argument of a capped range on the revenue stream. Continuing a simple example, a five percent buy rate against 2 million rooms with an average price per transaction of $10 would yield $1 million of gross revenues (100,000 transactions × $10). And remember, this is gross revenue; net revenue to the distributor will be based on a split, which may be low if a guarantee is applied. If, for example, a film has grossed $3 million (triple the previous example) and the weighted average take from the distributor was 40 percent, then the net revenues would be $1.2 million. This is a fair example in terms of how the revenue stream should be viewed: if a successful film can earn a million dollars or more, and a lesser title a few hundred thousand, that is enough revenue to be worth the effort, yet not enough to be a driver of windows or a major source. Hence, we circle back again to the classic ancillary stream.
The international market is not as mature as the U.S. market. The issue here really is scale, for with the U.S. market being marginal in scale versus other revenue streams, the issue of resources versus return becomes a material concern internationally. The international market is fragmented, and turning a profit within a particular territory with a smaller population (and modern hotel infrastructure generally less sophisticated than the U.S.) becomes a challenge. While the international theatrical, television, and video markets have become major revenue streams, and in some cases surpassed the U.S. market, the same cannot be said of hotel/motel windows. In fact, this revenue stream/window is insignificant (and often nonexistent) for most theatrical fare. As for the future, I would argue that rather than seeing a maturation, it is likely that PPV and VOD opportunities are more likely to flourish and supplant what would have otherwise been a hotel window.
PPV (Cable) and Transactional VOD Roots
With the advent of digital downloads and streaming services online and via apps, the notion of “What is VOD?” is blurring. The changes enabled by download devices/stores (iTunes), together with VOD streaming services (e.g., Amazon Video-on-Demand, Lovefilm in the UK, and Netflix, now frequently labelled as iVOD) are discussed in Chapters 5–7, while this chapter outlines the roots of PPV; there is also premium VOD, offering VOD access to theatrical films close to the theatrical release, as discussed in Chapter 1, and associated evolution of the timing of its distinct window. In my first edition, I included transactional VOD within this chapter on ancillary revenues; however, with the realization of the virtual video store, and competing cable VOD services and iVOD streaming services gaining momentum as the new face of video rental (and depending on one’s classifications, pay TV), I debated whether to move the discussion of transactional VOD out of the “ancillary basket.” Given the shifting landscape, it is difficult to pigeonhole any VOD discussion, for VOD today cuts across video, TV, online, etc. Although I could accordingly argue that all VOD should be discussed in other chapters, because there still (for the moment) remains a separate VOD window, and because there are still applications of pure PPV, I have elected to include the discussion here within the context of its historical window placement.
While PPV has been around for years, until recently being enabled by digital cable set-top boxes, it never matured beyond a relatively small ancillary market. Whether this was due to clunky technology, limited offerings, or simply a market that was not ready for the model, it was clear that the new pay-for-sampling-or-viewing world is changing the historical pattern of consumption.
In the early phases of growth, the limited ability of servers to hold and download programming (both the number of programs and the speed of delivery) created hybrids that were clearly intermediate technologies. What grew up were variations of PPV such as near video-on-demand (NVOD), which were euphemisms for technical delivery. Historically, PPV was an event platform, perhaps most notably associated with sports such as boxing (and fights and out-of-market sports league packages are still a driver of classic PPV). If you want to watch the fight, pay $X and you will have access—no other way to see it. It then evolved into also showing movies that cycled: every time the movie started again you could tap in and watch/buy it. The more servers, the more times a movie could cycle through, which allowed the chance to opt in more frequently.
This gradation of when a viewer could access programming, which was inherently a technical limitation, defined the window or right. If a viewer could gain access only periodically (e.g., live-event basis), then it was PPV. If a viewer could gain access frequently (e.g., every five minutes), but not immediately, then it was defined as NVOD (imagine a back room of 100 VCRs all playing a tape of the same film so that the movie could start anew every few minutes). Anything accessed with nominal waiting time came to be classified as VOD, which clearly, over time, would come to simply mean instant access.
Residential VOD: The Virtual Video Store
Residential VOD had long been hyped as the ultimate consumer service: the technology promised the potential of a virtual video store environment unburdened by inventory costs, stocked with a catalog of limitless titles that were always on the shelf (wide and long tail), and accessible with the click of your remote. This ease of access to non-scheduled programming was a clear threat to the traditional broadcast television landscape, and added another challenge to a model that was already struggling to address consumers skipping the advertising that funded their production—as discussed in Chapter 5, not only is VOD a threat to TV, but residential VOD is in the process of fully cannibalizing the video rental market.
Domestic
In broad concept, there is little material difference between PPV and VOD (here, only talking about à la carte transactional VOD, and not subscription-based). In both cases, a consumer is able to pay to watch a program through his or her television at home. A flat fee is charged, and the program is available for viewing for a limited time. Historically, the movie, once ordered, would run like a live TV broadcast; however, with the advent of TiVo, and similar digital virtual VCR devices, the programming can be accessed and played over an allotted period such as 24 hours from purchase.
As previously described, the principal difference between PPV and true VOD is that PPV services have specific start times. In contrast, VOD allows the customer to select a film and start it whenever they want. These video store via television remote control services enable the ultimate couch potato: not only are you watching on the sofa, but you have not even risen to visit the video store.
Historically, back-end technology limited the selection of content accessible, making the range of movies available via PPV/VOD a fraction of the inventory a customer could find at his or her local video rental store. With technology improvements, such limitations have essentially disappeared, and today PPV and VOD services fulfill the digital consumption mantra of consumers being able to access what they want, when they want. With VOD having subsumed PPV, the only remaining delineating factor is the window. The window limits access overall, defined by when content is made available to the VOD service.
Providers
Like the hotel market, this similarly limited revenue stream has been dominated in the United States by a few players (e.g., InDemand, owned by a consortium of the leading cable providers, including Time Warner, Cox, and Comcast). (Note: The direct-to-home-satellite market, which is dominated by Direct TV, largely parallels the cable VOD market, and accordingly macro-numbers should capture both platforms.) Around 2005–2006, this market started to take off, as digital cable boxes enabled simple access to content. Gross revenues continue to increase, justifying aggressive marketing via cable systems such as Comcast’s branding of its Xfinity service. The new level of marketing was a clear signal that the market, which had been relatively flat for years, was entering a phase of potentially explosive growth—by 2009, InDemand reported it delivered 200 million paid transactions, and by 2012 it had increased its content offering to what it described as 70,000 hours yearly.45
Window
The window for residential PPV/VOD has historically been post video release, in part because in-home viewing of a film in a manner characterized as via a virtual video store is threatening to video sales. Because the PPV/VOD providers want to capitalize on awareness, which has waned significantly since the theatrical release and then received a jolt of life from the video marketing campaign, they naturally want the window to be as early as possible. If they had their druthers, the window would replace the hotel/motel window. Protecting the more lucrative video window has been the key priority, so the next best time is as close to the video release date as possible.
The window used to be several months after video, but as video has matured from a rental to sell-through business, and as the preponderance of DVD sales have become front-loaded, the residential PPV/VOD window kept accelerating. Originally slotted a distant six months, improved cable system offerings pushed the window to three months and then only one month post video. By 2012, studios viewing transactional pay VOD as providing higher margins than the other predominant rental options (e.g., Netflix, Redbox; see the discussion of Redbox pricing in Chapter 5) took the final step, and Warner Home Video offered its new release titles via transactional VOD day-and-date with physical discs;46 moreover, cable VOD now markets its offerings as being in advance of rental services such as Netflix and Redbox. There were experiments with day-and-date VOD/DVD several years ago—when Disney tested the concept via its MovieBeam service (before it divested the company), and fully collapsed the window and also experimented with different pricing for new versus library films (see also Chapter 1)—but it was not until the recent maturation of VOD, in combination with seismic shifts in the DVD market, that the economics justified a permanent and broad movement of the window. (Note: A premium VOD window has been set before DVD and closer to theatrical release, stirring boycotts from theaters that are wary of any further encroachment on their window, as discussed in Chapter 1.)
Again, lurking behind this window is a fear factor that VOD will fully cannibalize DVD sales. This fear seems to be going away, with studios working harder to harmonize these streams (leveraging one off the other) than they are to fight off cannibalization. (Note: Although there is an incentive to preserve higher-margin DVD sales versus generally lower-margin VOD rentals (see Chapter 5), so long as physical disc sales are material, this tension and balancing is likely to continue.) To some degree, what synergies are best realized may turn on which division the rights are coupled with: some studios place VOD under the video group, while others bundle these rights with the TV group, and more specifically pay TV. The pay TV grouping occurs because on the flip side of the window is pay television, coming several months following VOD. As the pay TV window tries to similarly accelerate to come closer to the video window, VOD has to fight to keep its positioning: close enough to video to capitalize on the marketing spend and corresponding awareness, and short enough with enough space to allow the larger pay TV provider to appear as fresh and early as possible. Because the consumer is only vaguely aware of all this timing, the segmentation works and the revenues are maximized. This is another illustration of the interplay of Ulin’s Rule factors.
Finally, coming back to the traditional/historical window, it is worth noting that because of this squeezed timing, the advertising of PPV/VOD availability to customers is in close proximity to the actual availability date. While improved marketing efforts (such as by the key cable operators) and the maturing market are changing awareness levels, historically relatively few people are aware that a title will be coming to VOD, as opposed to awareness of video availability. This historical lack of marketing (which is changing the more that VOD becomes the face of video rental), combined with VOD lending itself to a browsing pattern, means that VOD purchases tend to be impulse buys.
I have not seen specific market research on this issue, but I would speculate that most consumers traditionally ranked VOD as a default choice, scanning VOD availability when they were dissatisfied with the other choices on TV. Perhaps the VOD/PPV operators should be paying Bruce Springsteen for his lyrics “57 channels and nothing’s on,” for it is the dissatisfied channel surfer already tuned to his or her TV who is most likely to divert to the VOD tangent and be swayed to plunk down a few dollars for instant gratification (if not literal salvation from the negative experience of not finding something on TV that excites him or her). As the market matures, and as VOD becomes more of the norm, then it is fair to expect the consumer pattern to shift and VOD to become the first menu scanned—a change thar is already happening, with “what’s new” hosted programming appearing as users move to browse VOD offers (produced by MSOs such as Comcast) already supplanting the static “upcoming titles” signs at video rental stores. Arguably, this will be the tipping point for window changes, but as described in Chapter 7, the competition from OTT services requires sea changes in strategy, not minor window tinkering.
As the consumption pattern shift was accelerating, I asked Jamie McCabe, Fox’s executive vice president, worldwide VOD, PPV, EST, how he saw the market’s maturation, and he advised:
The fastest-growing segment of VOD is that of the OTT services of all business model: SVOD, free on-demand, and transactional rental and sale. Once dismissed as an inferior video pipeline that would be reserved for short-form content, now Internet video services have grown exponentially as consumers continue to connect not only their big screens, but increasingly engage in smaller-screen personalized viewing.
The breadth of content offerings, sophisticated search engines, visually compelling merchandising, and the seamless integration with multiple devices have fostered a trend toward OTT long-form video growth. The efficiencies, scale, and global device relationships have allowed these services to broaden their availability outside the U.S., in some cases ahead of entrenched video incumbents. MVPD providers are responding to this trend by introducing their own multi-screen offerings, extending their reach well beyond the set-top box.
In my prior edition, when VOD was on the rise but the over-the-top market was still in its infancy, Jamie had presciently noted about the inherent pull of VOD generally: “Once given the benefits of choice, control, and instantaneity, users are very satisfied and the VOD habit is formed.” Today, I would argue VOD is the new habit and the landscape change is no longer about the rise of VOD, but rather the access points, as over-the-top and Internet-enabled devices have changed the matrix from “get everything you want now” to also “get it at home or on the go” (see Chapter 7). I recognize that I have digressed a bit from the promise of only describing VOD roots, but given the degree of convergence, it would be misrepresentative to only describe PPV as if VOD and OTT access were in no measure related.
Economics
The PPV and VOD markets tend to work on straight buys, which makes sense given the general impulse purchase. This construct then lends itself to a revenue sharing, or sliding scale model (akin to hotel/motel), with the content provider in position for a larger share absent minimum guarantees. Without an advance, the VOD service can be viewed as simply a pipe or a location for access, such as a movie theater, with a form of sharing matching relative risks taken and the unpredictability of direct consumer consumption.
In terms of macro values/revenues, this window used to be a truly ancillary stream when compared with video, TV, and theatrical revenues. In my first edition, though, I posited that the revenues would become more valuable than hotel/motel and, as an order of magnitude, a strong title properly positioned should theoretically be able to earn a multiple of the money earned from hotels. This bump versus hotel makes sense, for the universe of customers is larger, and the larger base directly corresponds to greater consumption. The tempering factor to the relative market size (base) is timing, as the further out exposure is from the video marketing campaign, the less “fresh” a title seems and the buy rates tend to diminish. In 2012, though, the evidence was finally in, and the promised upside from VOD rentals was demonstrated by the film Bridesmaids. Bridesmaids was rented 4.8 million times, and grossed more than $24 million through VOD services, making it in 2012 the then top VOD title ever; moreover, if traditional VOD (e.g., Comcast-type cable VOD services) is combined with Internet VOD (iVOD, such as available via Amazon on Demand), hotel and motel, and electronic sell-through, the title generated more than $40 million.47 The same title crossed the $100 million threshold in DVD sales, but what was most interesting is that when looking at traditional VOD and iVOD rental transactions, the gross revenue was in the order of magnitude of 25 percent-plus of DVD revenues—it is not difficult to see that as DVD revenues continue to decline (or, at best, flatten) and VOD and iVOD continues to grow, that this market will mature from a smaller ancillary market to a major life-cycle market. In fact, as discussed, VOD is already the new rental, and it is only a matter of time before it surpasses traditional video revenues.
While it is relatively easy to posit that VOD will continue to gain in influence, a trickier question is: What form of transactional VOD will be the most common? Namely, will the cable and satellites services, such as Comcast’s Xfinity, become the next Blockbuster, or will OTT services and digital technologies come to dominate? Traditional VOD services have had a head start, and are not suprisingly in the lead: by the end of 2011, the market for paid movie rentals by pay/transactional VOD services was $1.3 billion while the iVOD market was a fraction of the size, at $204 million.48 Although the growth rate of iVOD continues to be robust, cable’s stonghold in homes has so far allowed it to stay dominant. (Note: Netflix type SVOD is excluded here, as just focusing on transactional VOD.) In 2012, the NPD Group reported: “Led by Comcast in the first half of 2012, 48 percent of all paid video-on-demand (VOD) movie rentals were generated from cable VOD. With a 24 percent rental-order growth rate year-over-year, telco VOD is the fasting growing segment of the VOD market, outpacing the IVOD growth rate of 15 percent.”49
Despite OTT VOD being the smaller piece of the transactional VOD pie, it is clearly growing quickly, and is viewed by many studio executives as the fastest-growing new segment. When (and, in fact, whether) it will surpass cable/satellite paid VOD is an interesting question, and but for the installed base of cable, coupled with deep marketing pockets, I would say iVOD leading the market is a good bet—part of a sorting out of the new equilibrium will depend on price, and part demographics, but the cable companies need to be wary of the generational shift where viewers do not need to “cord-cut” because they have had easy access for years with no cord at all (so-called “cord nevers”).
Finally, as forms of VOD come to supplant video rental, then it also makes sense to see a harmonizing of the VOD charge and video rental fee—a convergence that is already happening. Also, not surprisingly, VOD pricing is less expensive than renting a movie in the hotel/motel window, arguably because: (1) it is not a captive environment like a hotel room; and (2) the PPV/VOD window is significantly later in the life cycle than the hotel/motel window. The resulting charge to the consumer for viewing the same film at home via VOD/iVOD may be less than half of what it would have cost to see the same film a few months earlier in a hotel room.
International
Unlike the hotel market, with the larger residential VOD consumer base available to be tapped, the international VOD market is growing faster and is generally exploited on most major studio product.
Similar to the United States, the maturation of this window had been held back both by waiting for available technology to execute efficiently and the overriding paranoia of negatively impacting the immensely valuable (and, until recently, stable) video market. Also, paralleling U.S. trends, with the maturation of the sell-through video market, VOD availability has been perceived as less of a threat. As a result, the standard window for VOD in most major international markets has also been creeping forward toward the video availability date, and like the U.S. is apt to become simultaneous with video and become the face of rental.
One interesting difference that may differentiate economics is that while non-Internet VOD in the United States has been dominated by cable, in many global markets where satellite delivery (rather than cable) is the norm, the set-top boxes tend to be part of/distributed by the pay TV services. Accordingly, content suppliers diversifying their deals with pay TV channels to also license VOD rights will naturally look to pay TV structures. Pay TV licenses, however, are premised on minimum guarantees (tied to subscriber bases), whereas VOD deals tend to be structured as revenue shares because of the uncertain buy rates from customers. One can expect that as these markets mature, business models will shift with them; if deals start with guarantees to acquire content (mimicking pay TV structures), then over time they will adjust to reflect the value of buy rates, or change to a revenue-share basis dovetailing with the à la carte nature of impulse buys.
Complicating the picture is the fact that in some territories, broadband and phone company providers are aggressively entering the market; leveraging online delivery/access systems, these companies are trying to co-opt the VOD market by converting their subscriber base and directly competing with the pay services. Accordingly, in some markets, phone company affiliates are battling the pay services; in others, it is broadband services versus pay TV providers; and, in some markets, cable, broadband, phone, and pay services are all competing for VOD. The one common thread is that everyone seems to acknowledge that VOD, grounded in the new on-demand, more open-access-to-content psyche, is the next great frontier.
The airline market, often referred to in the trade as in-flight entertainment (IFE), has been relatively static compared to the explosive growth of video and recent activity in the VOD/PPV sector. While there have been improvements in presentation quality and diversification of delivery systems to allow personalized choice, the economics of growth are somewhat capped. There are simply so many flights and a fixed capacity of premium-priced seats that can generate additional revenue. An airline is a bit like a theater chain. There is a fixed inventory of seating, and while investment can be made to upgrade the experience while in-seat, beyond the key driver of filling capacity the elasticity for revenue increases: (1) has been limited by the ability to increase ticket prices; and (2) remains dependent on the ability to add variable charges (or bundle in charges in premium-priced tickets) for ancillary items (e.g., concessions at a theater, drinks/food or personal VCR with business/first class on airlines).
The most significant change in the market over the last decade or more has been the addition of personal screens, as well as personal video systems to complement the overhead projected main screen. While the main economy cabin on a number of airlines will still exhibit a film in a manner very similar to what was utilized 20 years ago, virtually all airlines offer a premium movie service in business and first class. These premium services include distributed, on-demand, and personalized video systems: these systems all afford passengers greater choice and, in cases, flexibility in viewing.
A distributed system offers a series of programs (e.g., eight choices) that are cycled through, repeating at fixed intervals. A true on-demand system will offer a menu of films, akin to a virtual video store, and the passengers can select from a wide variety of films to play on their individual screens; such a system may offer both additional choice, as well as flexibility, incorporating DVD player functionality (e.g., ability to pause/fast-forward). Finally, as an intermediate option some airlines literally offered a personalized player—mini-digital video players, where a stand-alone machine and a tape or DVD are brought to the seat (meaning that formats and materials are similarly diverse). This is the equivalent of the “old days” at rental stores, when you could rent the hardware and software together.
It should be noted that as a corollary to the expansion of “channels,” more titles can be accommodated; further, this breadth allows for catalog product, making the menu of options parallel that from on-demand carriers. This is a boon to studios that are dependent on catalog churn, and as technology continues to grow the capacity for more product, the ability to license hits/classics as evergreens will expand in parallel fashion.
Finally, although picture quality on personal screens is sharper than tape projected onto a big screen, and headphones have been improved, the viewing experience on airplanes still remains inferior to other traditional viewing platforms. Moreover, as some form of entertainment has become standard on longer flights, certain carriers such as Virgin have installed systems also capable of playing games, and services such as In Motion Video offer in-terminal DVD rentals for viewing on laptops. Access to programming is therefore becoming more of an expectation than an optional item—why should consumers’ expectations and options be less in the air, especially when it is an environment where travellers are accustomed to watching or listening to entertainment?
While the audience is uniquely captive and it should therefore be theoretically possible to charge disproportionate fees, there are both competitive and practical boundaries that have kept pricing to consumers relatively flat. In essence, the improvements in quality, choice, and flexibility have become necessary simply to keep pace with consumer demand and expectations, and there is little premium that trickles down to producers from these platform enhancements. The major changes will come as airlines couple on-demand systems with the ability to pay on an à la carte basis—a complicated way to say offering VOD in-seat. Virgin America, for example, introduced just that, and as more airlines follow suit, revenue will correspondingly grow.
Most airlines want films before the video release, and to some degree match a hotel window: far enough from initial theatrical release that viewing does not materially cannibalize the theatrical run, and before the video release to maintain some measure of quasi-exclusivity. The window is usually short, and can be as short as a couple of months. The squeezing of this window parallels the discussion regarding the historical VOD window. As a true ancillary, the window will be dependent upon the proportion of revenue driven relative to the revenue from juxtaposed windows.
Even today, license fees can still be structured in what seems a bit of an archaic manner: flat fees per film per flight. While general pricing has been relatively flat for years, differential pricing has evolved where there may be a charge for the main screen plus an incremental amount per flight for the on-demand systems. Fees overall can reach a reasonable number because licenses are usually nonexclusive; accordingly, while the price per film/flight may be relatively low, there is a significant multiplier effect (multiplied by number of flights, and then multiplied by number of airlines). Nevertheless, the ultimate revenues are not likely to approach the multimillion-dollar levels of other revenue streams.
For a studio that is regularly licensing a few films per month to an airline, the relatively small per-film revenues can add up over time. Airlines are thus another classic “ancillary,” for even though the revenue is small and incremental, it is still significant enough to maintain and exploit the niche. What is slowly changing, and will ultimately make the traditional pricing extinct, is broadly implementing in-seat VOD offerings. When you can select a film and pay by credit card, such as on Virgin America, then the model should naturally shift to a revenue-share scheme akin to models utilized historically in hotel/motel PPV. Even with this major shift in pricing and access, the inherent capacity barrier remains, and airlines will still only be a piece of the overall ancillary basket of revenues.
Non-theatrical rights refer generally to the projecting of a movie onscreen to an audience in a venue other than a movie theater. The easiest frame of reference for most people is a college film night: remember the film club or society that would show movies in a hall on Saturday night using an old 16 mm projector? Although it is no longer common to project a 16 mm print, exhibiting prints at universities remains a source of revenue for non-theatrical business. Other common outlets are ships at sea, libraries, and prisons.
Non-theatrical rights have historically been exploited in the period just before home video, trying to take advantage of the hiatus between theatrical and home video exploitation. This is especially true in the fall when summer movies have had their run, the films are being readied for the big fourth-quarter video push, and colleges are back in session. To some, this is the ultimate time for film clubs to show the hot movies from the past summer.
Beyond this narrow window, non-theatrical rights are often exploited ad hoc, such as when a specific institution requests a one-off screening of a picture. There are niche distributors who specialize in booking movies in this market (sometimes offering classics, which can often involve the body of work of individual directors), and work with a network/circuit of outlets such as bicycling to various universities. The tail of the window is therefore somewhat indefinite: non-theatrical exhibitions/licenses can arise 10 or 20-plus years after a release, and the availability is only limited by whether the picture continues to be in demand.
Non-theatrical exploitation does not yield much revenue relative to other exploitation outlets. Perhaps more than the money, this distribution outlet recognizes that films are an art form that are in demand, and this avenue helps ensure that films can reach the widest possible audience. In essence, this fulfills a niche satisfying additional demand, almost for the sake of satisfying demand as an end, over and above pure economic concerns.
To the extent revenues are generated, the model is usually for the niche distributor to charge a distribution fee based on the revenues generated. In the university circuit, the splits are a bit like theatrical, with the caveat that there is usually a single tier rather than a sliding scale. Accordingly, a non-theatrical split is likely to be straightforward (e.g., 50/50); of course, in some cases there can be different deals cut and guarantees paid, but the market is small enough and the distribution specialized/targeted enough that negotiations at the margins take a backseat to securing quality distribution in the channel. Outside of universities (e.g., to prisons), I admit to having no idea how revenues are truly calculated, nor do I probably want to know! (Although my assumption is that the deal is a similar simple split.) Most licensors are simply happy to know that they are exploiting this additional channel, focus on the breadth of distribution to universities (and perhaps ships at sea), and have an overall number they target based on comparable films and rentals.
Online Impact
■ The online world is not so much changing the notion of product merchandising, but rather the range of merchandise offered and the outlets available to acquire product.
■ Avatars, which are now popular surrogates for your own persona (e.g., for instant messaging, on social networking sites, in apps on tablets), and their accessories are an example of digital merchandise (e.g., users can buy digital merchandise, such as weapons or clothes, for their digital character).
■ Toys come with codes to unlock Web-based virtual worlds.
■ Apps are enabling a new launch platform, where popular content/games (e.g. Angry Birds) can spawn merchandising programs (and reach) rivalling TV/film branded content.
■ Video games are frequently being created in downloadable form and networked such as via Xbox Live; moreover, social games have shown the power of data analytics in marketing, and taken monetizing virtual goods to a whole new level.
■ Film and TV websites and social media pages often combine or link to e-commerce applications, with on-demand manufacturing, coupled with online access, enabling personalization of product merchandise.
■ Secondary markets, such as for collectibles, have grown exponentially with online marketplaces, such as eBay.
■ Successful franchises can support transmedia-like story extensions, with books, games, and apps taking characters and worlds in different directions, all grounded in the property’s core themes/iconography.
■ Ringtones (e.g., theme music) are just one example of translating film and video elements into digital merchandising bits.
■ PPV has now given way to VOD, which, beyond becoming the new face of video rental, is now expanding access points (e.g., tablets) and altering the dynamics of multiple ancillary markets (e.g., hotel/motel, airlines); additionally, VOD itself is diversifying, with both cable VOD and OTT VOD experiencing some of the most significant growth rates of any media sector.