
Identifying the Critical Path
Adding Recurring Tasks and Using Task Calendars
Managing Resource Workloads and Resolving Resource Over-allocations
Setting the Project Baseline
Communicating the Project Plan (Introduction)
Optimizing the Plan Review Exercise
 Learning Objectives for This Chapter
Understand and identify the project’s critical path
Use the appropriate views to analyze the critical path
Set up recurring tasks
Define and use task calendars
Review resource workloads and resolve resource over-allocations
View, set, and clear the project baseline and know how to set multiple baselines (interim plans)
Take a picture of the project Gantt Chart
9.1 Completing the Plan
The planning steps covered up to this point will help you produce a reasonable first draft of the project plan, but it’s generally necessary to refine the plan before the project actually begins. Several of the steps may be repeated as the plan is optimized—resources may be added to meet the target end date, estimates may be adjusted as resource skills or roles are converted to real names, new tasks may be discovered as details are filled in, links may change to accommodate other schedule constraints, and assignments may shift to load level the plan. Each of these changes can force the project manager to repeat the steps of planning until a realistic plan is built—a process so common that PMI refers to this progressive elaboration as a fundamental defining characteristic of a project.
The work plan and schedule are not optimized until the scope, schedule, and resources have been configured to meet the project objectives.
9.2 Identifying the Critical Path
Network Diagram
The critical path is defined as the series of tasks that must be completed on schedule in order for a project to finish on schedule. Each task on the critical path is called a critical task. Tasks that are on the critical path have the minimum level of slack (usually 0 days). In other words, the task can be delayed for 0 days before it will delay the finish date of the project.
In the following exercise, we will explore how we can modify the Gantt Chart view to see which tasks are on the critical path in a project.
- 1.Go to File:Options to view the Project Options dialog box, and then click Advanced in the sidebar. Scroll to the bottom and note the Tasks are critical if slack is less than or equal to option. Ensure this is set to 0 days and click OK.
 Figure 9-1
Project Options dialog box
- 2.As explained in Note 3 of the “Selecting a View” sub-section of Section 3.5, “Finding the Right Information,” apply the Schedule table to see the total slack for the tasks in this project. To do so, from View:Data, click the Tables dropdown list and select Schedule. Note that the last column shows the total slack for each task.
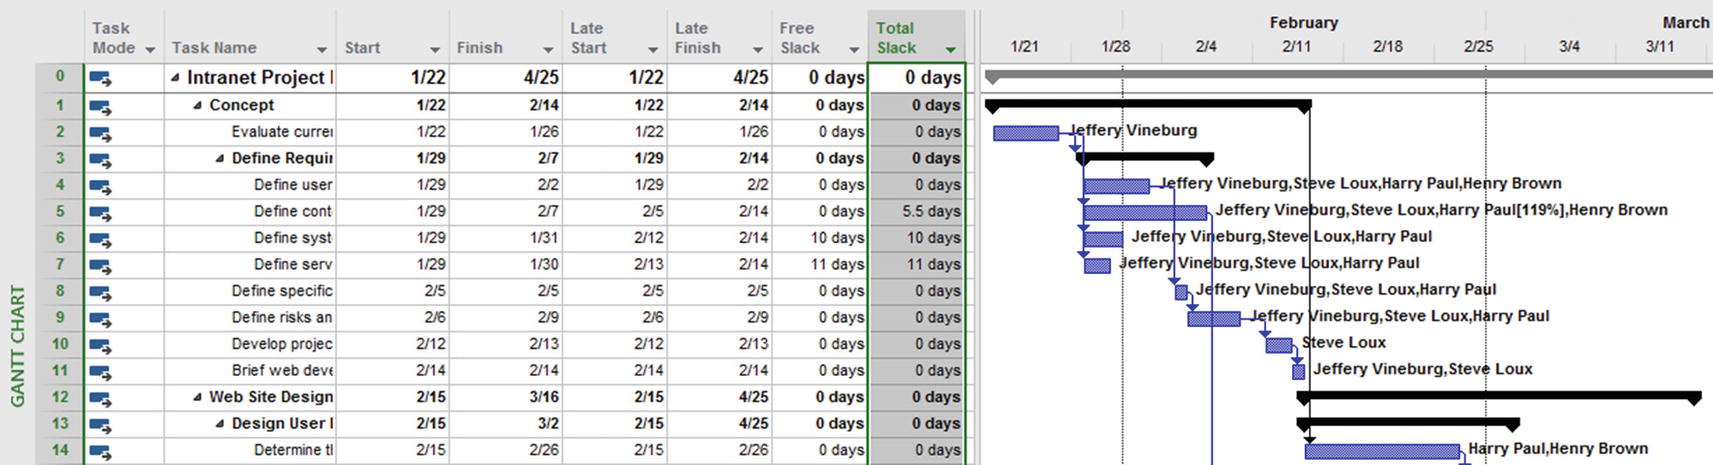 Figure 9-2
Total slack calculation that defines the critical path
- 3.From View:Data, select Critical from the Filter dropdown list. Only critical tasks in your project will now appear. Note: Look at the ID numbers of these tasks to see that not all tasks are displayed.
 Figure 9-3
Identifying the critical path using the Critical filter
- 4.The Network Diagram view displays a node for tasks, along with schedule information and connecting arrows to show the relationship and sequence of activities. To see this view, from View:Task Views, click the Network Diagram icon [
 ]. Your screen will resemble the following.
 Figure 9-4
Network Diagram view
- 5.
Critical tasks can also be identified in the Gantt Chart. Reapply the Gantt Chart view, remove the Critical filter (so you again see all tasks in the project), and from Format:Bar Styles, select the Critical Tasks checkbox.
Your screen will resemble the following. Figure 9-5
Critical tasks formatted with red bars in the Gantt Chart
- 6.
Scroll through the tasks in the plan to see which tasks appear with red Gantt bars, indicating they are on the critical path. What is the current estimated finish date for the project?
- 7.
Uncheck the Critical Tasks checkbox. Note the total slack for Tasks 5, 6, and 7. Recall that the total slack can be seen by applying the schedule table to the Gantt Chart.
- 8.
Link Task 4 to Task 5. (Task 4 should be the predecessor.) Note the change to the total slack for Task 5.
- 9.
Link Task 5 to Task 6. (Task 5 should be the predecessor.) Note the change to the total slack for Task 6.
- 10.
Link Task 5 to Task 7. (Task 5 should be the predecessor.) Note the change to the total slack for Task 7.
- 11.
Save and close your project.
The critical path is constantly calculated by Microsoft Project and can change as tasks are modified or updated. The Tracking Gantt Chart includes the critical path by default. See the “Viewing Baseline Information” sub-section of Section 9.4, “Managing Resource Workloads and Resolving Resource Over-allocations,” to learn more.
9.3 Adding Recurring Tasks and Using Task Calendars
A recurring task is one that occurs more than once in a project on some kind of regular schedule, for example, a bi-monthly status meeting, a weekly on-site visit, or a monthly report. Once the initial project schedule has been developed, you may want to add these types of tasks to your plan. Microsoft Project 2019 helps you to define and create several tasks with one dialog box for when you want to create a recurring event.
- 1.
Confirm that you are in the Task tab with the Gantt Chart view.
- 2.Select Build Project Plan (Task ID 1), and from Task:Insert, use the Task dropdown list to select Recurring Task. You will be presented with the Recurring Task Information dialog box.
 Figure 9-6
Recurring Task Information dialog box
- 3.
In the Task Name field, type “Status meeting.”
- 4.
In the Duration field, enter “1h.”
- 5.
In the Recurrence pattern section, confirm the (default) Weekly option is selected.
- 6.
In the Recurrence pattern section, select the Monday checkbox.
- 7.
Do not change the Range of recurrence dates. (By default, it’s set from the current project start date to project finish date.)
- 8.
From the Calendar dropdown list, select Standard. This tells Microsoft Project to schedule the meetings according to the working dates in that calendar (the project calendar for this exercise).
- 9.
Click the checkbox for Scheduling ignores resource calendars. This selection will maintain the status meeting schedule without checking against every resource calendar.
- 10.Click the OK button. Your screen will resemble the following.
 Figure 9-7
New recurring task
- 11.
Place your mouse pointer over the new icons in the Information column to see their meaning.
- 12.Ensure the summary task Status meeting is still selected. From Resource:Assignments, click Assign Resources to open the Assign Resources dialog box. Assign Bernie Frazer, David Crawford, George Brody, and Joan Higgins to the summary task. Your screen will resemble the following.
 Figure 9-8
Recurring task assignments
- 13.In the Assign Resources dialog box, click Close. Click the arrow next to the Status meeting summary task to see the summary recurring task.
 Figure 9-9
Summary task for weekly recurring status meetings
Notice that the resources are assigned to all the individual meetings, even though you assigned them to the summary task. Separate resource assignments can also be made to individual recurring tasks, but assigning a core team to the summary task is a quick way to populate the recurring tasks with resources. Recurring tasks are the only summary tasks that show this behavior.
It is always possible to assign resources to summary tasks, but ordinarily this is not recommended since the resources are not automatically assigned to the sub-tasks under the summary task.
- 14.
Click the arrow next to the Status meeting summary task to hide the individual meetings, and save your project.
Adding Occurrences to a Recurring Task and Adding Resource Assignments to Them
![]() This section continues the use of RecurringTask.mpp. Ensure this file is open before beginning, or open RecurringTask_Inst1.mpp.
This section continues the use of RecurringTask.mpp. Ensure this file is open before beginning, or open RecurringTask_Inst1.mpp.
As your project progresses, you may encounter a situation that extends the project end date. In those situations, any recurring tasks that have been used to schedule status reporting, actuals tracking, or team meetings will need additional occurrences added to ensure that they remain active until your project’s new finish date.
- 1.
Double-click Status meeting (Task ID 1) to view the Recurring Task Information dialog box.
- 2.
Select the box for End after…occurrences. Increase the occurrences from “16” to “21” and click OK.
- 3.
Click the arrow to the side of Status meeting to see all of the status meetings, including the four new ones.
Remember that you still need to assign resources to the new meetings. Chances are you will want to assign the same resources to the new tasks as were assigned to the original ones. There are two easy ways to accomplish this:Highlight each of the new occurrences, and use the Resource Assignment dialog box to assign the resources to the new tasks.
Use the Fill Handle to copy the Resource Names column for the new occurrences. We will use this approach in this lesson.
- 4.
From View:Task Views, ensure the Gantt Chart view is selected, and from View:Data, use the Table dropdown list to confirm the Entry Table is applied. Expand the Status meeting summary task by clicking the arrow next to the summary task name. Then, scroll to the last column of the Entry Table called Resource Names, and click the Resource Names column header and drag its column to the left until it is next to the Task Name column.
- 5.Using your mouse pointer, click in the cell of the Resource Names column for the last occurrence that had resources assigned (adjacent to Status meeting 16). Then, use the Fill Handle (the small black square in the lower right-hand corner of the cell) to drag the column down, highlighting all cells for new recurring tasks with no resources assigned.
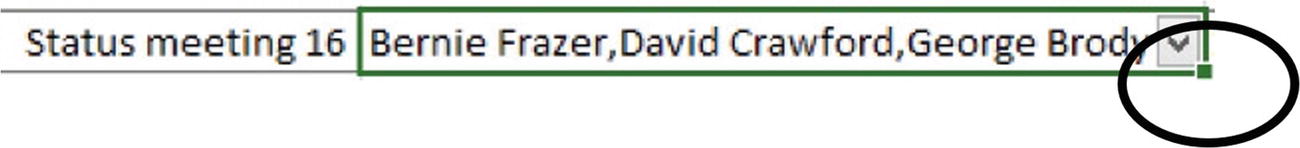 Figure 9-10
Fill Handle
The resource assignments will be copied to the new tasks, and your screen will resemble the following. Figure 9-11
New task assignments
You may have noticed one other result of adding these tasks: the critical path went away! All the tasks that were red have turned blue, meaning they are non-critical. It’s not unusual for Microsoft Project users to complain, “My project has no critical path,” but there is always a critical path somewhere.
- 6.
Use the Go to selected task button (or scroll) to view the Gantt Chart bar for Status meeting 21. Notice anything different about it?
Microsoft Project uses durations and dependencies to calculate the project schedule, but it also uses dependencies to identify paths in a project. All unlinked tasks are considered to be separate, stand-alone paths, and as far as Microsoft Project can tell, Status meeting 21 is the only thing controlling the end date of the project. If you remove the four new status meetings by resetting the number of occurrences to 16, the original critical path will reappear.
What can be learned from this? Don’t underestimate the importance of logical links between tasks, and make sure there are no unlinked tasks after the finish date of the real tasks in the project.
- 7.
Save and close your project.
9.4 Managing Resource Workloads and Resolving Resource Over-allocations
Resources are the people, equipment, and materials (and sometimes money) essential to the completion of tasks. Resource assignment allows you to indicate which people and/or things are necessary for which tasks. Microsoft Project 2019 allows you to create a project schedule with or without assigning resources to individual tasks, but assigning resources is a critical feature for enterprise project management.
It’s a good idea to check availability before assigning people to tasks, but in the process of assigning people to project tasks, it is easy to assign them to more hours than they have available on a given day—this is known as over-allocation. It’s especially easy to over-allocate people when they are working on multiple projects with multiple project managers who may not be aware of each other’s plans. This is one of the valuable features of the resource pool approach discussed in Section 10.3, “Enterprise Resource Management.”
What can an individual project manager do about over-allocations within his/her own project?
Viewing Resource Workloads and Task Assignments
Microsoft Project 2019 doesn’t stop you from over-allocating a resource, but it does enable you to identify over-allocations and under-allocations. When a resource is over-allocated, Resource views display the resource name in bold, red text with a Leveling indicator [![]() ]. Microsoft Project considers a resource over-allocated if that resource is assigned to more than 8 hours of work on any given day in the project (assuming 100% maximum units and 8 hours per working day).
]. Microsoft Project considers a resource over-allocated if that resource is assigned to more than 8 hours of work on any given day in the project (assuming 100% maximum units and 8 hours per working day).
- 1.From Task:View, select the Resource Usage view. Your screen will resemble the following (you may need to click the first task below John Tierney and click the Scroll to Task icon to get this exact view).
 Figure 9-12
Resource Usage view
- 2.
Select the resource George Brody (ID 4). Note that his name is displayed in bold, red text to indicate his over-allocation. Move your mouse pointer over the icon in George Brody’s Indicators column to read the over-allocation message.
- 3.
From View:Split View, click Details, and from the dropdown list, select More Views…. In the More Views dialog box, select Resource Allocation and click Apply. You may also want to zoom out to a weekly or monthly view (View:Zoom:Timescale dropdown).
- 4.All of George Brody’s task assignments will appear in the bottom pane, the Leveling Gantt view. Select George’s name in the upper pane, and in Task:Editing, click Scroll to Task to see George’s first set of tasks.
 Figure 9-13
Resource Allocation view
Notice that on the week of 9/24 George is scheduled to do 72 hours’ work—flagged as an over-allocation—and the week of 10/8 is not much better.
- 5.
With George Brody selected in the top pane, click the Next Overallocation button [
 ] (found in Resource:Level). This button will move you down the resource list and across the timescale into the future to help you locate individual over-allocations.
 - 6.Again, select George Brody and click Scroll to Task to return to the week of 9/24 (current year). Inspection of the bottom frame reveals the problem. As you can see, George has two tasks scheduled simultaneously on that week, one at 32 hours and another at 40 hours.
 Figure 9-14
George’s over-allocation on 9/24
The Leveling Gantt in the bottom pane displays all the tasks the selected resource in the top pane is assigned to. All tasks are displayed with blue Gantt bars, and a task’s slack is represented as a thin line to the right of the task bar. If you click a different resource in the upper pane, all of the tasks assigned to that resource will be displayed in the bottom pane.
- 7.
Save your project.
Resolving Resource Over-allocations
Microsoft Project 2019 provides an automatic resource leveling function that can help deal with these problems.
However, this function may not entirely resolve the over-allocations in your project and may lead to schedule changes you do not want. This tool is very powerful but quite often misunderstood. It is not a magic button; automatic leveling can only resolve resource over-allocations by delaying tasks in the plan until a resource is no longer over-allocated. For example, if a resource is scheduled to work on two tasks today for a total of 16 hours, the automatic leveling function would delay the second task until tomorrow to resolve the over-allocation. That is not always realistic.
Resource leveling can also accelerate scheduled work if resources have early availability.
- 1.
What is the current finish date for this project? (See the finish date of the project summary task, Task 0.)
- 2.From Resource:Level, click the Leveling Options icon [
 ]. You will be presented with the Resource Leveling dialog box.
 Figure 9-15
Resource Leveling dialog box
Although the leveling function in Microsoft Project can be set to Automatic, the result is that Microsoft Project continuously recalculates and reschedules every task every time a resource becomes over-allocated by any amount of time! Using the default Manual setting allows you to control when and how Microsoft Project applies the leveling calculations.
Note that the leveling options enable you to resolve over-allocations by evaluating a specified time period. The time periods that Microsoft Project can evaluate areMinute by Minute
Hour by Hour
Day by Day
Week by Week
Month by Month
By specifying a block of time in which to look for over-allocations, Microsoft Project evaluates the selected block of time before it performs leveling calculations. Resources are considered over-allocated and will be leveled if the total assigned work exceeds the total work hours for the selected block of time.
For example, if a resource has two 8-hour tasks scheduled to begin at 8:00 AM on the same day, and you choose to look for over-allocations on a day-by-day basis, one task will be delayed until the next day so that there is no over-allocation on the first day. If, however, you choose to look for over-allocations on a week-by-week basis, the scheduled tasks will not be affected because they do not exceed the amount of work the resource can perform in a week (typically 40 hours, as set in File:Options:Schedule).
- 3.
In the Resource Leveling dialog box, accept the option to look for resource over-allocations on a Day by Day basis. Note that the Level only within available slack box is not checked by default, so Microsoft Project is set up to level critical tasks as well. Now click the Level All button.
- 4.
Did the leveling resolve the resource over-allocations? What is the new estimated project finish date?
- 5.
From Resource:Level, click Clear leveling.
- 6.Once again, from Resource:Level, select Leveling Options, but this time select Level only within available slack in the Resource Leveling dialog box before clicking Level All. When you receive the alert shown in the following figure, it is generally best to stop leveling, resolve the issue, and then level again. For our exercise, however, click Skip All.
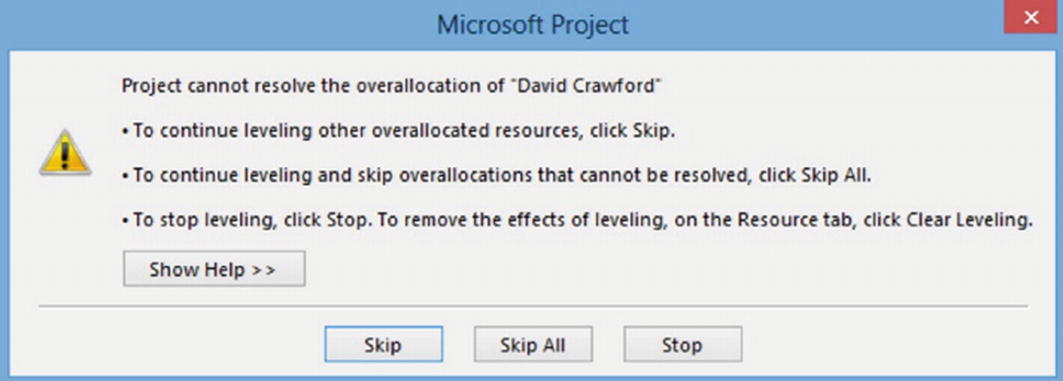 Figure 9-16
Resource leveling alert
- 7.
Did the leveling resolve the resource over-allocations? What is the project finish date?
The resource leveling function is often used as a negotiating tool. You can present both options for a management decision—“With the resource currently assigned I can complete the project by this date: ____, while with additional resources, I can complete it on this date: ____.” For example, when you leveled without changing the finish date (Level only within available slack), George Brody’s over-allocation couldn’t be completely fixed. If you scroll through the view, you’ll see that from October 3 to 9 George is still over-allocated. The Leveling Gantt shows why; George has two tasks that can’t be moved: Determine current architecture and Assess processes on the server because Determine current architecture is a critical task. It’s much more convincing to be able to say—and show—“I need someone who could replace George on Assess processes on the server beginning October 3.”
As it happens, Ted Haley is available and has the skills necessary for this task.
- 8.Clicking Level All will also level all resources without opening the Resource Options dialog box (by using the current Leveling options that are already preset). To level a specific resource, from Resource:Level, click the Level Resource icon. Then, from the Level Resource dialog box, select the desired resource and click Level Now.
 Figure 9-17
Using the Level Resources dialog box to level George Brody’s assignments
- 9.
Once you review your results, click Clear Leveling.
- 10.Now display the Resource Usage view in full-screen mode (i.e., remove the lower pane view). Click to select the assignment Assess processes on the server under George Brody and drag it downward until it moves to Ted Haley. You will need to collapse the assignments for David Crawford, Joan Higgins, Mike Goren, and Julie Pawlkowski so you can see Ted Haley’s assignments. During the move, your screen will resemble the following.
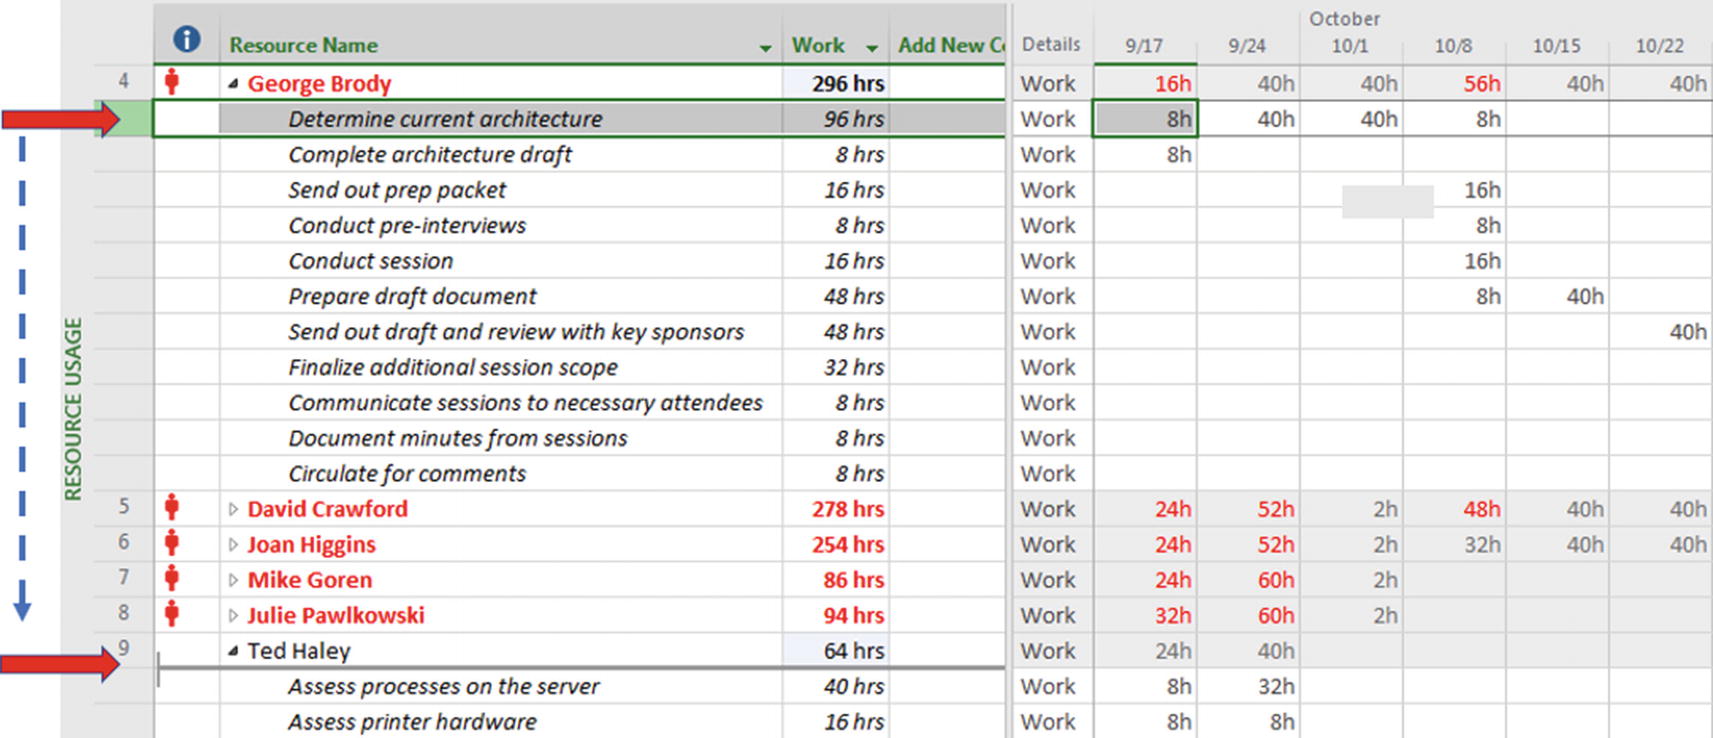 Figure 9-18
Collapsing assignments
- 11.
Save your project.
It is not uncommon for automatic leveling to fail to resolve all resource over-allocations or results in unacceptable schedule changes. In these cases, you will need to resolve the resource conflicts manually so that you can dictate where and how adjustments are made. We will review a technique that we call “task leveling” later in this section.
The following techniques can be used to resolve resource over-allocations:Increase the maximum units of the resource.
Reschedule the task that has created the over-allocation.
Add overtime.
Adjust task dependencies or constraints.
Remove the resource if it isn’t mandatory to the task.
Replace the over-allocated resource with an under-allocated resource.
Make calendar adjustments to extend the working days and hours for the project or resource.
Decrease the amount of work assigned to the resource.
Of course some of these options are more practical than others. The two most commonly used methods are rescheduling the work and replacing the resource. Of these, at this point in the course, Microsoft Project can realistically only use one: reschedule the task that has created the over-allocation.
All other options require human judgment and communication and negotiation. Microsoft Project’s real value is in allowing the project manager to easily find where schedule impossibilities exist.
If Microsoft Project gave us the ability to view allocations across all projects the resource was assigned to, it could help eliminate the multiple scheduling problems that lead to many over-allocations. Fortunately, Microsoft Project does provide us with that capability, as we’ll see shortly.
Task Leveling vs. Resource Leveling
When building your project plan and assigning resources to it, one way to avoid resource over-allocation is to ensure that resources are available as they are assigned to a task. This technique is referred to as task leveling.
In this exercise we will build a view that allows you to see resource allocation to a task in relationship to all other tasks to which that resource is assigned.
- 1.From View:Resource Views, click the Other Views dropdown list and select More Views. In the More Views dialog box, click New. You will see the Define New View dialog box.
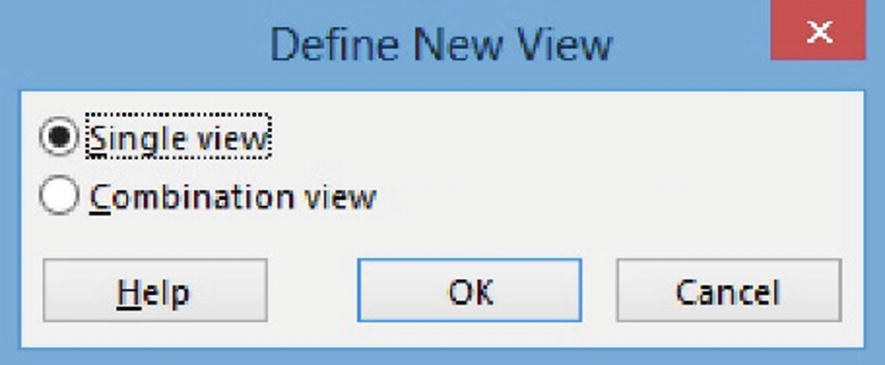 Figure 9-19
Define New View dialog box
- 2.Select the Combination view option and click OK to see the View Definition dialog box for the project.
 Figure 9-20
View Definition dialog box
- 3.
Type “My Task Leveling” in the Name field. From the Primary View dropdown, select Task Usage. From the Details Pane dropdown, select Resource Usage. Ensure the Show in menu option is selected and click OK. When the More Views dialog box again appears, click Apply. Your new view will appear on the screen.
- 4.In the upper pane, select the task Determine current architecture (Task 8).
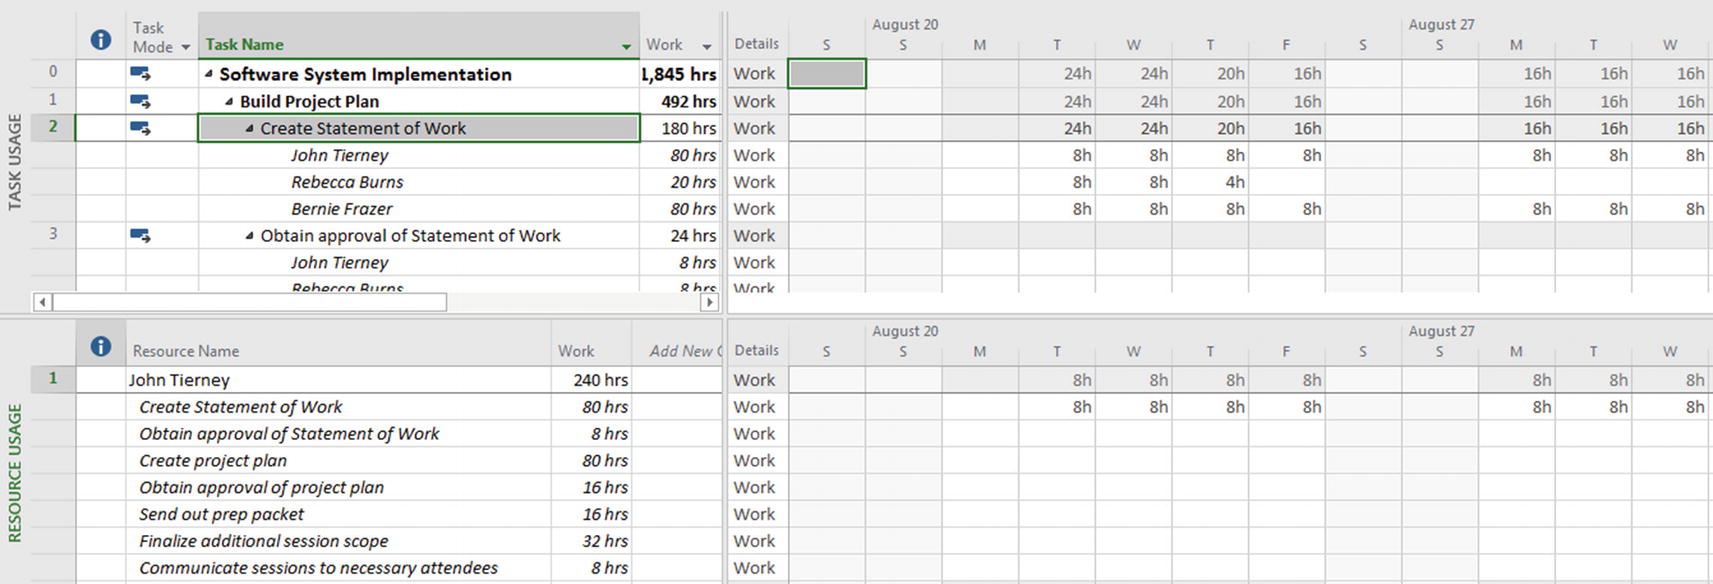 Figure 9-21
My Task Leveling view
- 5.
In the upper pane, under Determine current architecture, select George Brody. Note that all tasks to which George is assigned are displayed in the lower pane.
- 6.
In the upper pane, click on David Crawford. Note that all tasks to which David is assigned are displayed in the lower pane.
- 7.
Click on Joan Higgins. Note that all tasks to which Joan is assigned are displayed in the lower pane.
- 8.
Click on Mike Goren. Note that all tasks to which Mike is assigned are displayed in the lower pane.
- 9.
Save and close your project.
This view can be used to identify resource over-allocations within a single task as well as across all other tasks. In order to resolve over-allocations, you can use the resource assignment techniques outlined earlier in this section to manually adjust resource assignments.
9.5 Setting the Project Baseline
The project baseline represents your expectations for the project. When you track actual project progress, you can use the baseline to compare your original plan for the project with the actual results—which tasks started earlier or later than planned, exceeded their original budget, took longer than planned, and so on. You may be able to use this information to prevent problems on future projects and make better time and budget estimates.
After you finish building your plan, but before you begin to execute it, you are ready to set a baseline. After you save a baseline plan and begin updating your schedule, you may want to periodically save an interim plan, a snapshot of the evolving project plan at a time of your choice. For example, on a project lasting longer than a year, you might decide to save an interim plan on a quarterly basis, either for your own information or for reporting purposes. You can save up to ten (10) interim plans for each schedule. Since interim plans contain start and finish dates only, they help you to compare changes in the scheduled dates of tasks, useful for analyzing the accuracy of your scheduling estimates and for determining when your schedule began to get off track.

Before baselining

After baselining
Applying the Baseline Table
![]() This exercise uses the file SetBaseline.mpp. Be sure this project is open before beginning.
This exercise uses the file SetBaseline.mpp. Be sure this project is open before beginning.
- 1.
From View:Data, use the Tables dropdown arrow to select More Tables.
- 2.From the More Tables dialog box, click Baseline and then Apply. Your screen will resemble the following.
 Figure 9-24
Baseline Table applied prior to setting the initial baseline
The baseline fields for the project plan displayed in the preceding figure reflect the uninitiated values that we would expect to see when a project has not yet been baselined.
Setting the Project Baseline
- 1.From Project:Schedule, click the Set Baseline icon [
 ] and choose Set Baseline…. You will be presented with the following dialog box.
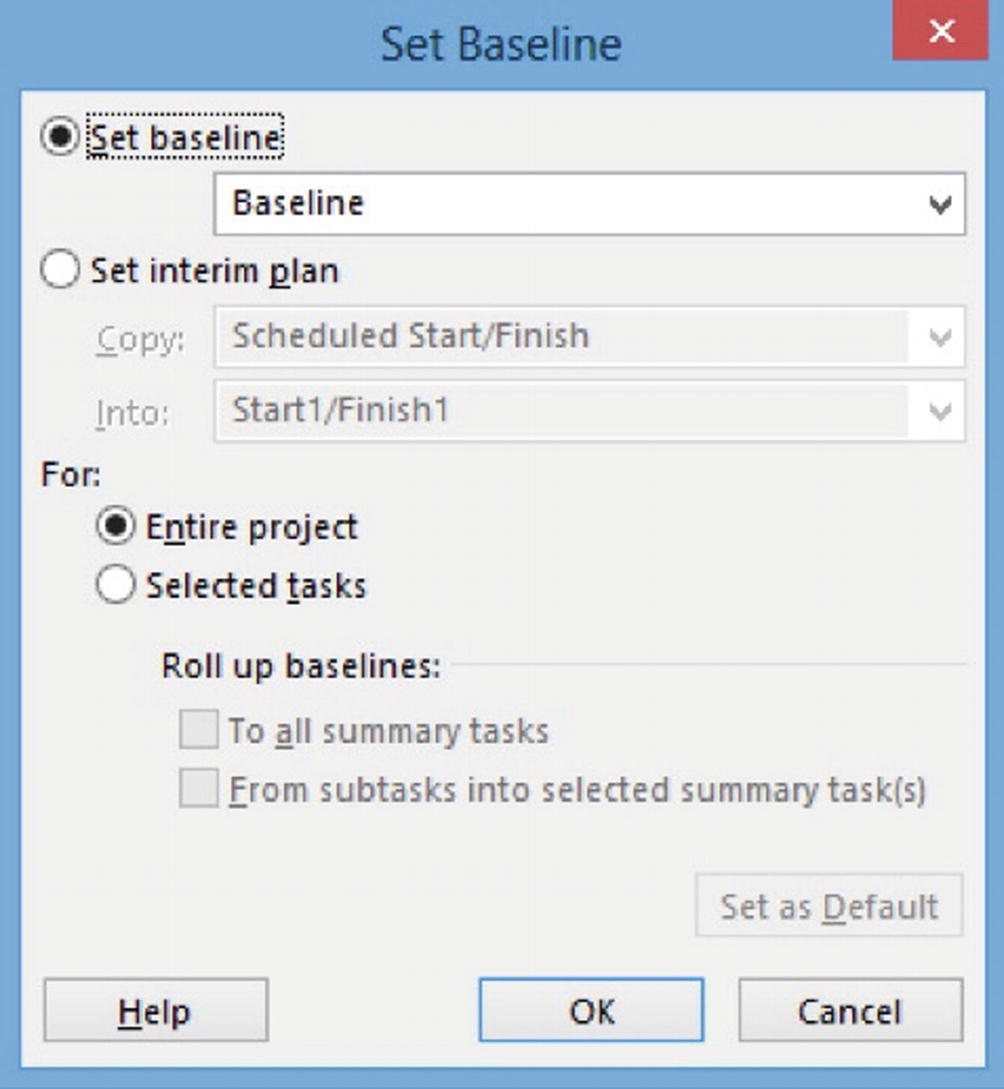 Figure 9-25
Set Baseline dialog box
- 2.Ensure that both the default Set Baseline button and the default Entire project options are selected, and click OK. Your screen will resemble the following.
 Figure 9-26
Results of setting a new baseline
Note that the baseline values have been updated to reflect the values of the current estimated fields.
- 3.
Save your project.
Viewing Baseline Information
By default, Microsoft Project does not include the baseline data in the Gantt Chart view. However, you do have several options to view and use baseline information.
![]() This exercise continues to use the file SetBaseline.mpp. Be sure this project is open before beginning, or open SetBaseline_Inst1.mpp.
This exercise continues to use the file SetBaseline.mpp. Be sure this project is open before beginning, or open SetBaseline_Inst1.mpp.
- 1.
From Project:Properties, click the Project Information icon to access the Project Information dialog box.
- 2.Click the Statistics button. You will be presented with the following dialog.
 Figure 9-27
Project Statistics for SetBaseline.mpp
- 3.
Click Close.
Another common method of looking at baseline data for the schedule is to apply the Variance Table to your project.
- 4.
Make sure you are in the Gantt Chart view. From View:Data, click the Tables icon.
- 5.From the list of available tables, select Variance. Your screen will resemble the following.
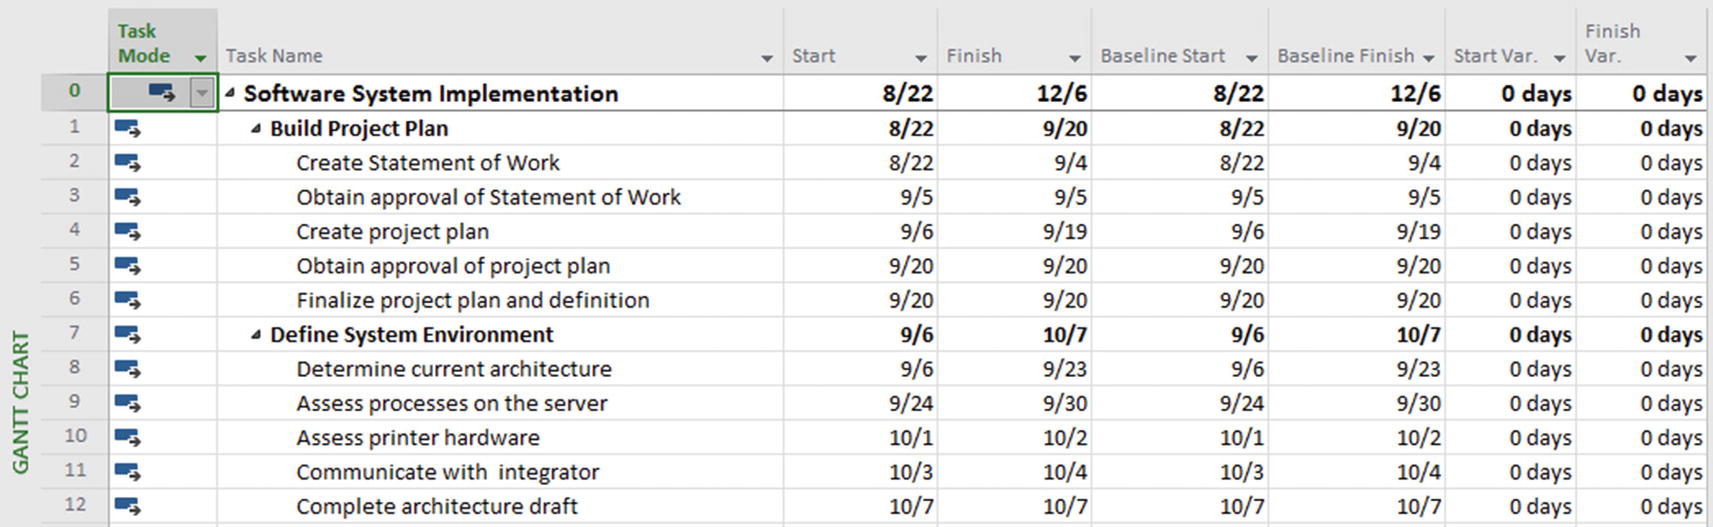 Figure 9-28
Variance Table applied, showing the schedule baseline dates
Note that variance values (start variance and finish variance) are set to zero immediately after setting the baseline. We will cover this topic in greater detail in Section 14.1, “Variance Analysis.”
By default, the Gantt Chart provides a visual display of planned tasks and their assigned resources. The Tracking Gantt displays baseline data along with the current plan and actual results.
- 6.From View:Task Views, click the Gantt Chart icon dropdown and select Tracking Gantt. Your screen will resemble the following.
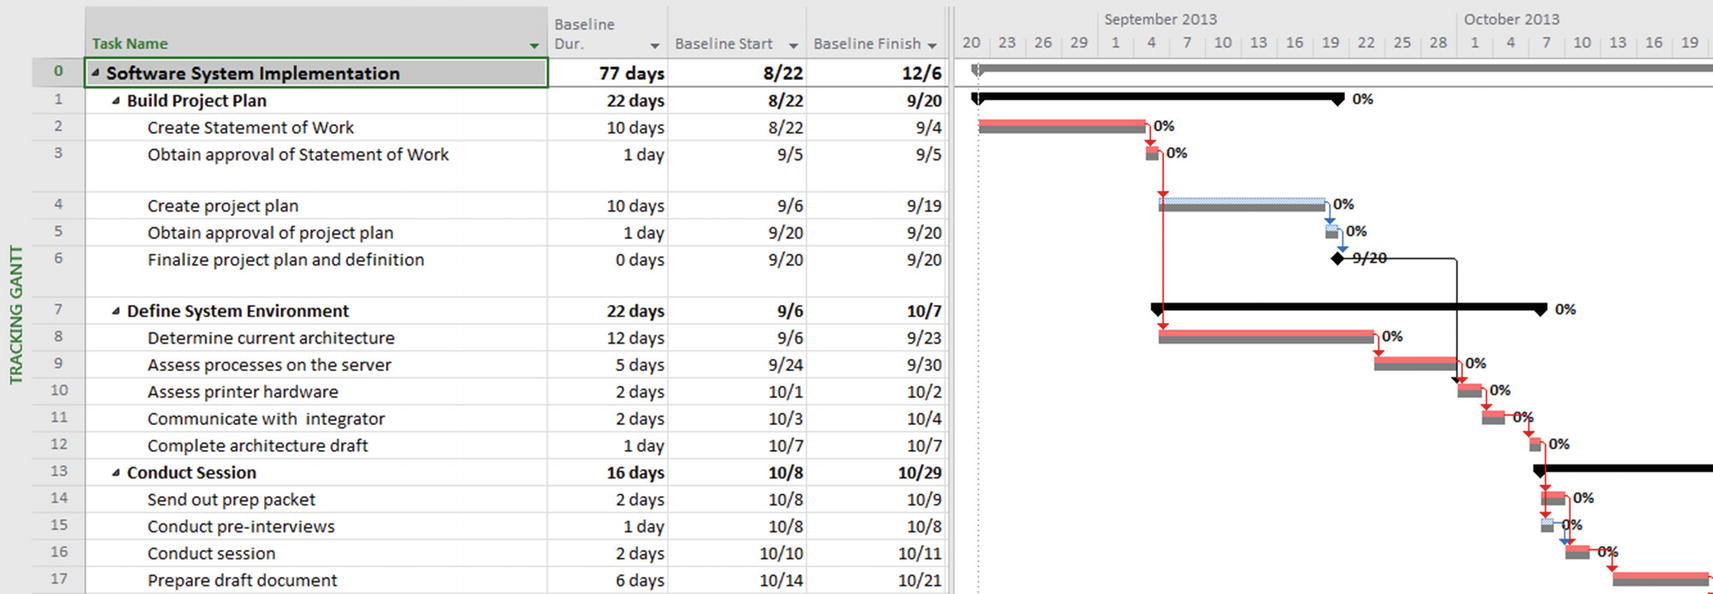 Figure 9-29
Tracking Gantt view with a weekly timescale
The gray bars represent the baseline plan, while the red and blue bars represent the critical and non-critical tasks in the current plan. As the plan evolves during the project, the red and blue bars will move; the gray bars will remain unchanged.
- 7.
Save your project.
Multiple Baselines
Microsoft Project 2019 includes a multiple baseline feature, which allows you to save all baseline fields up to a total of eleven (11) times for each project. The Save Baseline dialog box has a dropdown list for each of the eleven baselines, and the Clear Baseline dialog box has the same dropdown list. When a baseline is saved, a date stamp is also stored with the baseline and is displayed in the dialog box for future reference.

Date-stamped baseline with ten additional baselines

Roll up baseline options
These multiple baseline fields also let you choose which baseline you want to use in earned value calculations. The selection is made in File:Options:Advanced under Earned Value options for this project. The Baseline for Earned Value calculation option in this section allows you to choose which baseline should be used in calculations.
Capturing Interim Plans
- 1.
From Project:Schedule, click the Set Baseline icon and select Set Baseline…. You will be presented with the Set Baseline dialog box.
- 2.Select the Set interim plan option button. Your dialog box will resemble the following.
 Figure 9-32
Set interim plan option selected
- 3.
Accept the default Entire project option and click OK. The Start and Finish values for the current plan tasks will be copied into the Start1 and Finish1 fields. Your interim plan is set. These fields can be used as the parameters for a new bar with a different appearance if you want to show the snapshot on the Gantt Chart for reporting purposes. We will describe how to do this in Section 15.1, “Communication Options.”
- 4.Open the Set Baseline dialog box again and click the dropdown arrow on the Copy selector. Your dialog box will resemble the following.
 Figure 9-33
Set interim plan:Copy
These options allow you to move one baseline to another or convert a baseline to an interim plan. Baselines contain a complete set of project data fields, including start and finish, duration, work, and cost. Interim plans, on the other hand, contain only start and finish dates for the tasks in the plan.
Also, selected tasks can be saved into a specified baseline. This technique can be used to support rolling wave planning, where detailed plans are constructed only for a limited time span.
- 5.
Click Cancel to close the Set Baseline dialog box.
Clearing a Baseline
- 1.From Project:Schedule, click the Set Baseline icon and choose Clear Baseline. You will be presented with the following dialog box.
 Figure 9-34
Clear Baseline dialog box
- 2.
Accept the default Clear baseline plan option button selection.
- 3.
Accept the default Entire project option button selection.
- 4.Click OK. Your baseline is cleared.
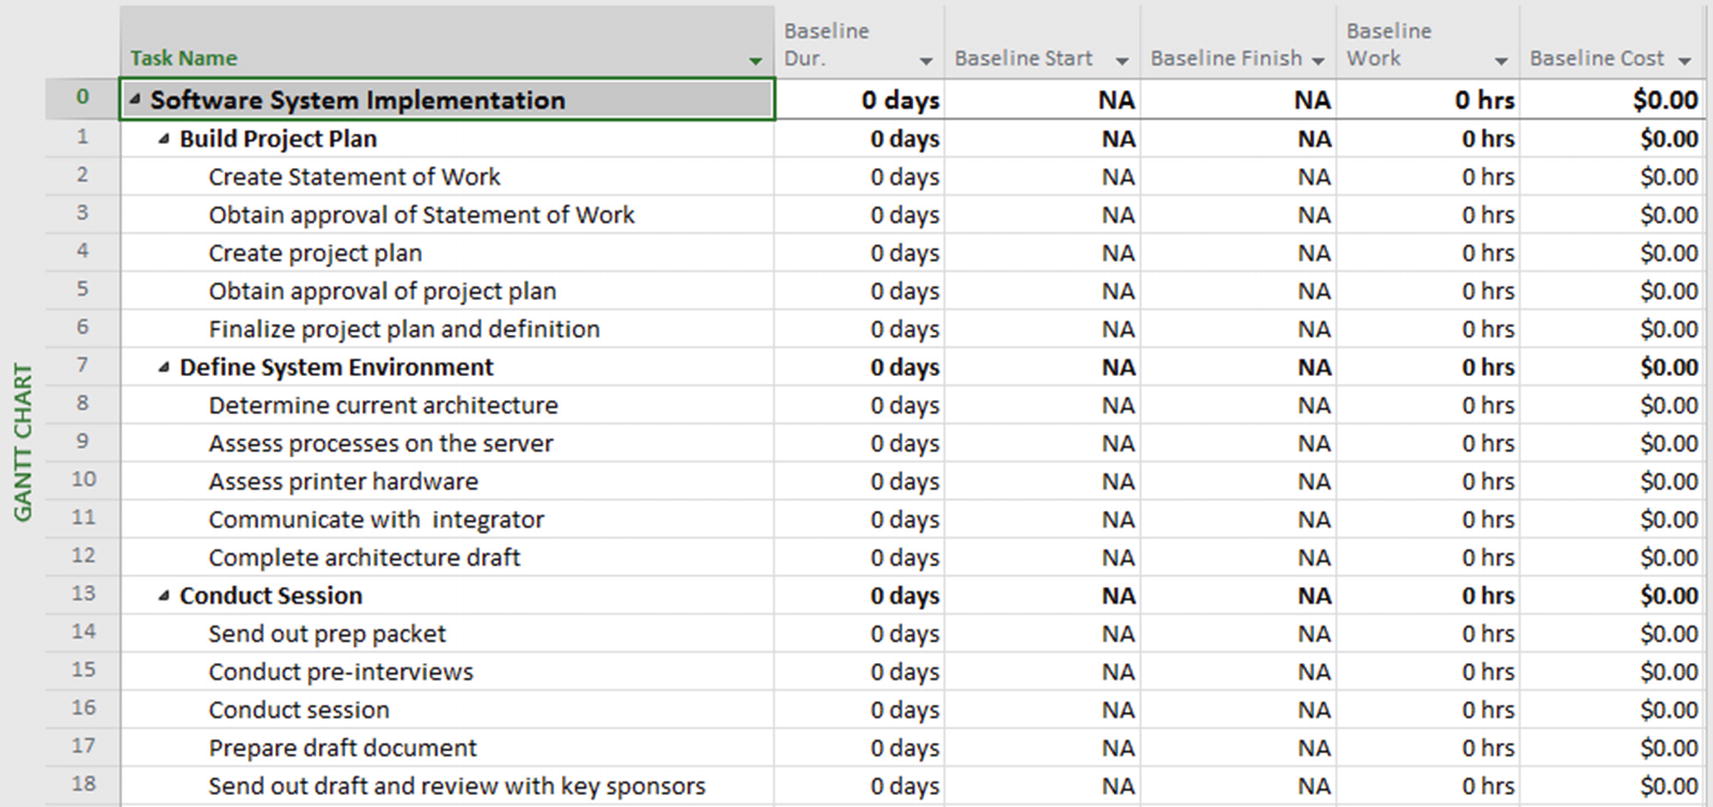 Figure 9-35
Cleared baseline
- 5.
Save and close your project.
Protect-Saved Baselines
In Microsoft Project 2019, Project Server administrators have the option to lock down a user’s ability to save baselines. Once an agreed-upon baseline has been reached, an organization can prevent a project manager from changing that baseline. This feature is invoked and controlled via the Global Permissions setting for each group (or in the security template for each group). Note: Global Permissions settings are controlled through Project Web App by a Project Server administrator.
9.6 Communicating the Project Plan (Introduction)
Because communication management is a critical part of the project management process, Microsoft Project 2019 includes a variety of tools to support communication with internal and external clients. This section documents a method of sharing a project plan with team members or clients who do not have Microsoft Project.
Taking a Picture of Your Gantt Chart
One way to use the communication power of the Gantt Chart view is to photograph it and send the picture as part of another document (e.g., e-mail, web page, PowerPoint).
- 1.From Task:Clipboard, click the Copy dropdown and select Copy Picture. You will be presented with the Copy Picture dialog box. This tool allows you to make a copy of the task or resource information that is currently visible (without the ribbon or any surrounding control). This copy can then be pasted or inserted into another application.
 Figure 9-36
Copy Picture dialog box
- 2.
The Render image:For screen option copies the Microsoft Project view as an image with a resolution best for viewing on a screen, such as in PowerPoint. Render image:For printer copies in a resolution best for printing. Render image:To GIF image file saves the image as a separate picture file, which can be manipulated in a variety of ways or e-mailed as an attachment.
- 3.
In the Render image area of the dialog box, click For printer.
- 4.
In the Copy area of the dialog box, check Selected rows.
- 5.
In the Timescale area of the dialog box, select As shown on screen.
- 6.
Click OK. Except for a brief appearance of the hourglass icon, nothing appears to happen.
- 7.
Launch Microsoft Word and open a blank document. In the new Word document that appears, select Edit:Paste (or use “Ctrl+V”). A picture of your Gantt Chart will be inserted into your Word document.
- 8.
Exit Word, discarding the new document. Save and close your project.
9.7 Optimizing the Plan Review Exercise
- 1.
Open the file PlanOptimization.mpp.
- 2.
Display critical path information using the Gantt Chart.
- 3.
Apply the Resource Allocation view.
- 4.
Select Julie Pawlkowski. In which month is Julie over-allocated?
- 5.
What is the current finish date for the project?
- 6.
Try to resource level Julie Pawlkowski within the available slack.
- 7.
Did this resolve the over-allocation for Julie?
- 8.
What about the other resources?
- 9.
Did the project finish date change?
- 10.
Apply the Gantt Chart view.
- 11.
Insert a weekly task, Review plan and make adjustments, to occur every Thursday with a duration of one hour, starting after the Task 6 milestone and repeating to the end of the project.
- 12.
Set and display a baseline for the project.
- 13.
Save and close your project.
 End of Chapter Quiz Questions
- 1.
Fill in the blank: The work plan and schedule are not optimized until the ________, ________, and ________ have been configured to meet the project objectives.

- 2.
What is the critical path and what are critical tasks?
- 3.Which of the following does the Network Diagram view display?
- a.
Tasks
- b.
Schedule information
- c.
Connecting arrows displaying relationship and sequence of activities
- d.
All of the above
- a.
- 4.
How do you create a recurring task?

- 5.
Is it possible to assign resources to summary tasks? Is it recommended?

- 6.
What is over-allocation?
___________________________________________________________
- 7.
True or False: Microsoft Project 2019 stops you from over-allocating a resource.
- 8.
When does Microsoft Project 2019 consider a resource over-allocated?

- 9.
What does the Leveling Gantt view display?

- 10.
How does the automatic resource leveling function provided by Microsoft Project 2019 help deal with resource allocation problems?

- 11.
Fill in the blank: Resources are considered over-allocated and will be leveled if the total assigned work exceeds the total ________ ________ for the selected block of time.
- 12.
What can you do if automatic leveling cannot resolve the over-allocation or if it results in unacceptable schedule changes?
___________________________________________________________
- 13.What are some techniques that can be used to resolve resource over-allocations manually (select five)?
Increase the maximum units of the resource.
Reschedule the task that has created the over-allocation.
Add overtime.
Adjust task dependencies or constraints.
Remove the resource if it isn’t mandatory to the task.
Replace the over-allocated resource with an under-allocated resource.
Make calendar adjustments to extend the working days and hours for the project or resource.
Decrease the amount of work assigned to the resource.
- 14.
What is task leveling?

- 15.
How do you create a new Resource view?

- 16.
What is the project baseline and what can it be used for?

- 17.
When should you baseline?
___________________________________________________________
- 18.
Up to how many interim plans can you save? ___________
- 19.
Fill in the blank: Baselining refers to the concept of capturing the ________ estimate for your project.
- 20.
How do you apply the Baseline Table in Microsoft Project 2019?
___________________________________________________________
- 21.
How do you set the project baseline?

- 22.
How can you see a statistical summary of your project information?

- 23.
Which view displays baseline data along with the current plan and actual results?
___________________________________________________________
- 24.
How many baselines can be saved using the multiple baseline feature? ________
- 25.
How can you choose which baseline you want to use in earned value calculations?

- 26.
How do you capture an interim plan?

- 27.
What is the difference between baselines and interim plans?

- 28.
What is an example where saving selected tasks into a specified baseline can be useful?
___________________________________________________________
- 29.
How do you clear a baseline?

- 30.
What does the Render Image functionality do and what are the different rendering options?
