
Project Execution—Background
Tracking with Microsoft Project 2019
Entering Actual Progress Information
 Learning Objectives for This Chapter
Understand the theory of project execution
Define the basic information that is utilized to track project progress
Understand how Microsoft Project calculation options affect tracking of actuals and how Microsoft Project calculates actual work and remaining work
Use basic features of tracking schedule, work, and cost in Microsoft Project Professional (or Standard)
Explain the difference between tracking actual progress using % complete vs. actual work
The project manager’s primary functions change once a project has been planned and work is ready to start. Though planning remains necessary throughout project execution to deal with inevitable changes, the most important activities become monitoring project progress and controlling future events by revising the plan to keep the project on course.
11.1 Project Execution—Background
What Is Project Control?
All too often, the plan is set aside in favor of “getting some real work done.” Effective project control requires that the project manager spend time managing the project using the plan as a roadmap for the trip. With this map, he/she always knows where the overall project stands during the execution phase. Without a standard for comparison, a project manager cannot understand the meaning of the actuals collected and cannot have any control over the project’s future direction.

Elements of control
Progress Tracking
A very important part of the monitoring activity is tracking—that is, the process of collecting progress information from the project team and entering it into the work plan. The information that is gathered should be accurate and should come from all project resources on a regular basis.
Tracking is often referred to as collecting actuals .
Tracking progress provides the first opportunity for the project manager to validate the estimated work effort for the planned tasks. Work is critical because costs connect to the amount of work done, not the time spent doing the work.
As a result of tracking, the project manager can continue to keep the team accountable for the quantity and quality of the project work performed. After all, if the team knows that you intend to measure their progress against their estimates, they will provide the most accurate estimates they can and be committed to them.
Some team members may not be comfortable with tracking at first. They may think it’s bad enough you coerced an estimate out of them during planning, and now you’re asking them on a regular basis how they’re doing. The project manager has to be sensitive to concerns the team may have about the motivation for tracking.
Many organizations are not culturally prepared for the requirements posed by the project manager who wants to track. Since the project manager is often not the line manager for all of the resources, resistance to the idea of tracking may present a problem. The project manager has to consider how realistic it is to institute a tracking process in an organization that is not ready for it.
The Hawthorne Time and Motion Studies—Bell Labs (1950s)
The Hawthorne Time and Motion Studies were conducted to see what makes people productive. The environment was changed to make it bright, cheery, and comfortable. The workers were productive under these conditions. When the environment was made dark, dreary, and uncomfortable, again the workers were productive under these new conditions.
This puzzled the researchers. The unexpected conclusion was that the workers knew that the researchers were watching them, and that’s what was making them productive. The theory that came out of this was if you want people to work hard, you have to watch them. This is sometimes referred to as “Theory X.”
This tends to have a negative connotation, but it need not be. In reality, people do what they believe to be valued and important. If no one else cares about a plan or schedule or task accomplishment, why should the worker care? And so, tracking does not have to be intrusive or de-motivating; it can be a way of saying “What you are doing is important and matters to me and the organization.”
The Seven Levels of Tracking—A Model
Level 0 – No actuals are tracked.
Level 1 – Key % complete, make it up.
Level 2 – Key % complete, collect from team.
Level 3 – Key actual hours, make them up (weekly).
Level 4 – Key actual hours, collect from team (weekly).
Level 5 – Key actual hours, collect from team (daily).
Level 6 – Real-time data collection.
Level 7 – Theory X (Big Brother, constant vigil).
Anything beyond Level 4 is likely overkill.
Choosing the Right Approach
Level 0 is a total lack of control. If there is no progress information collected, the plan is all but dead on arrival.
Level 1 is sometimes used in organizations that resist the collection of progress data. It’s better than Level 0 because at least something is being tracked, even though it may have only a casual connection with reality.
Level 2 is similar to Level 1 except the project manager now collects the % complete data from the team. Getting the information from the people doing the work gets closer to reality, but the only numbers people automatically agree on are 0 and 100%. The Level 2 approach usually leads to a large number of tasks that are almost done, between 90% and 99% complete.
Level 3 is getting closer to an ideal approach. Using hours instead of % complete provides better, more objective information about how time is being used and about the costs of the project. This process is usually used by a project manager that sees the need for actuals in an organization that is not culturally prepared for it. In this case, guessing the actual work is still better than Levels 0, 1, and 2, although combining this method with Level 2 may provide a good cross-check to help validate the data.
Level 4 provides the project manager with a valuable amount of progress data on a regular basis. We will assume this method in our discussions of tracking with Microsoft Project.
Level 5 is used on shorter projects or in environments where tight budgets or the high cost of resources warrants the use of a more frequent progress check.
Level 6 is becoming more popular as personal computers permeate the work place. There are already tools that automatically log user activity. The problem, of course, is interpreting the meaning of the keystrokes; for example, does sending an e-mail contribute to project progress? Maybe.
Level 7 goes beyond Level 6 to use even more of today’s technologies for presence detection and other forms of real-time monitoring that can enable the tracking of project-based activities.
On most projects, a weekly tracking process that collects actual hours is a good goal (Level 4). If this cannot be achieved, something that is better than nothing should be implemented.
Of course, the frequency of tracking depends on the project duration, among other considerations. Tracking a one-week project weekly is clearly useless; it does no good to know the project is falling behind when it is already supposed to be over.
Level 1 and Level 2 tracking are often used because % complete is fairly easy for the project manager to use with Microsoft Project, and the manager avoids having to get estimated hours or actual hours from the team. There is often latent paranoia in organizations that makes people nervous when someone starts collecting actual hours worked, which is what usually gives rise to the tracking resistance.

Illustration of % complete tracking
What Will You Ask For When You Track?
If you agree that Level 4 tracking is desirable and possible in your organization, then the question becomes, “What exactly do I need to track?” The following list of project values and characteristics corresponds to the standards of a Level 4 tracking procedure.
Period reported (such as week-ending date) – The tracking data has more meaning if you can tie it to a specific period of time. This will allow the project manager to ask questions like “How many hours were performed in February of last year?”
Actual task start date – This information is important during the analysis process to gauge if the project is progressing as planned.
Actual hours worked this period – The term actuals usually refers to this figure. This number is one of the keys to determining if the original (baseline) estimates are still valid. Note: Hours are not always the appropriate measure of time; smaller projects may use minutes and larger projects may use days, weeks, or even months.
Actual costs incurred this period, if any – If team members report non-human costs, such as equipment and travel, this information should also be collected.
Estimate to complete (Remaining Work) – This important field asks the team member to re-estimate the task based on the work performed so far. The project manager needs to be clear about how and when it’s okay to modify the baseline work estimate.
Estimated or Actual Finish – If the resource has not completed the work for the task, they should indicate if the original estimated finish date is still valid. If the task is estimated to finish later than originally expected, a new task finish date should be provided. If no work remains for the assignment, the actual finish date should be reported.
Task-related issues – Any issues encountered while performing the task should be reported.
Reasons for exceeding estimates – If the total actual work and the estimated hours to complete exceed the original estimate, the reasons for the increase should be reported to help the project manager determine if these reasons will impact other tasks as well.
The real issue, of course, isn’t what you should collect and track but how you can do so. Team members often resist filling out paper forms to report the needed data, and most project managers don’t have the time to collect and enter actuals data manually. The latter is often the real reason actuals aren’t tracked. Most project managers don’t consider “data entry clerk” as part of their job description, especially if they recognize the importance of the controlling part of project execution.
In a sense, where your project is doesn’t matter, except as an indicator of where it’s going. If it’s not going where you want it to (behind schedule, over budget, etc.), you have to take action to change the future direction of the project, since you can’t change the past.
Fortunately, Microsoft recognizes the problems of actuals collection and inclusion, and there are a number of solutions at your disposal, depending on the support infrastructure in place.
Most users of Microsoft Project 2019 will use Project Web App to collect actuals for tracking. Project Web App represents an automated approach to Level 4 tracking, which frees the project manager to focus on the results, rather than on entering the data into the project plan. The project manager has more time available for the human interaction and follow-up necessary to deal with unexpected results and issues. However, there will be situations where the project manager will not be able to use Project Web App and will be forced to fall back on other tools to collect the necessary information.
11.2 Tracking with Microsoft Project 2019
Is the project currently on time and on budget?
Based on current progress, can you readily forecast that the project is still expected to finish on time and on budget?
Once you have built an optimized work plan, load leveled it, and captured the baseline, you should be ready to start using your work plan to run the project.
Tracking Options in Microsoft Project 2019
In this section we will explore the options in Microsoft Project 2019 related to tracking and learn how they impact your project.
- 1.Click File:Options to access the Project Options dialog box, and click Schedule in the left sidebar. Scroll to the Scheduling options for this project section. Your dialog box will resemble the following.
 Figure 11-3
Scheduling options
The Split in-progress tasks option allows rescheduling of remaining duration and work when a task slips. It is selected by default, but ensure this option is selected so that you can enter the date you stopped work on a task and the date you resumed work on it when you update task-tracking information. Microsoft Project will reschedule the remaining duration and work. This is a local setting saved with the active project.
If this option is not selected, the Reschedule Remaining Work tool has no impact; Microsoft Project will simply not reschedule work and will give you no warning. When the option is selected, rescheduling remaining work will create a split in the task.
 Note If the checkbox is cleared, you cannot edit the Stop and Resume fields when you update task-tracking information.
 - 2.Scroll to Calculation options for this project. Your dialog box will resemble the following.
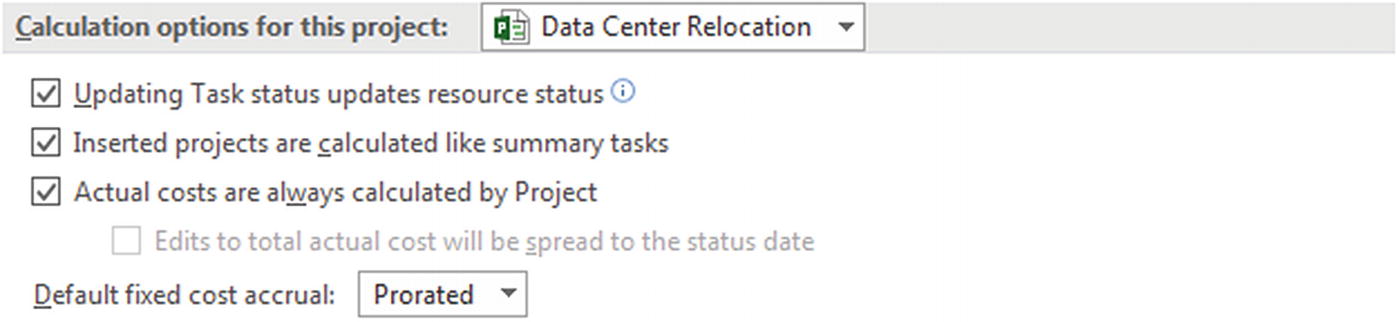 Figure 11-4
Calculation options
The Updating task status updates resource status option allows Microsoft Project to automatically calculate the actual and remaining work and cost for resources assigned to a task as you enter % complete information for the task in your schedule. When you select this checkbox, Microsoft Project recalculates the actual work and actual cost whenever you enter information into the % Complete, Actual Duration, or Remaining Duration fields.
If you don't select this checkbox, you must enter values in the Actual Work field for resources in order to have an accurate picture of the actual work and actual cost. For this reason, project managers often select (or neglect to deselect) this option, which leads to major unforeseen problems, as we’ll describe later. Ensure this box is not selected! This is a local setting saved with the active project, so it’s important to check any project file you receive to make sure this option is not selected.
When the Edits to total task % complete will be spread to the status date option is checked, changes to the % Complete field will affect where the status date symbols appear on the calendar bar chart. Increases in % Complete will move the status date symbols. When this option is cleared, changes in the % Complete field can cause progress bars (the black bars inside the blue and red Gantt bars) to extend through the status date.
Generally, if you choose to use status dates and progress lines, you will want to check this option so the status date and the progress bar will match. It can be misleading to have the progress bar extend past the status date, since that implies future work is completed already.
The Actual costs are always calculated by Project option allows Microsoft Project to calculate actual costs automatically, which means you cannot enter actual costs until the task is 100% complete. In practical terms, entering an actual cost value tells Microsoft Project the task is done! If you want to enter or import actual cost values, clear the checkbox to turn off all calculations of actual costs by Microsoft Project. This is a user preference option—that is, you’ll have to decide if the ability to enter actual costs data during a task is important to your project.
 Note Turning this setting on will erase any user-entered or imported actual cost values.
The Edits to total actual cost will be spread to the status date option becomes live when you deselect the Actual costs are always calculated by Project option. This functions like the total task % Complete option; the question is whether you want cost data to match status dates or not. If you want actual cost information to match the end of the actual duration of the task rather than the status date, clear the checkbox.
- 3.
Click OK to close the Project Options dialog box.
Track Progress: Tracking Dates vs. Tracking Work
By % complete
By using actual work and remaining work to derive the % complete for the tasks in your project
When tracking using the % Complete field, Microsoft Project will calculate actual work and remaining work based on the % Complete you enter. Remember the scheduling option Updating task status updates resource status? Note: If you are entering actual work and remaining work in Microsoft Project, it is important to understand how this feature can interfere with previously updated data in your plan.
Whenever you enter actual information into Microsoft Project, the scheduling engine will automatically set the actual start and/or actual finish dates. It is important to know how to view, validate, and potentially modify the assumptions made by the scheduling engine.
Work = Actual Work + Remaining Work
If you let Microsoft Project automatically calculate these fields for you based on % Complete, the Work field will always equal the Baseline Work field since a task cannot be completed at 110% or 90% of the original Work value. Consequently, when Work = Baseline Work, then Work Variance = 0.
A work variance of zero means that your actual progress always appears to match your original work estimates—perhaps a nice thought, but real-life projects usually don’t work out this way. In fact, using % Complete as the tracking tool eliminates all five types of variance calculated by Microsoft Project!
We can use Microsoft Project 2019 to tell us when our current task progress (i.e., work) is different from our original work estimate (i.e., baseline work). The key to making this happen is either enter a resource’s actual work and remaining work directly in the project (and not use % complete tracking) or collect a resource’s actual work using Project Web App and use that to automatically update the project plan (as described in Section 12.3, “Tracking Progress Using Project Web App”).
11.3 Entering Actual Progress Information
When tracking information is not obtained through Project Web App, Microsoft Project 2019 allows you to enter five different types of actual task information: actual start and finish dates, % complete, actual and remaining duration, actual and remaining work, and actual and remaining costs. As we covered earlier, these are interrelated, and Microsoft Project will use whatever actual values you provide to calculate the others.
Actual task data can be entered through the Update Tasks dialog box—using the Tracking function on the ribbon—or entered directly into the Tracking Table. Using the Gantt Chart view with the Details option selected, actual work and actual cost can be entered in the Task Form (lower) pane. In this section, we’ll look at these options and how they work.
Using the Update Tasks Dialog Box
The quickest and easiest way to track manually is to use the Update Tasks command . The simple rule is change whatever doesn’t match the plan.
Tracking with Update Tasks
- 1.
Switch to the Tracking Gantt view.
- 2.
Select the task Create Statement of Work (ID 2).
- 3.From Task:Schedule, use the Mark on Track dropdown to select Update Tasks. You will be presented with the Update Tasks dialog box.
 Figure 11-5
Update Tasks dialog box
Notice that the planned (current) start, finish, and duration for the task are listed but grayed out so they cannot be changed. Only the actual values can be modified.
- 4.Change the % Complete value to 75 and click OK. Notice that the progress bar is displayed.
 Figure 11-6
Tracking Gantt bars after updating % complete
- 5.Double-click Task ID 3, Obtain approval of Statement of Work. The Task Information dialog box will open.
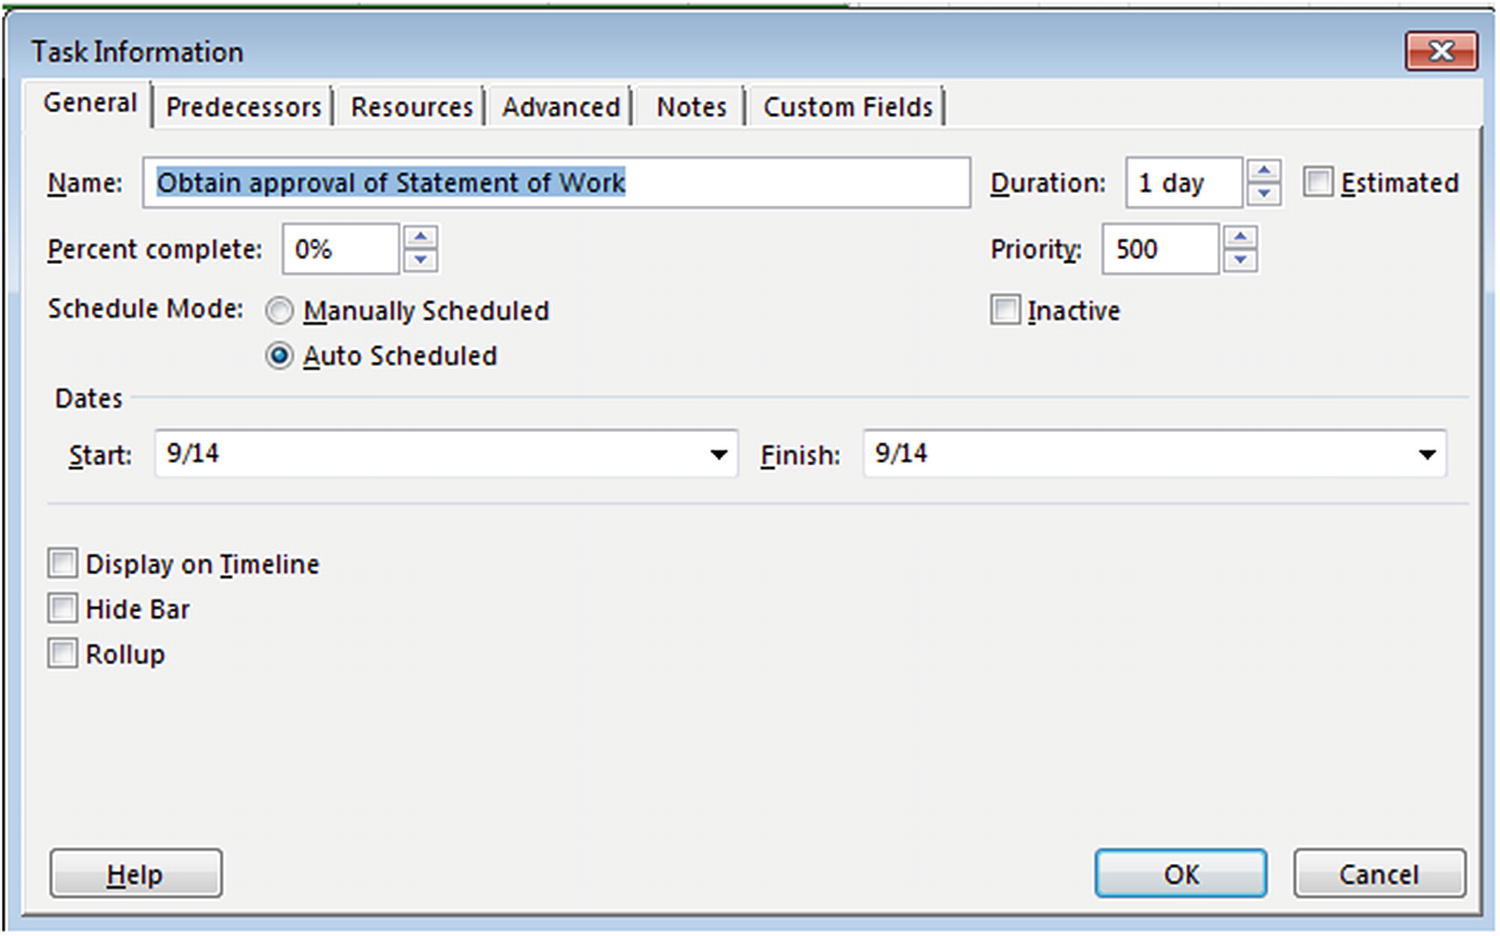 Figure 11-7
Task information for Task 3
- 6.
Set % complete in the Task Information dialog box to 25 and click OK. Notice that the completed task bar for this task once again matches the baseline bar.
Using % complete can be a simple way to track task progress.
The Task Information displays % complete on the General tab. The Update Tasks is a good alternative to enter % complete in Task Information. Other useful methods include inserting the % Complete field into their Gantt Chart or applying the Tracking Table in the Gantt Chart view.
- 7.Choose Task:Table dropdown, then Tracking. Notice that this includes many key tracking-related fields, including % Complete.
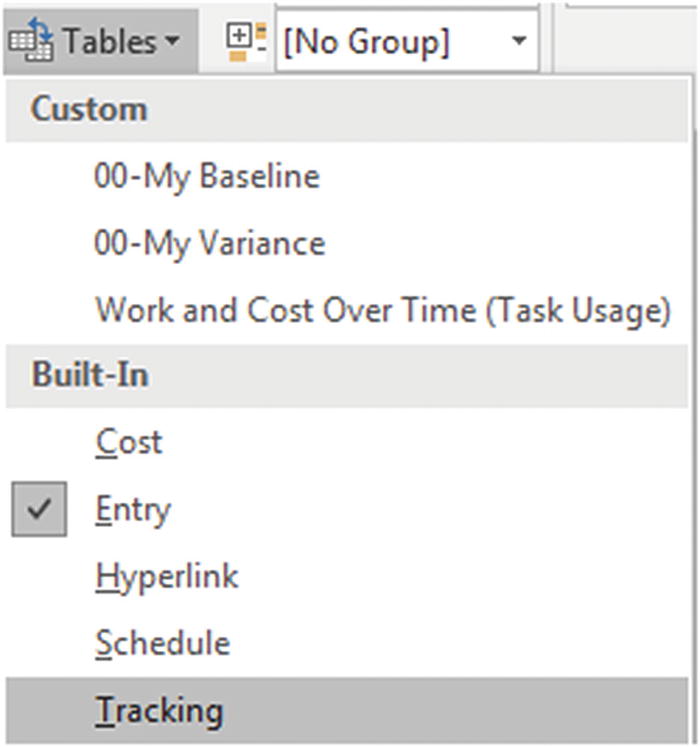 Figure 11-8
Applying the Tracking Table
- 8.
Update Task 5, Review project plan with team, to show it went according to the revised plan. You can update Task 6 if you wish, but since it is a milestone, it has no work or duration attached to it. Updating the task will flag it as complete and show the schedule variance between the baseline plan and reality.
- 9.
Select Task 8, Define System Environment. To get the project back on schedule, you got the resource assigned to Task 8 to agree to complete the task in three days rather than four.
- 10.Open the Update Tasks dialog box and enter an Actual dur: of “3d” and a Remaining dur: of “0d.” Click OK. Your screen will resemble the following. (You may want to zoom in to see the bars more clearly.)
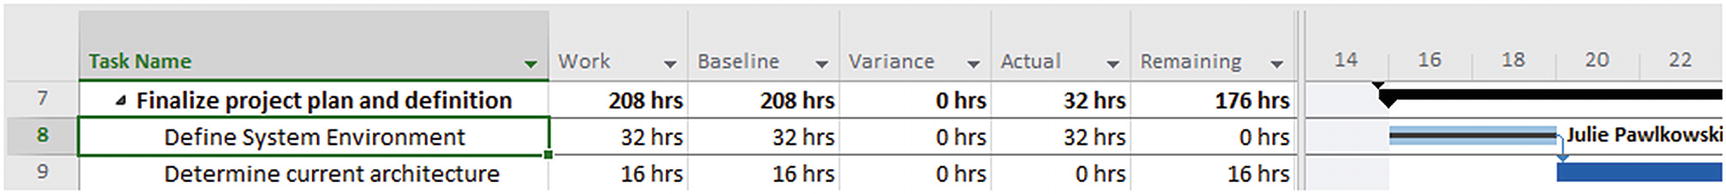 Figure 11-9
Tracking by actual and remaining duration
This view was created by applying the Work Table to display the results of the Actual Work and Remaining Work fields.
- 11.Open Update Tasks for Task 8 once again. As shown in the following figure, Microsoft Project has now populated all the other fields—Actual Start and Finish and % Complete—based on the actual and remaining duration values you provided.
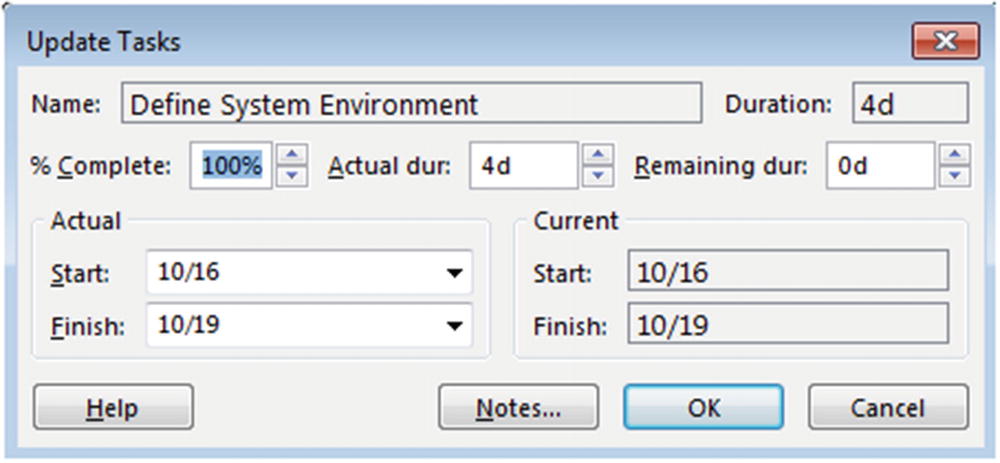 Figure 11-10
Completed Update Tasks dialog box
Notice that the current finish (planned finish) date is now the same as the actual finish: October 21. This illustrates an important principle familiar to every experienced project manager: reality always wins. If there is a difference, actual dates override planned dates.
This approach will accurately provide schedule variance information, but if resources have to work extra hours to get a task completed faster, you will have to enter modified planned and actual work somewhere else to get work and cost variance information.
Another approach to using Update Tasks is to enter the actual start and actual finish dates. If a task has an actual finish date, what is its % complete?
- 12.Verify that you have applied the Tracking Table (View:Table:Tracking). Select Task 9, Determine current architecture. Enter an Actual Start date of “10/23” and an Actual Finish date of “10/25.” Click OK. Your screen will resemble the following.
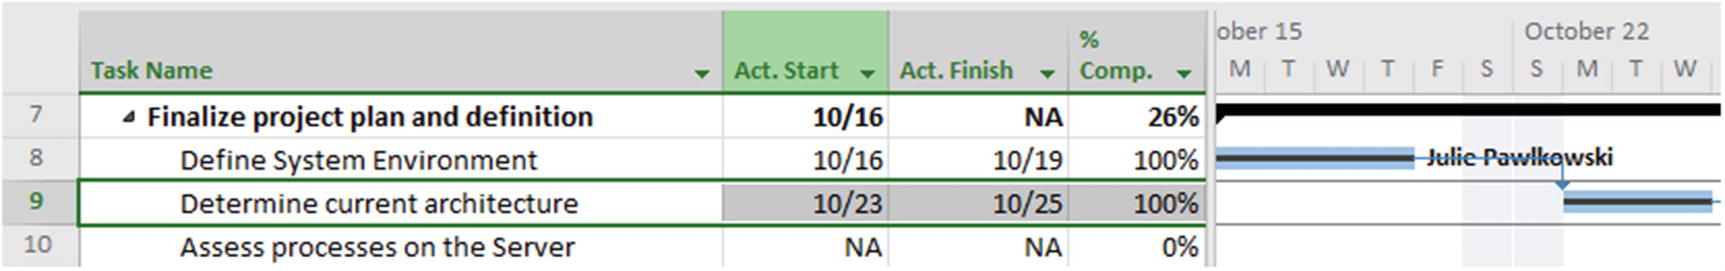 Figure 11-11
Tracking actual dates via the Tracking Table
In general, when following the Update Tasks tracking method, you only have to enter two values. The exception is a task that is not complete and did not start on schedule. The following exercise is an example of just that.
- 13.Select Task 10, Assess processes on the Server, and open Update Tasks. The resource working on Task 10, Julie Pawlkowski, agreed to start on October 24 to help get the project back on schedule; it’s now late afternoon on October 25, and you are updating the plan for a management review Monday morning. You just called Julie and she said she did in fact start on October 24, so she has completed 2 days’ work. Not only that, she thinks it will only take 9 more days to finish the task, not the 10 she originally forecasted. In the Update Tasks dialog box, enter an Actual Start date of “10/25” an Actual dur: of “2d,” and a Remaining dur: of “9d.” Your screen will resemble the following.
 Figure 11-12
Using Update Tasks for a task in progress
- 14.Click OK to update the task data. What does the Gantt Chart view tell you about the project schedule?
 Figure 11-13
Gantt Chart view of Assess processes on the Server
- 15.
Save your project.
Ways to Track Other Than Using Update Tasks
Update Tasks is the quickest and easiest way to track progress if you cannot use Project Web App, but there are several other ways, many of which can be more accurate. Choose the one that works best for you, keeping in mind that Update Tasks has limitations when it comes to work and cost variances.
Enter an Actual Finish Date for Tasks in the Tracking Table
Better forecast the scheduling of future tasks
Coordinate the work of resources who may have to adjust their schedules to match the changing project schedule
- 1.
Make sure you are in the Tracking Gantt view.
- 2.
From View:Data, click the Tables dropdown and select Tracking.
- 3.
Select the task Assess processes on the Server (ID 10). Notice the Act. Start value of 10/25 based on the update we performed.
- 4.
In the Act. Finish field, select or type “11/7.”
- 5.Select the task Assess printer hardware (ID 11). Enter an Act. Finish of “11/17.” Note that Microsoft Project automatically sets the actual start date by copying the value in the current planned start date and sets the task to be complete (100%). In other words, it adds another day to the task duration. Your screen will resemble the following.
 Figure 11-14
Tracking actual finish (Tracking Table)
- 6.
Save your project.
Other Tracking Table Options
You can enter actual and remaining durations in the Tracking Table.
If you know the amount of time that a task has been in progress and the task is progressing as planned, you can enter the actual duration for the task in the Tracking Table as well. When you specify the actual duration for a task, Microsoft Project 2019 calculates the percentage of completion and remaining duration according to the following formulas:
% Complete = Actual Duration / Duration
and
Remaining Duration = Duration – Actual Duration
You can enter actual work in the Tracking Table. If you want to be able to see remaining work, it’s best to apply the Work Table instead, since it contains the most common work-related fields.
When you specify the actual work for a task, Microsoft Project 2019 calculates the % complete and remaining work according to the following formulas:
% Complete = Actual Work / Work
and
Remaining Work = Work – Actual Work
Entering Actual Work in a Form and Usage View
Forms enable you to enter and display detailed information about one task or resource at a time, unlike typical views where you can enter and display information on multiple tasks or resources. Seeing information in a form view can make it easier to track progress details about a task or resource.
You can use the form by itself, but it is most useful when displayed in the bottom pane of a combination view. This way, the form provides additional information about the task or resource selected in the top pane.
- 1.
Confirm that you are in the Tracking Gantt view with the Tracking Table applied (if not, from Task:View, select Tracking Gantt, and from View:Tables, select Tracking).
- 2.
From View:Split View, select Details.
- 3.
Right-click anywhere in the Task Form (bottom pane) and select Work.
- 4.In the Tracking Gantt view, select the task Communicate with integrator (ID 12). Your screen will resemble the following.
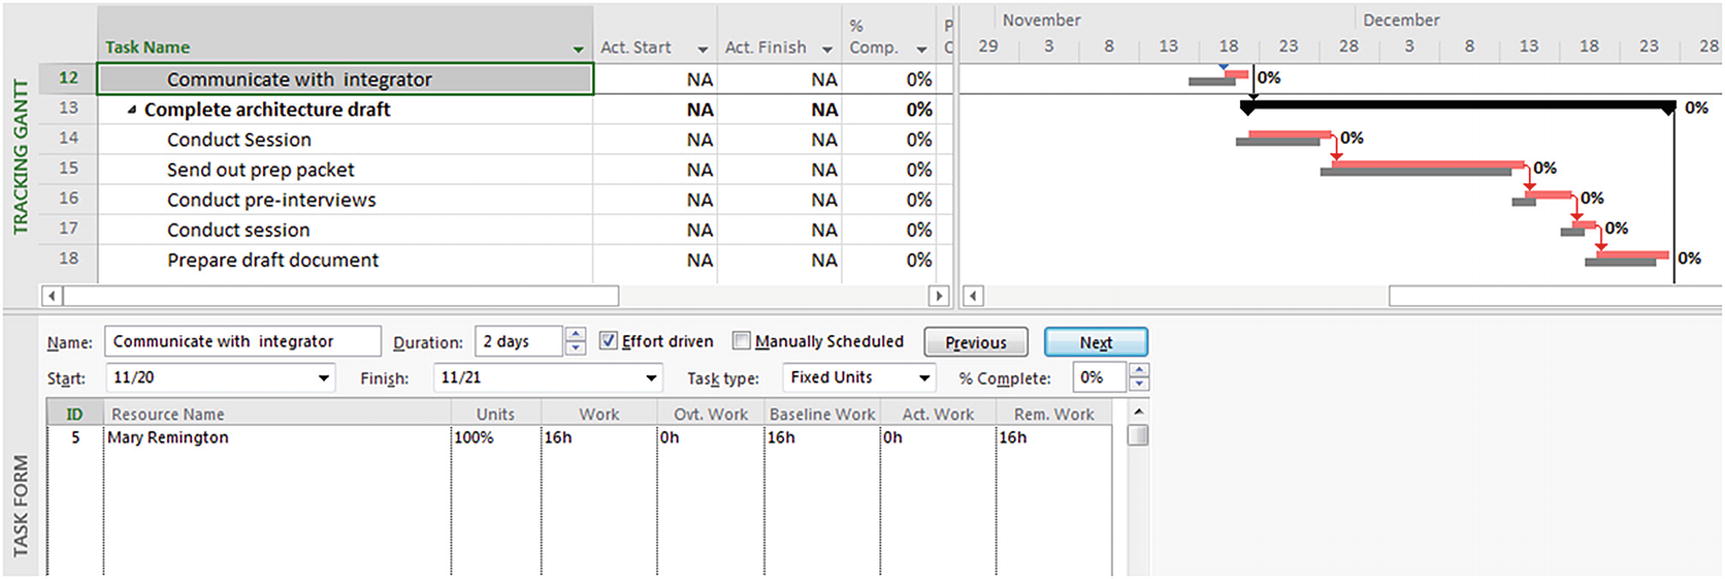 Figure 11-15
Task Form with Work details in a combination view
- 5.Mary has reported that she has performed 8 hours of work on the task so far. Enter the actual work for her assignment in the bottom pane. The recalculated values for remaining work will appear in the Rem. Work (i.e., remaining work) field. Remember to click OK when you make changes in the bottom pane. Your screen will resemble the following.
 Figure 11-16
Actual and remaining Work in a form view
The Task Usage view displays project tasks with their assigned resources grouped below them, while the Resource Usage view displays project resources with their task assignments underneath them. You can use the usage views to enter actual work information.
- 6.
Remove the split from your view (double-click the split line or uncheck the Details box) and switch to the Task Usage view. Adjust the screen so you can see Tasks 14 and 15 and the associated names. Right-click inside the calendar grid on the right side and add Actual Work to it.
- 7.
Under the task Conduct Session (Task ID 14), select the resource assignment Mike Goren.
- 8.From View:Zoom, click the Selected Tasks icon [
 ]. Microsoft Project will take you to the week during which work on the task is scheduled to begin. Your screen will resemble the following.
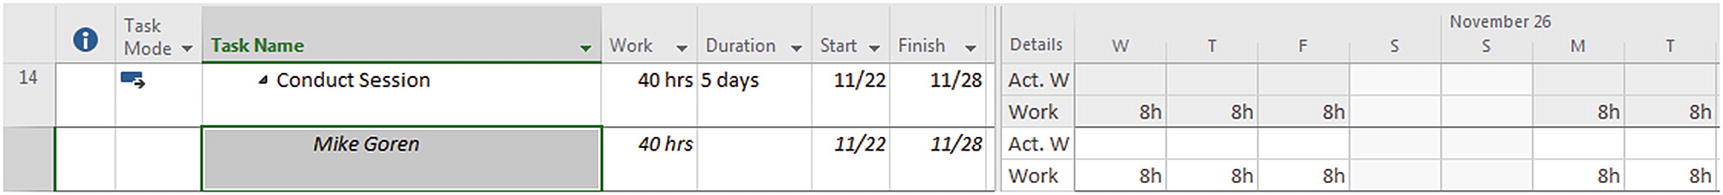 Figure 11-17
Task Usage view (showing planned work)
- 9.In the Act. Work field, enter the actual work for the task. Assume Mike worked according to schedule and did 8 hours’ work each day. Your screen will resemble the following figure. Note: Your timescale may look different. The look of your timeline can be adjusted by right-clicking in the top part of the calendar and changing settings with the Timescale command.
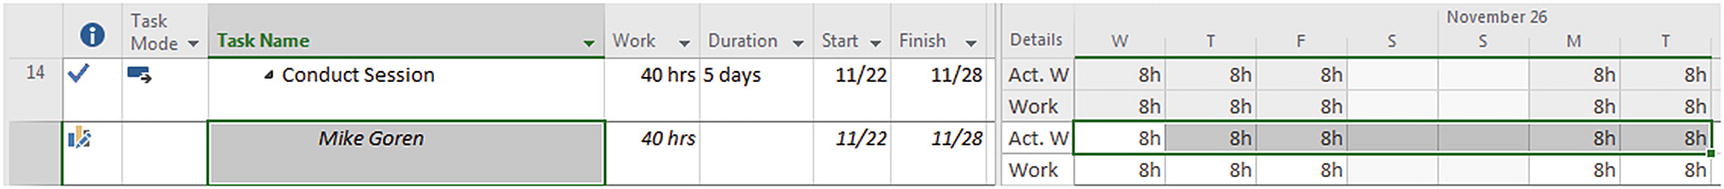 Figure 11-18
Task Usage view (actual work)
Notice that the actual hours for Mike’s assignment “roll up” to the task and the summary task as well. If other resources were assigned to this task, you would expect to see the total hours worked, not just Mike’s hours. Similarly, the summary task has other tasks beside this one, and you would want to see the grand total for all those tasks as well.
- 10.
Save and close your project.
Rescheduling the Remaining Work in Your Project
Now that you have entered the actual project progress, the next step is to reschedule the remaining work. If you do not reschedule the remaining work, incomplete tasks will not show as variances.
Rescheduling is also necessary when you are faced with a situation where a resource becomes unavailable for a period of time or a crisis arises that requires a delay in your project. Splitting tasks one at a time to show a temporary stoppage is time-consuming, but it is necessary to reflect these delays so that tasks and resources can be appropriately rescheduled. Microsoft Project 2019 offers techniques for rescheduling the remaining work on a project, which we will explore in this section.
- 1.
Notice that several tasks are complete and some—including Create Statement of Work (Task ID 2) and Create Project Plan (Task ID 4)—are incomplete, as indicated by the progress bars on the Gantt Chart. You have just been informed that all work on this project needs to stop for a few days to deal with a high-priority issue. Consequently, you need to have your project schedule reflect this.
- 2.
From Project:Properties, select Project Information, set the Current Date to “8/30”, and click OK.
- 3.Let’s assume that work cannot resume on your project until September 9. Select the project summary task (Task 0) Software System Implementation, and go to Update Project under Project:Status. You will be presented with the following dialog box.
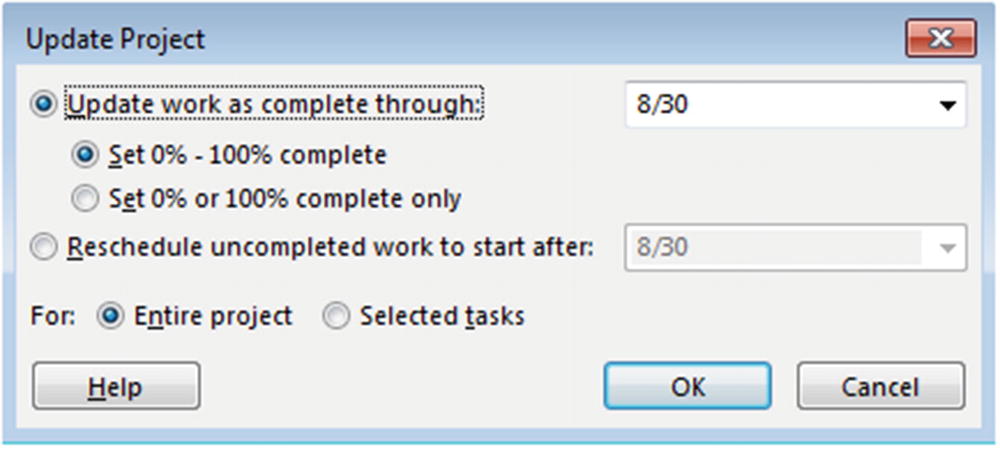 Figure 11-19
Update Project dialog box
The Update Project dialog box allows you to reschedule the uncompleted work for selected tasks or the entire project. In this case, we will tell Microsoft Project to reschedule the remaining work for the project to start on 9/9.
Caution While it may be convenient to trigger the Microsoft Project scheduling engine to match the actuals to the plan, using this technique is not likely to reflect reality.
- 4.In the Update Project dialog box, click the Reschedule uncompleted work to start after option, and type or select from the dropdown calendar “9/9.” Click the Entire project option and click OK. Notice that all incomplete tasks now have a split in the Gantt bar to reflect the stoppage of work.
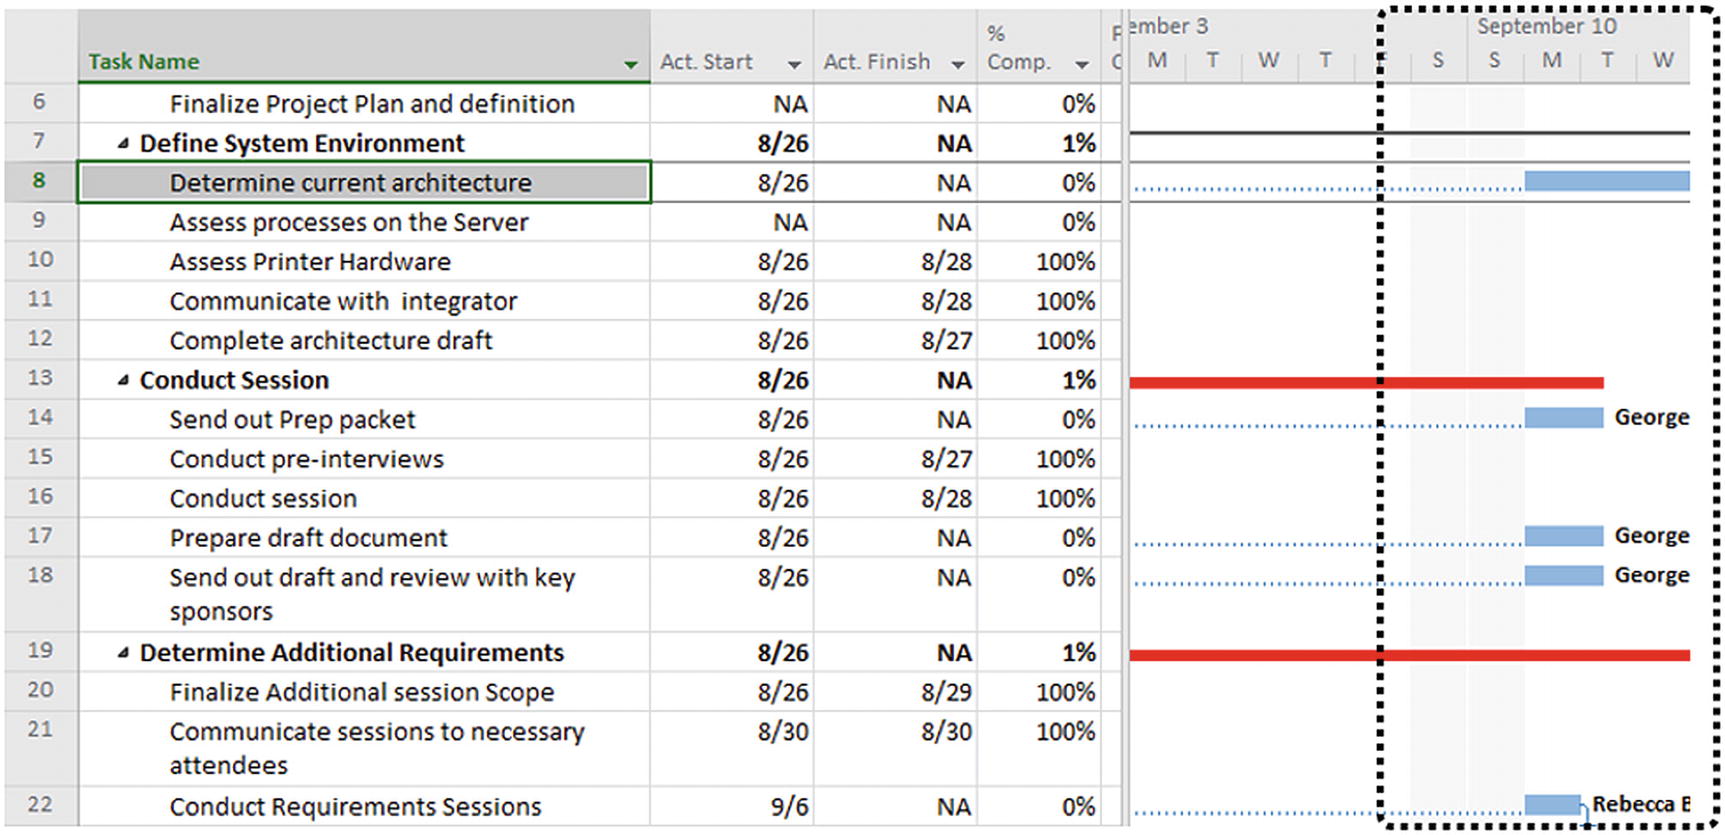 Figure 11-20
Gantt Chart reflecting split tasks that were rescheduled
- 5.Because of the delay in project tasks, Task 5 (Obtain Approval of Project Plan) is now scheduled to begin on September 17. But Bernie Frazer has already planned a vacation for that week and will not be able to start until September 26. The other resources assigned to the task will be able to work as scheduled.
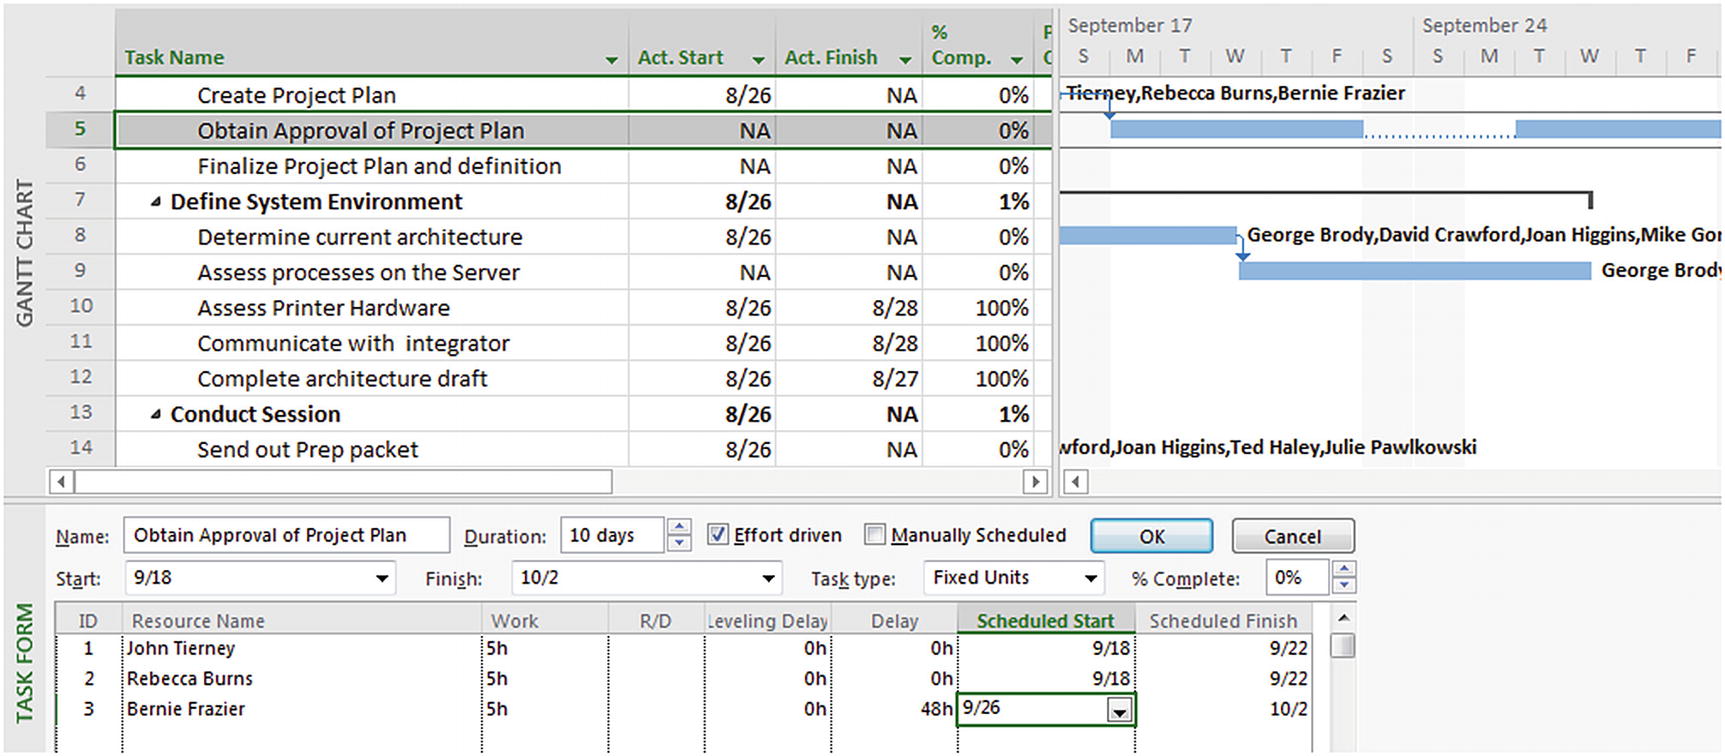 Figure 11-21
Split task for rescheduled resource
To reflect this in your project, split the window from the Gantt Chart view to display the Task Form in the bottom pane. Apply the Schedule details in the bottom pane (right mouse click the Task Form), and change Bernie’s scheduled start date for the task to “9/26.” Did this create a split in the task? Why or why not?
Your screen will resemble the following.
- 6.
Bernie was delayed on his trip by weather. Now he will not be able to work on the task until October 2. Change Bernie’s start date to “10/2.” Did this create a split in the task? Why or why not?
Your screen will resemble the following. Figure 11-22
Split task gap widened for rescheduled resource
- 7.
Mike Goren will not be able to work as scheduled on Task 9, Assess processes on the Server. He will not be able to start the task until October 10. Apply the Task Usage view and modify Mike’s daily work in the timephased grid so that he now begins his work on “10/10” (leaving the number of hours per day that he will spend on the task the same). Does this create a split in the task in the Gantt Chart?
- 8.
Save and close your project.
When you select Reschedule uncompleted work to start after, unlinked tasks without progress are not rescheduled. This may leave the project plan in an infeasible situation. A scheduling message will display to alert you so that you can go into your schedule and make changes as needed. Also, you have a great deal of flexibility in scheduling work to restart; you can select any restart date as long as it is after a task’s existing stop date (i.e., when work stopped) or actual start date.
Viewing Progress Lines
To create a visual representation of the progress of your project, you can display progress lines on your Gantt Chart. For a given progress date (or the status date of your project), Microsoft Project draws a progress line connecting in-progress tasks and tasks that should have started. This creates a graph on the Gantt Chart with peaks pointing to the left for work that is behind schedule and peaks pointing to the right for work that is ahead of schedule.
Entering a Project Status Date
When you track progress on your project, you may want to specify the date when the actuals were entered, or pick a date that meets management reporting requirements. Microsoft Project 2019 enables you to enter this date as the project status date in the Project Information dialog box. The default status date is the current date.
- 1.
From Project:Status, click Status Date.
- 2.Type a project Status date of “8/14” or select it from the Status date calendar. Your dialog box will resemble the following.
 Figure 11-23
Status Date dialog box
- 3.
Click OK.
Setting Line Styles
- 1.
Confirm that you are in the Tracking Gantt view. From Format:Format, use the Gridlines dropdown to select Progress Lines. You will be presented with the Progress Lines dialog box.
- 2.Click the Line Styles tab. Your dialog box will resemble the following.
 Figure 11-24
Progress Lines:Line Styles
- 3.
Select your preferred Line type, Line color, Progress point shape, and Progress point color for the appearance of your current progress line, which will appear at the selected status date.
- 4.
Click the Show date for each progress line checkbox. Now your lines will indicate the dates on which progress reports were made.
- 5.Click the Dates and Intervals tab, and in the Current progress lines section, select the Display checkbox and the At project status date option button. In the Begin at section, accept the Project start default option so that your progress line will reflect the progress made as of the project status date you just entered. Your screen will resemble the following.
 Figure 11-25
Progress Lines dialog box with appropriate settings
- 6.Click OK. Your screen should look as follows.
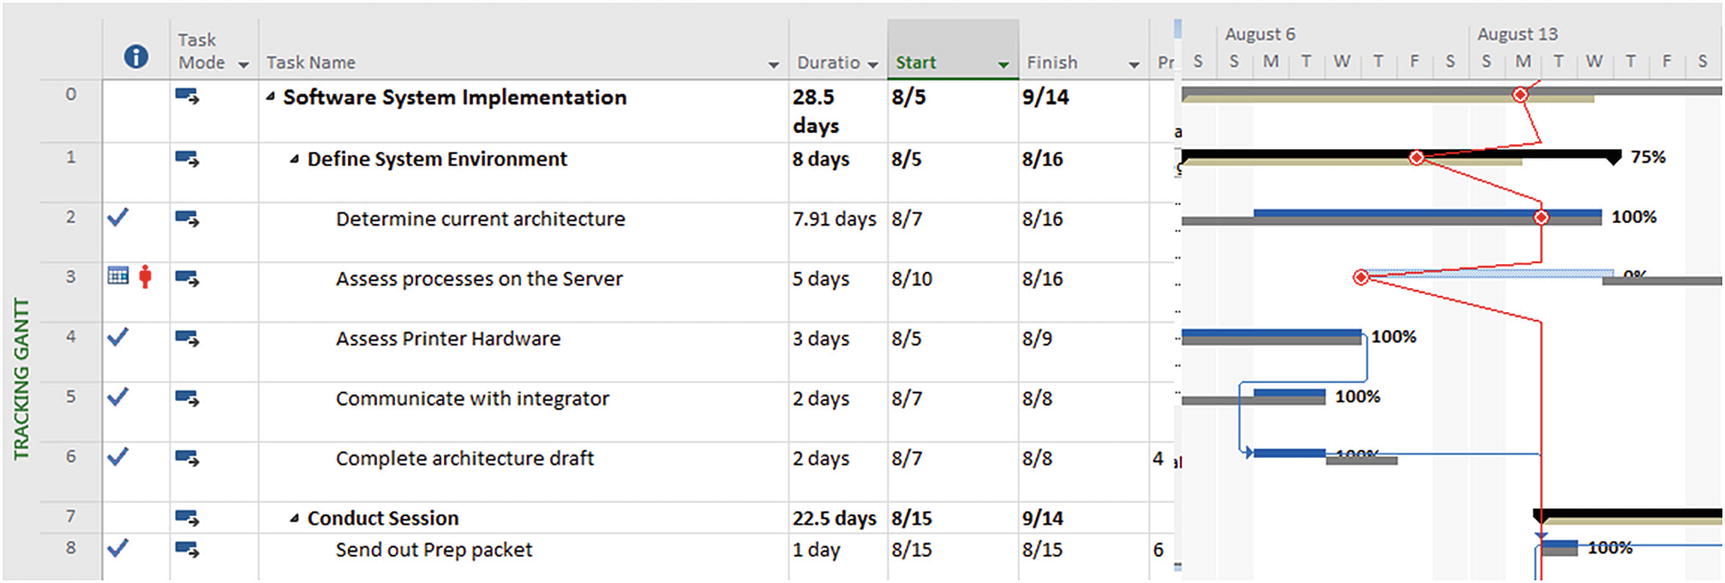 Figure 11-26
Progress Lines
Setting Time Intervals
- 1.
From Format:Format, use the Gridlines dropdown to select Progress Lines. You will be presented with the Progress Lines dialog box.
- 2.
Click the Line Styles tab and select a different Line type, Line color, and Progress point shape for All other progress lines.
- 3.
Click the Dates and Intervals tab.
- 4.
Accept the At project status date default option button selection so that your project lines reflect the progress made as of the recently entered project status date.
- 5.
In the Recurring intervals section, ensure the correct options are selected to display progress lines weekly, on Fridays.
- 6.
Accept Project Start as the Begin at default option button selection so that your project will display progress lines from the very beginning of the project.
- 7.Click the OK button. Your screen will resemble the following.
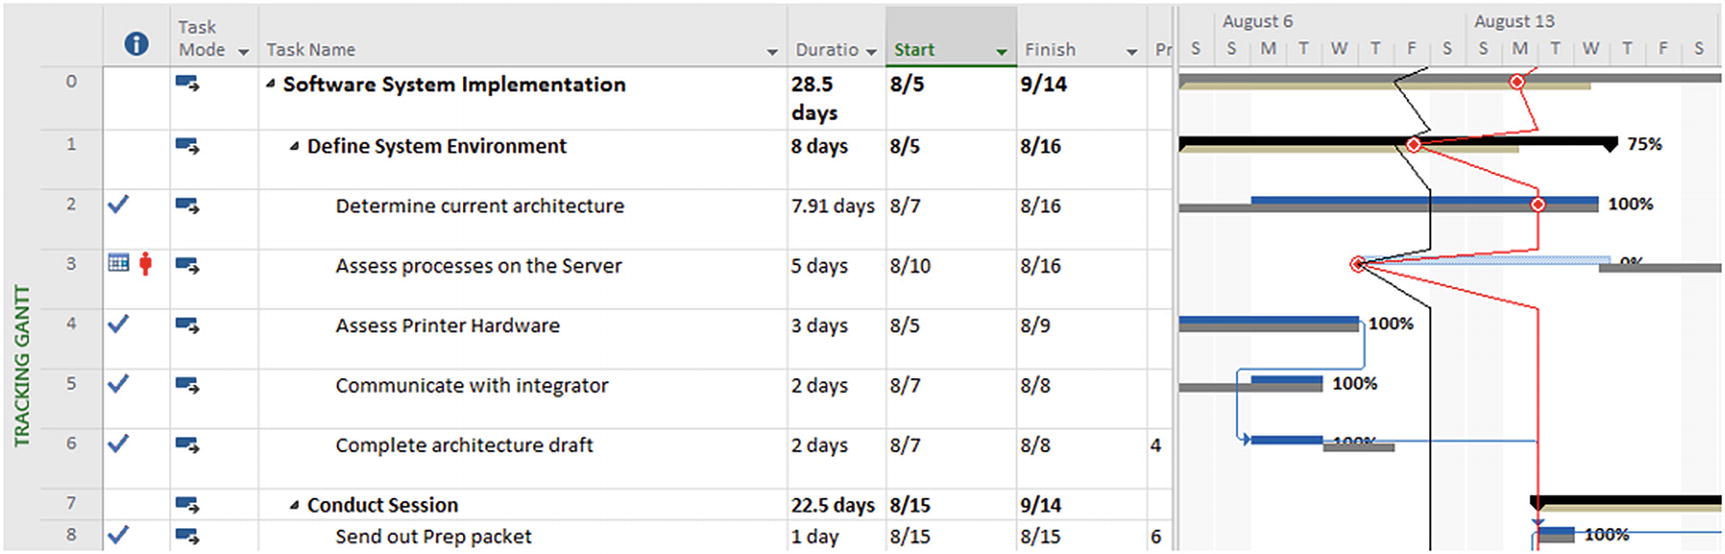 Figure 11-27
Recurring progress lines
You have the option to display progress lines in relation to the baseline. When you select this option, the progress line connects to the Baseline Start value if the task has not started and to the Actual Duration value for those that have started.
Calculation Options
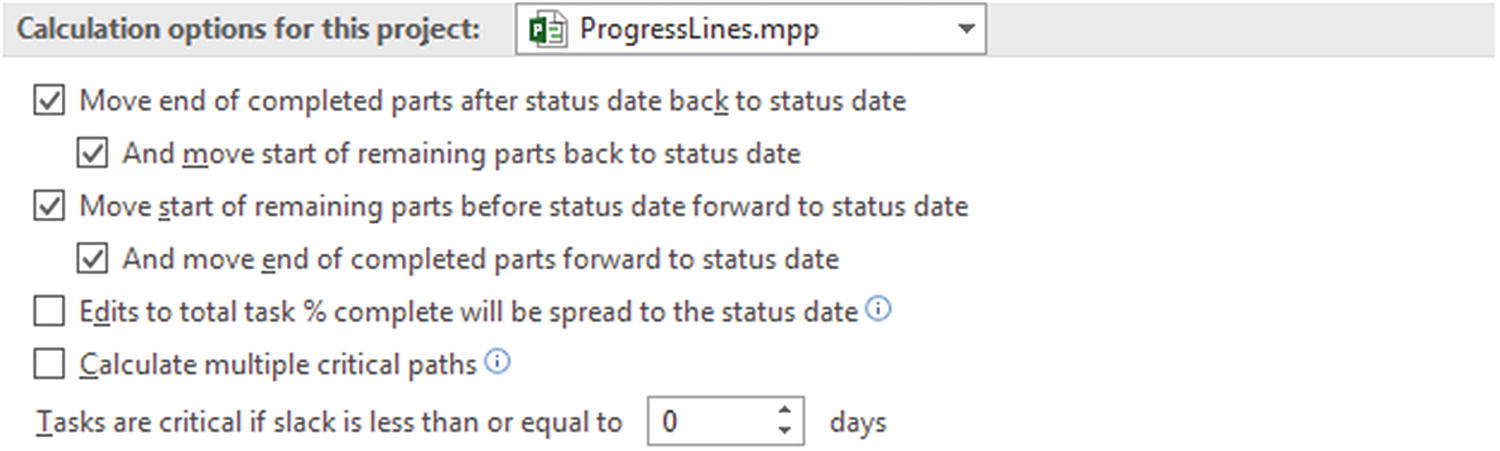
Calculation options
- 1.Move the end of completed (task) parts after status date back to status date.
- 1a.
and move start of remaining parts back to status date.
- 1a.
- 2.Move start of remaining parts before status date forward to status date.
- 2a.
… and move end of completed parts forward to status date.
- 2a.
Option 1a is not available unless Option 1 is selected. Likewise, Option 2a is not available if Option 2 has not been selected.
If Status Date reads “NA,” the date is not set and the current date is used.
Constraints on tasks are ignored if these options are selected, as actual start always overrides a constraint.
The options are not applied when actuals are set on summary tasks.
These options only apply when making total actual value edits, such as task total actual work, task actual duration, total % complete, and % work complete. For example, if timesheet actuals are sent via Microsoft Project Server, the options do not apply; however, if % work complete is sent, then the options do apply.
 End of Chapter Quiz Questions
- 1.
Fill in the blank: ________ is the process of collecting progress information from the project team and entering it into the work plan.
- 2.
Fill in the blank: A project manager who is actively managing the plan will always know where the project stands in relation to the _________________.
- 3.
Tracking progress provides the first opportunity for what?

- 4.
As a result of tracking, the project manager can continue to keep the team accountable for what two things? _______________ and _____________________
- 5.
Why are Level 1 and Level 2 tracking often used?
___________________________________________________________
- 6.
What is at least one major drawback to % complete tracking?
___________________________________________________________
- 7.
What was the conclusion of The Hawthorne Time and Motion Studies?
- 8.
What information does the project manager using Level 4 tracking need from the team each week?

- 9.
Fill in the blanks: Project Web App represents a(n) ________ approach to Level 4 tracking, so that using it frees the project manager to focus on the ________, rather than on entering the data into the project plan.
- 10.
Tracking is the first step in helping you answer two major questions:
_________________________________________________?
_________________________________________________?
- 11.
How do you access the scheduling options for your project?

- 12.
What does the Updating task status updates resource status option do?

- 13.
What does the Edits to total task % complete will be spread to the status date option do when checked?

- 14.
True or False: Turning the Actual costs are always calculated by Project setting on will keep any user-entered or imported actual cost values.
- 15.The options for Default fixed costs accrual are
- a.
At the start of a task
- b.
Prorated through the task as resources are used
- c.
Accrued (charged to your project) at the end of a task
- d.
All of the above
- a.
- 16.What are the two different ways to track progress with Microsoft Project 2019?
- 1.
________________________________________________
- 2.
________________________________________________
- 1.
- 17.
Fill in the blank: In Microsoft Project 2019, Work = _______ + Work + ________ Work.
- 18.What five different types of actual task information does Microsoft Project 2019 allow you to enter?
- 1.
________________________________________________
- 2.
________________________________________________
- 3.
________________________________________________
- 4.
________________________________________________
- 5.
________________________________________________
- 1.
- 19.What are three different ways of entering actual task data?
- 1.
________________________________________________
- 2.
________________________________________________
- 3.
________________________________________________
- 1.
- 20.
What is the quickest and easiest way to track manually? __________________________
- 21.
How do you access the Update Tasks dialog box?
___________________________________________________________
- 22.
Fill in the blank: In general, when following the update tasks tracking method, you only have to enter how many value(s)? _______________________
- 23.
What is the exception to only having to enter two values when following the Update Tasks tracking method?
___________________________________________________________
- 24.
Fill in the blank: Update Tasks has limitations when it comes to ________ and ________ variances.
- 25.
What are the two possible formulas that Microsoft Project 2019 uses to calculate the percentage of completion and remaining duration when you specify the actual duration for a task?
____________________________________________ and
____________________________________________
- 26.
What are the two possible formulas that Microsoft Project 2019 uses to calculate the % complete and remaining work when you specify the actual work for a task?
____________________________________________ and
____________________________________________
- 27.
What is the difference between using forms and views to enter data?

- 28.
A resource has reported that she has performed 8 hours of work on the task so far. How would you reflect this information in a Work Form in a combination view, and what happens to the remaining work value?

- 29.
True or False: If you do not reschedule the remaining work, incomplete tasks will show as variances.

- 30.
What are progress lines, and where can you display them?

- 31.
What is the project status date used for, what is its default value?
