
Communication Options
Using Tables, Filters, and Views
Defining and Using Custom Fields
Communicating Project Information
Exporting Project Information
 Learning Objectives for This Chapter
Describe the communication options in Microsoft Project, especially as it pertains to options available to format the Gantt Chart
Effectively create, utilize, and modify the tables, filters, groups, and views features available to display meaningful project information
Sort information in views
Define and use custom fields
Communicate project information as it pertains to the dashboard and visual reports available in Microsoft Project
Know how to set up and manipulate the information in dashboard and visual reports
Export project information
In earlier chapters we’ve discussed the importance of updating project plan information with actuals and updating the plan itself to reflect the results of work done and changes in scope. For this information to be useful, you must be able to easily display the information you need and be able to present it to project stakeholders, often in the form of status reports and progress reports. These presentations require organized data and graphics, so this chapter will discuss the presentation options available to users of Microsoft Project 2019.
15.1 Communication Options
Capture what is on the screen in a format that allows the user to paste the image directly into a Microsoft Word or PowerPoint document or as an image that can be sent as a picture to stakeholders. Recall the Copy Picture tool discussed in Section 9.5, “Taking a Picture of Your Gantt Chart.” This approach is a major avenue for reporting graphics.
Display a view containing the information you need.
Print the information, or a selected set of information, on the screen to prepare hard copy reports.
Export the data to another application for manipulation or to prepare electronic reports.
Options with the Gantt Chart View
The Gantt Chart is a relatively simple picture of your project. Since it is a calendar bar chart, it is easily explained, even to someone who is unfamiliar with the format. The last version of Microsoft Project made the Gantt Chart even more visually appealing by adding three-dimensional texturing and enhanced colors to the calendar bars, as well as cell background formatting to the table portion of the view.
The Bar Styles dialog box is the quickest way to make extensive changes to the Gantt Chart.
The Format Bar… button allows users to change one bar at a time.
Drawing on the Gantt Chart allows users to add notes and explanations to the calendar field.
We’ll examine these three approaches in the following exercises.
Using Bar Styles to Change the Appearance of the Gantt Chart
The Bar Styles dialog box (which can be accessed from the Format tab on the ribbon or by right-clicking the Gantt Chart itself) provides a great deal of flexibility in formatting the Gantt bars and the attached text on a Gantt Chart display.
As mentioned earlier in this book, you can display interim plans on your Gantt Chart. The following lesson explores how this can be done using the Bar Styles dialog box.
Displaying Current, Interim, and Baseline Plans on Your Gantt Chart
By comparing a task’s baseline to its plan in the Tracking Gantt view, you can see how a task’s actual schedule compares to its original estimate. If the project is only one week old, then this comparison might be sufficient. But suppose we are three months into the project and would like to be able to see the current situation, as well as the baseline and forecast for the remainder of the project.
Microsoft Project 2019 gives you the capability to save interim plans as well as baseline plans. An interim plan is a snapshot of your project’s scheduled start and finish dates at a specific point in time. You can save up to ten interim plans. By presenting the baseline, a dated interim plan, and the current updated plan, you can show the evolution of the project plan since project execution began.
- 1.
From Project:Properties, click Project Information, and in the Project Information dialog box, set the Current date to “6/26.”
- 2.
Switch to the Tracking Gantt view.
- 3.
You would like to save a snapshot of the plan as of today (June 25 [of the current year]) and display it on your Tracking Gantt Chart for a future management presentation. From Project:Schedule, use the Set Baseline dropdown to select Set Baseline…. You will be presented with the Set Baseline dialog box.
- 4.Select the Set baseline option button. Your screen will resemble the following.
 Figure 15-1
Set Baseline dialog box
- 5.
Click OK to close the dialog box.
- 6.Apply the Baseline Table (View:Date:Table dropdown and choose More Tables).
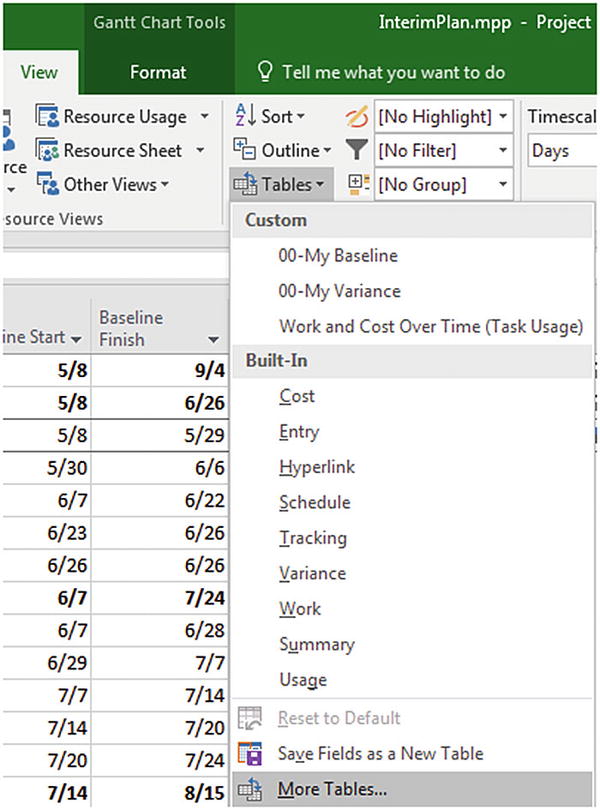 Figure 15-2
Applying the Baseline Table, part 1
- 7.Click Baseline table then Apply.
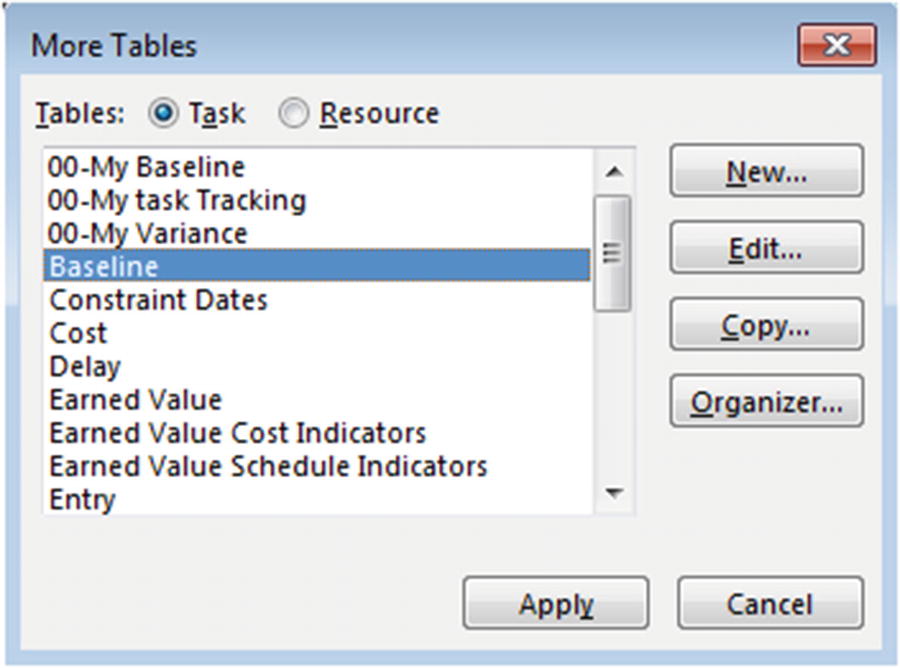 Figure 15-3
Applying the Baseline Table, part 2
- 8.
Now apply the Tracking Table (View:Data:Tracking).
Enter the following Actual start dates:- i.
Task 3: 5/12
- ii.
Task 4: 6/3
- iii.
Task 5: 6/12
 Figure 15-4
The Tracking Table
- i.
- 9.Now apply the Variance Table (View:Data then choose Variance). Note the difference between the start date and baseline start. Also, note the difference between the finish date and the baseline finish.
 Figure 15-5
The Variance Table
- 10.Apply the Tracking Gantt view. Then, choose View:Zoom, and from the Timescale dropdown, choose Weeks. Note that each task has two Gantt bars. Also, note that the bars are separated for each task. What does this mean?
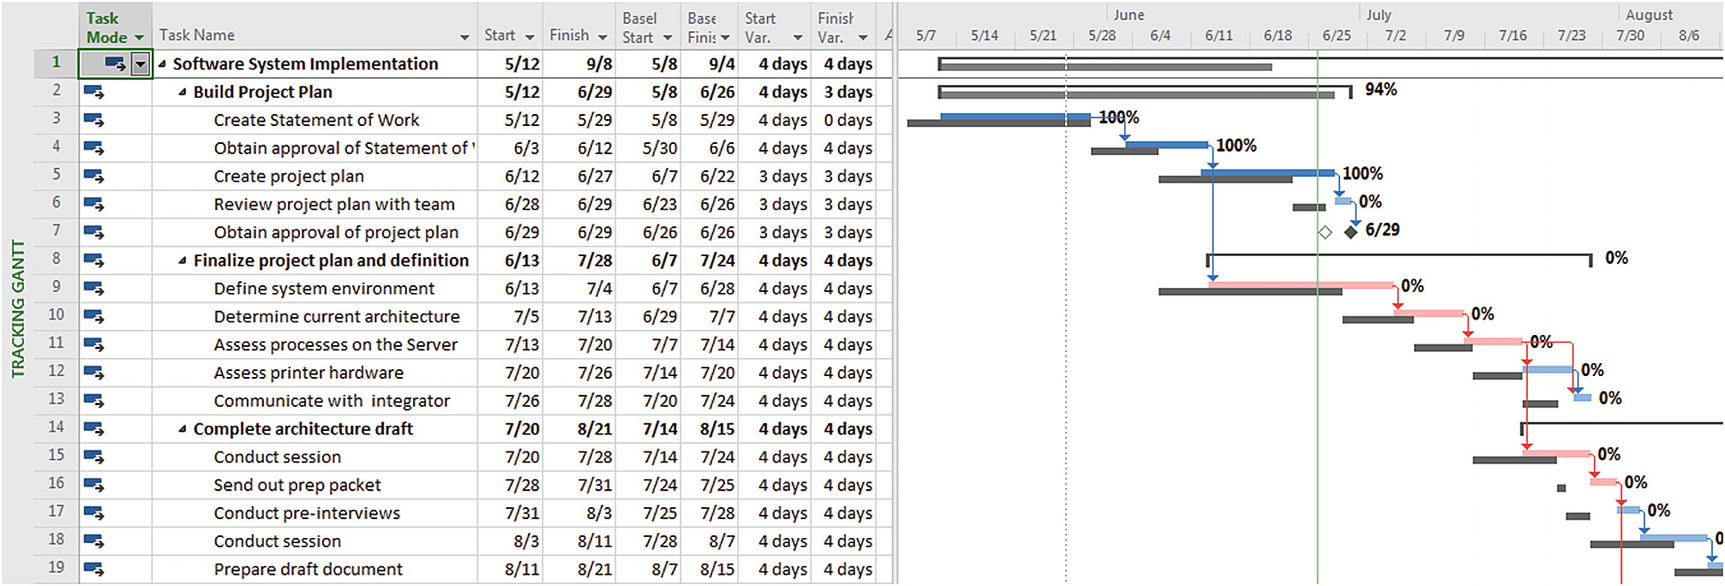 Figure 15-6
The Tracking Gantt view
- 11.Now investigate how the Bar Styles are configured on the Tracking Gantt view. Right-click in the Gantt Chart (in the white area) and select Bar Styles from the menu that appears. (Alternatively, from Format:Bar Styles, click the Format dropdown to select Bar Styles.) Your screen will resemble the following.
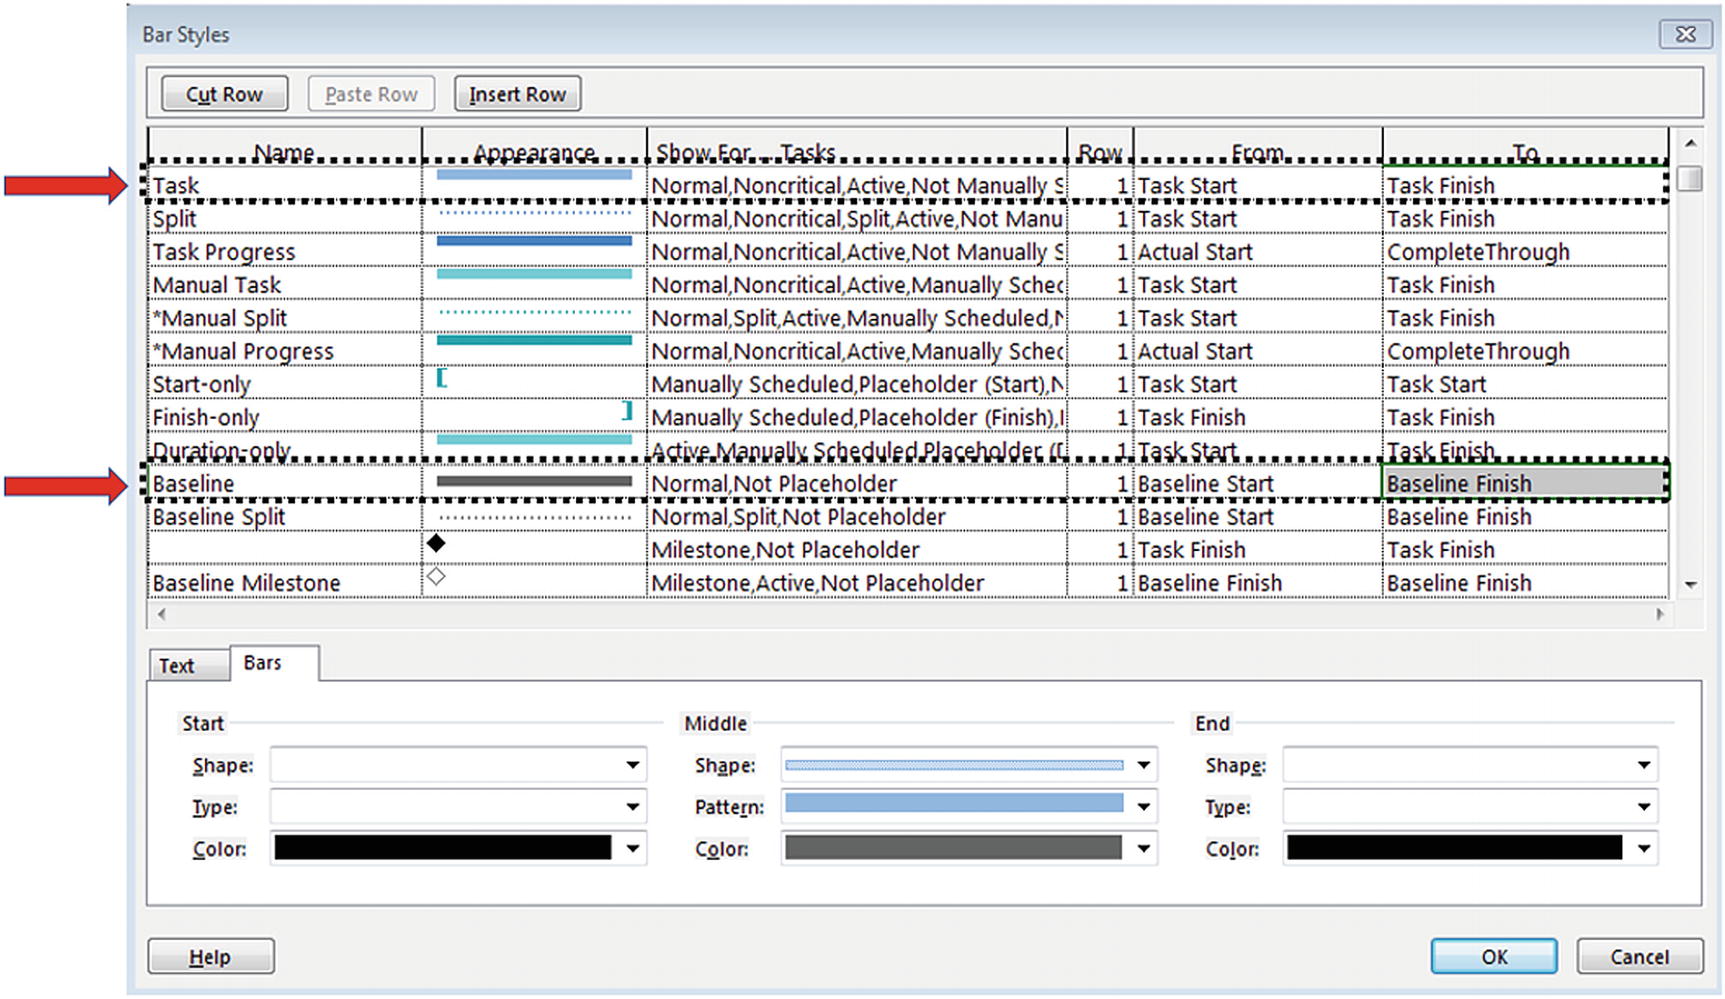 Figure 15-7
Bar Styles dialog box
- 12.
Save your project.
Viewing the Gantt Chart Bars Without Resource Names
Microsoft Project allows you to customize and control almost all aspects of information presentation, including views, formats, and layouts. By default, the Gantt Chart shows resource names next to task bars, but you can change the names to initials or remove them completely as you desire.
- 1.
Apply the Gantt Chart view, and from Format:Bar Styles, click the Format dropdown and select Bar Styles. You will see the Bar Styles dialog box as before.
- 2.
Select Task in the Name column and the Text tab in the bottom half of the dialog box.
- 3.Select Resource Initials from the Right dropdown list. Make this change for both the Critical row and the Task (non-critical) row. Your screen will resemble the following.
 Figure 15-8
Bar styles (Text)
- 4.Click OK. Your screen will resemble the following.
 Figure 15-9
Task bars with initials
- 5.
Save and close your project.
Changing Bar Style or Color
Along with the drawing tools, changing the bar style or color can be used to communicate information. Let’s say that the assessment task involves an outside contractor, so you would like to highlight it for the next management review.
- 1.Right-click the bar for Task 11, Assess printer hardware. From the dropdown list, select Format Bar… to see the Format Bar dialog box.
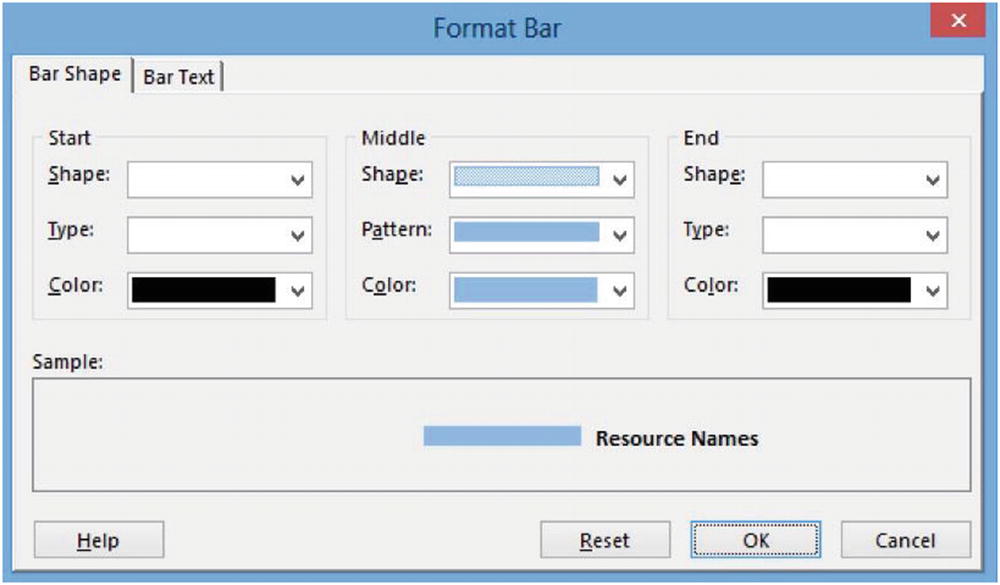 Figure 15-10
Format Bar dialog box
- 2.
Select a new Color for the task bar and click OK to save your change. Notice the new color for the bar for Task 11.
The Format Bar… option allows you to change one bar. You can also change several at a time, just as the Bar Styles… option changes all similar bars (task bars, summary bars, etc.).
- 3.
Save and close your project.
Analyzing Variances in Your Project with Microsoft Project 2019
Keeping your project under control requires that you periodically look for tasks that are not progressing as originally planned. Once you have begun capturing your project’s progress, you’re ready to analyze plan variances.
Work Variance = Work – Baseline Work
Cost Variance = Cost – Baseline Cost
Start Variance = Start – Baseline Start
Finish Variance = Finish – Baseline Finish
Duration Variance = Duration – Baseline Duration
You may find it easier to remember these by thinking of the Work field as current estimated work and the Baseline Work as original estimated work. The Work Variance is then the difference between the current estimated work and the original estimated work.
The same holds true for the four other variance fields listed earlier.
When using Project Web App to collect actual hours of work, Microsoft Project assumes the first day actuals were entered on the actual start date. This is one reason % complete can be so misleading; Microsoft Project assumes the task started when it was supposed to and took the originally calculated or planned number of hours to complete. The only way to get accurate variance data when using % complete tracking is to manually populate the actual start and actual finish fields or the actual work fields.
Any time the current estimated values are higher than the baseline values, the resulting variance will be a positive number. As we covered in Section 14.1, “Types of Variances,” this means it is unfavorable.
There are several ways to locate unfavorable variances in Microsoft Project. If none of these are suitable, we can always build new tables and other tools to help isolate trouble spots, as described later in this chapter.
Comparing the Baseline to Actual Data
Project baselines and actual data can be displayed graphically in charts or numerically in tables.
Displaying Project Statistics
The Project Statistics summary gives you a high-level overview of how you are progressing against the baseline. You can see a comparison of the current (or scheduled), baseline, and actual values for each of the five main value fields (i.e., start, finish, work, cost, and duration). You will also be able to see variance for the start and finish dates.
- 1.From Project:Properties, click the Project Information button to see the Project Information dialog box for your project.
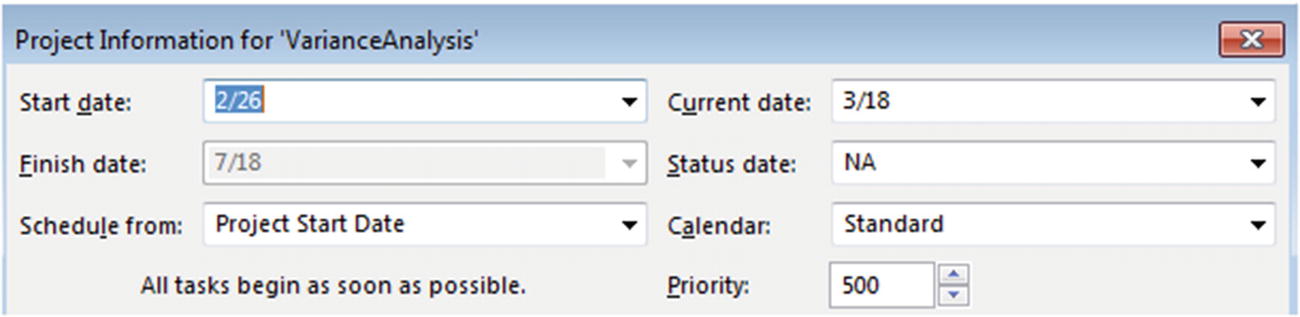 Figure 15-11
Project Information dialog box
- 2.Click Statistics… at the bottom left of your screen to see the Project Statistics summary for your project, similar to the following.
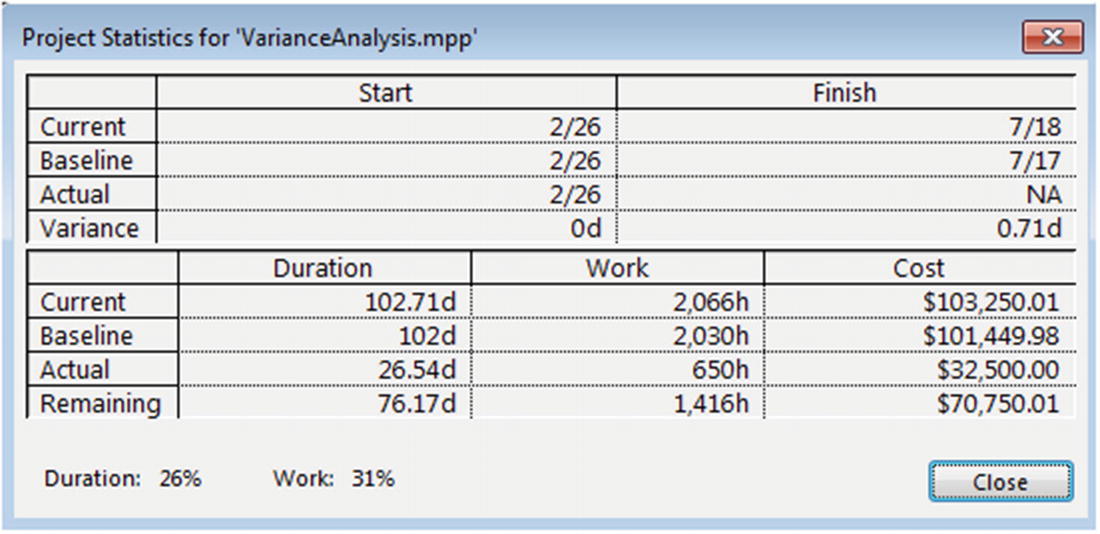 Figure 15-12
Project Statistics summary
Notice this project summary data includes % duration complete and % work complete.
- 3.
Click Close.
As vital as presenting project information is, we first have to locate it and organize it in a way that the receiver can use. Microsoft Project 2019 offers so many ways to organize information that some users are overwhelmed and have difficulty using Microsoft Project effectively as a presentation tool. The remainder of this chapter will examine how to organize and present project information useful to project stakeholders.
15.2 Using Tables, Filters, Views, and Groups in Microsoft Project 2019
Most project views include a table. A table is a set of formatting instructions that tells Microsoft Project which data fields (columns) you want displayed on the screen. The default Entry Table, for example, contains the ID, Indicators, Name (always Task Name), Duration, Start, Finish, Predecessors, and Resource Names fields. The default Cost Table contains the ID, Name, Fixed Cost, Fixed Cost Accrual, Cost (always total cost), Baseline, Variance, Actual, and Remaining (cost) fields.
Microsoft Project 2019 provides 17 predefined task tables and 10 predefined resource tables. If none of the standard tables meet your needs, you can create a new table or modify an existing one (be sure to give it a different name). When you save your project, your new or modified table is saved with the project.
If the new table would be useful to other project managers, the Project Server administrator can import it into the Enterprise Global and make it available for all enterprise projects.
Selecting the Right View
![]() In order to clearly understand the concepts presented in this chapter, it is critical that you understand the guidance offered in Section 3.3, “Navigating in Microsoft Project 2019 Views.”
In order to clearly understand the concepts presented in this chapter, it is critical that you understand the guidance offered in Section 3.3, “Navigating in Microsoft Project 2019 Views.”
As we covered in Section 3.5, “Finding the Right Information,” a view is simply a set of formatting instructions that tell Microsoft Project what you want to see on the screen. Selecting the default Gantt Chart view, for example, tells Microsoft Project you want to see a calendar bar chart on the right, a matching table (by default the Entry Table) on the left, and a list that includes All Tasks (the default filter).
Microsoft Project 2019 contains a variety of views, including sheet views, chart and graph views, and form views. Examining them will provide ideas for different presentations of project information.
The six most commonly used ones are shown in the decision tree in Section 3.5, “Finding the Right Information.” For tasks, the Gantt Chart and split Gantt Chart are very useful; for resources, the Resource Sheet and split Resource Sheet; and for assignments, the Task Usage and Resource Usage views. Microsoft Project 2019 automatically opens other views for you (e.g., custom tracking views when you set up the tracking method to be used for the project), but remembering these six views will save you valuable time.
During project execution, the Tracking Gantt Chart becomes another useful view you should remember.
These seven views, along with several new dashboard views (discussed later in this chapter), will meet most of your information presentation needs.
![]() If your organization wants to use equivalent views to those mentioned earlier for all enterprise projects, they should be created by the Project Server administrator and named “Enterprise [name of the corresponding default view].” If Project Server contains views, tables, and so on with the same names as the ones used locally, you will constantly be asked to rename or replace your local items to avoid conflict.
If your organization wants to use equivalent views to those mentioned earlier for all enterprise projects, they should be created by the Project Server administrator and named “Enterprise [name of the corresponding default view].” If Project Server contains views, tables, and so on with the same names as the ones used locally, you will constantly be asked to rename or replace your local items to avoid conflict.
What Type of Information Are You Looking For?
Each view in Microsoft Project displays a unique combination of project information. The trick to using Microsoft Project effectively is first to know what type of information you are looking for and then to know which view you can use to find this information. Once you are in the correct view, you can adjust the display to see the exact information you require.
If no view exists that comes close, you can create your own. Again, please see Section 3.3, “Navigating in Microsoft Project 2019 Views,” for a detailed overview of this subject. The following exercises will explore how these views work with enterprise (published) projects.
Standard Views
- 1.From Task:View, use the dropdown arrow to select Task Usage. Choose View:Zoom, Timescale dropdown: Weeks. Your screen will resemble the following.
 Figure 15-13
Task Usage view
The Task Usage view presents the task list just as in the Gantt Chart view, but it also shows resource assignments for each task. The right side of the view is a timephased grid, which lists the planned work for the project by default. Other fields may be added or substituted in the timephased grid, and the timescale can be changed just as in the Gantt Chart view.
- 2.If you are looking for resource information but aren’t interested in task assignments, from View:Resource Views, click Resource Sheet. Your screen will resemble the following.
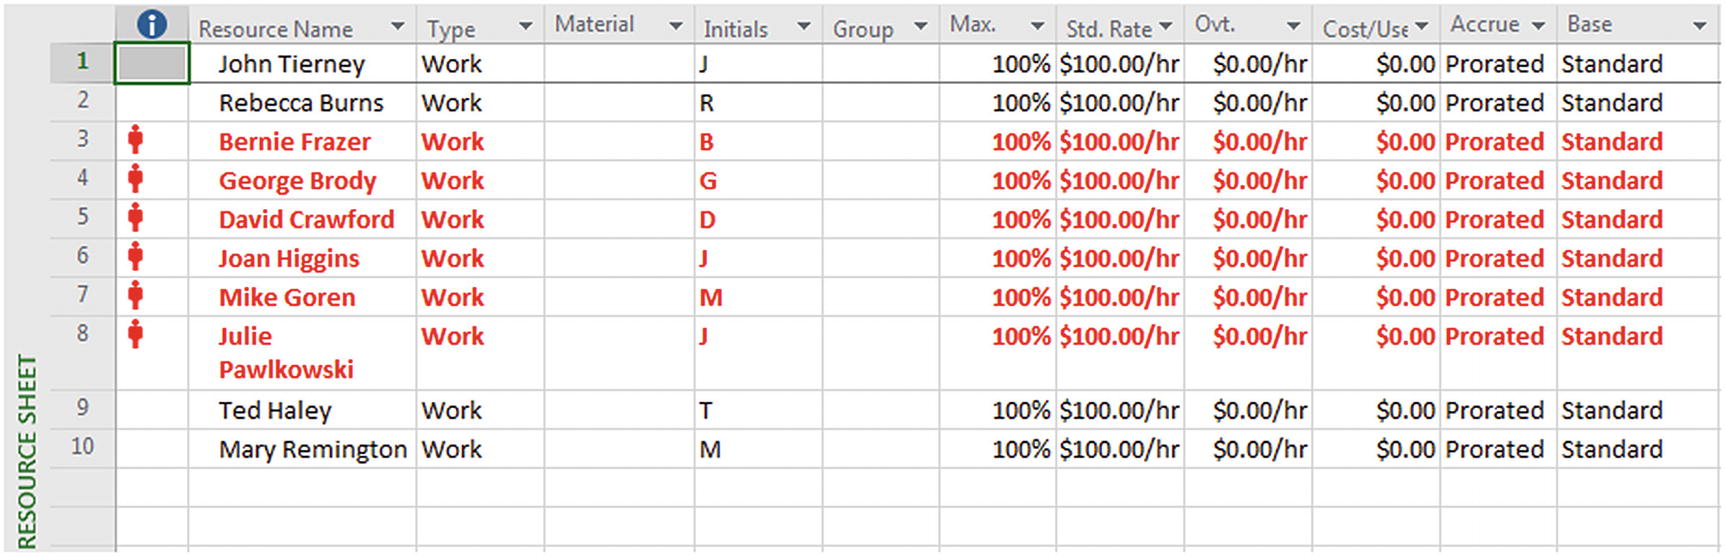 Figure 15-14
Resource Sheet view
The Resource Sheet view presents both generic and specific information about enterprise and local resources. Although task assignments are not shown, over-allocated resources are flagged in red boldface with an alert in the Indicator field.
- 3.If you require a more detailed resource view but would like a static (rather than timephased) view, from View:Split View, select the Details checkbox. You will see the Resource Form view in the lower frame with the Resource Sheet in the upper frame, as follows.
 Figure 15-15
Resource Sheet over Resource Form
This view provides the “big picture” about resources in the upper window and details about an individual’s tasks in the project in the lower window. For enterprise projects, the Resource Form includes the total work, costs, and schedule for all activities on Project Server under the category Other projects and commitments.
 Note Remember, when you are in a split window (combination) view, only half of the window is active. To make any changes, click the pane that you want to edit before typing. Clicking the appropriate pane confirms that your keystrokes and mouse clicks affect the pane you wish to modify.
Notice that changes made to enterprise resources, other than changes in the open project, will be lost when the project is saved and re-opened. Enterprise-level resource information must be changed in the checked-out enterprise resource pool by an administrator.
Also, it is best to remove the split view before applying a new view unless you wish to maintain a split window view of your schedule.
- 4.If the resource-based information you are looking for requires task assignments with details over time, remove the window split (double-click the line between the two panes), and from View:Resource Views, click Resource Usage. Choose View:Zoom, Timescale dropdown: Weeks.
 Figure 15-16
Resource Usage view
Just like the Task Usage view, the Resource Usage view lists a resource’s assignment to all other projects in total hours, along with the planned work for the tasks in the open project. Another advantage of the Resource Usage view is that it always begins with the local resource Unassigned—a handy listing of tasks in the project that have not yet been distributed to the team.
- 5.
From View:Task Views, use the Gantt Chart dropdown to select Tracking Gantt. This shows you the critical and non-critical tasks, as well as progress against those tasks. This view is truly comprehensive; it shows estimates, actuals, and baselines all on the same Gantt Chart.
As shown in the following figure, the top half of each bar represents the current estimate, with actual progress represented in a solid color and the remaining estimate shaded. Also, the bottom half of each bar represents the baseline. Finally, critical path tasks are represented in red, and non-critical tasks are blue.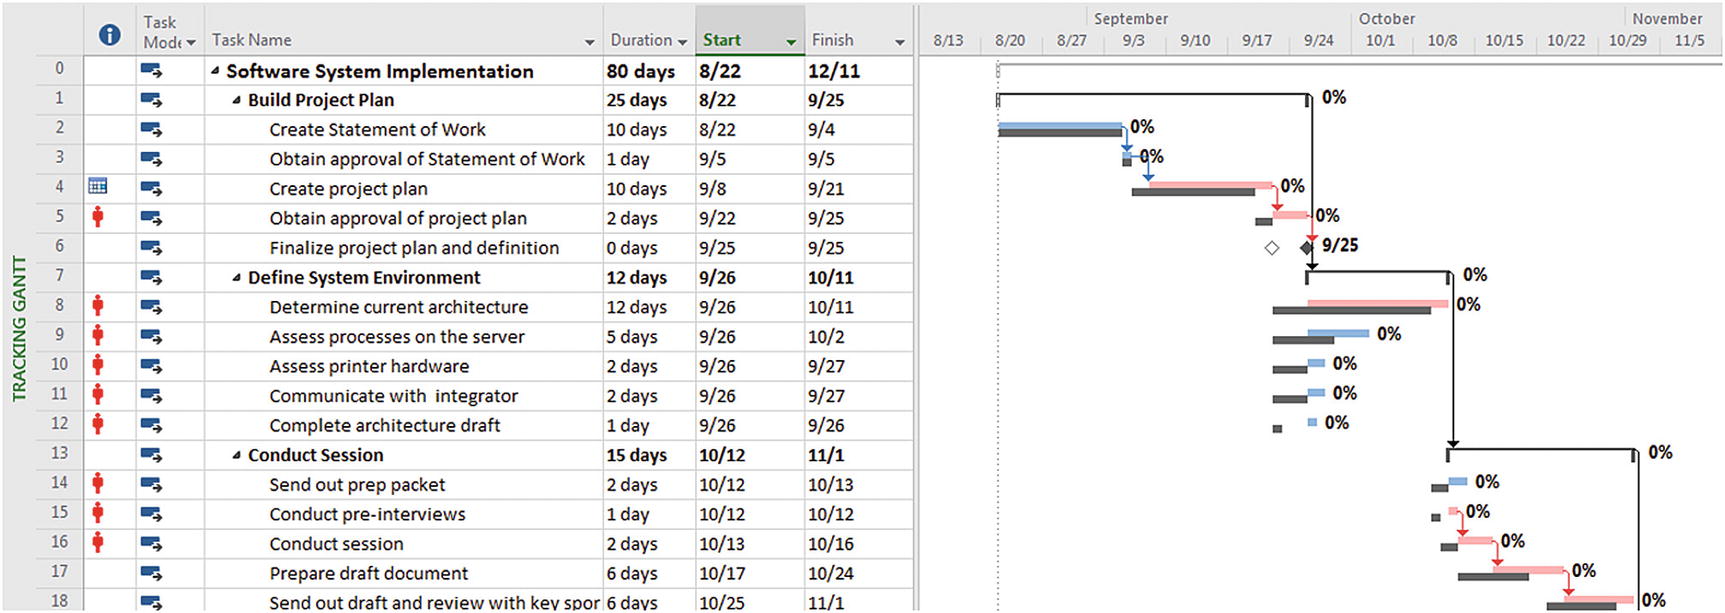 Figure 15-17
Tracking Gantt view
Customizing Tables
In the following set of exercises, you will modify an existing table, create a new table based on an existing table, modify its layout, and apply it to your project.
Modify an Existing Table
- 1.
You should be in the Gantt Chart view with the Entry Table applied. Suppose that you would like to see start variance information along with the defaults for a progress report. Move the divider to the right until you can see the Finish column.
- 2.To add the Baseline Start column between the Start and Finish columns, right-click the Finish column header. Your screen will resemble the following.
 Figure 15-18
Column commands menu
- 3.Click Insert Column to see the Column Name dropdown list.
 Figure 15-19
Column Definition dropdown list
- 4.From the Column Name dropdown list, select Baseline Start. Your screen will resemble the following.
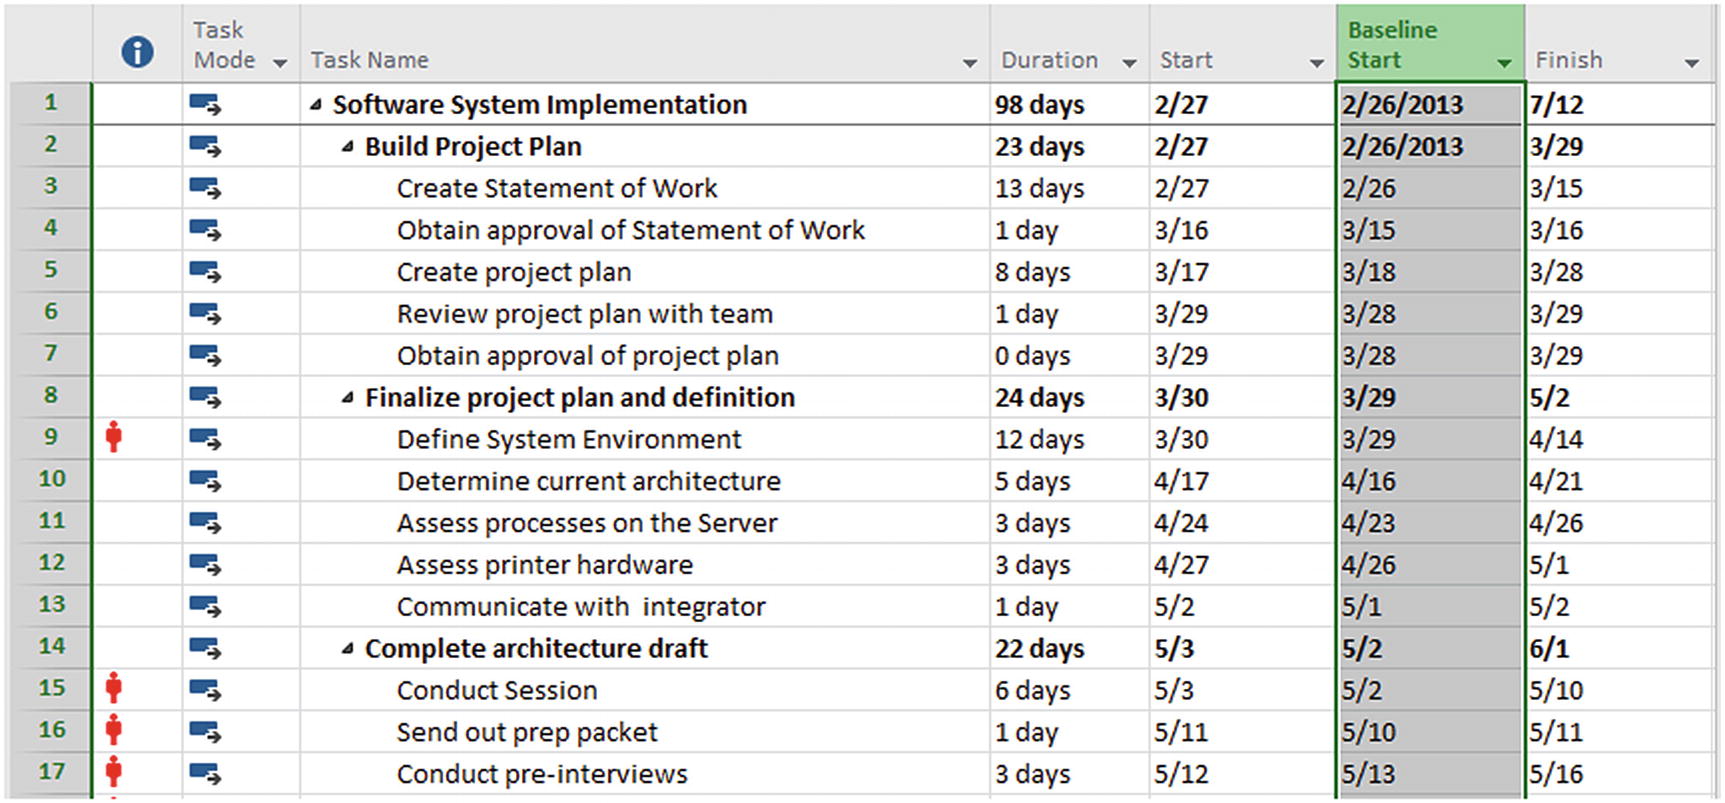 Figure 15-20
Table with new column
- 5.
Save your project.
Inserting a column works well as a temporary way to view data, but you may not want to make extensive changes or re-use the “temporary” table for every upcoming progress report. A more effective approach is to start with an existing table that is close to what you want. The following technique could also be used to start with a “blank sheet of paper” to create a table.
Copy and Customize an Existing Table
![]() In this exercise, we continue the use of the file TablesAndViews.mpp from the previous exercise. Alternatively, you can open TablesAndViews_Inst1.mpp from your exercise directory.
In this exercise, we continue the use of the file TablesAndViews.mpp from the previous exercise. Alternatively, you can open TablesAndViews_Inst1.mpp from your exercise directory.
- 1.From View:Data, select the Table dropdown and click More Tables…. You will be presented with the More Tables dialog box.
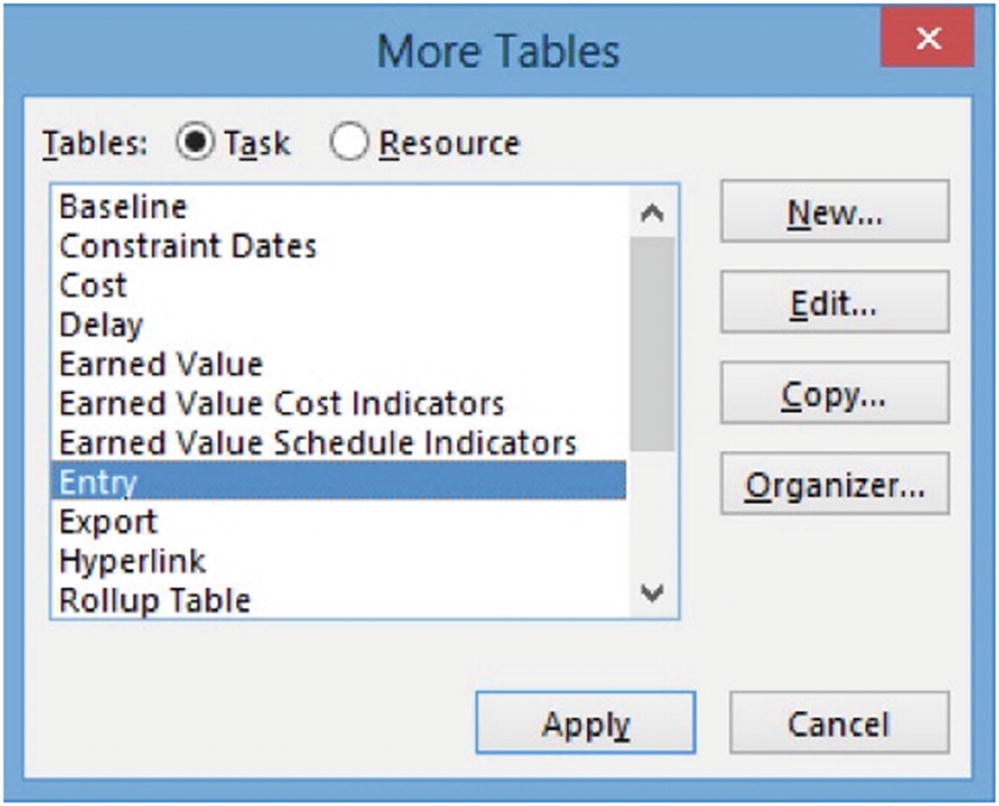 Figure 15-21
More Tables dialog box
- 2.With the Task option selected, select the Variance table and click the Copy… button. You will see a Table Definition dialog box similar to the following.
 Figure 15-22
Table Definition dialog box
- 3.
In the Name field, overwrite the existing text with “Complete Variance.”
- 4.
Select Baseline Start and click the Delete Row button. The Baseline Start row will disappear from the Table Definition dialog box.
- 5.
Delete the Baseline Finish row as well.
- 6.
Select Finish and click the Insert Row button. A blank row will appear above the Finish row.
- 7.
Use the Cut Row and Paste Row buttons to move Start Variance between Start and Finish.
- 8.
Click in the blank cell below Finish Variance and select Duration Variance from the Field dropdown list.
- 9.
In the Title field for Duration Variance, enter Duration Var.
- 10.Repeat Step 9 for Cost Variance and Work Variance. Your screen should resemble the following.
 Figure 15-23
Completed Table Definition dialog box
- 11.Click OK. The Complete Variance table will appear in the More Tables dialog box. If you would like to see it in the short list of commonly used tables, click the Edit button and, in the Table Definition dialog box, select Show in menu.
 Figure 15-24
Complete Variance table in More Tables dialog box
 Note You can specify how date fields are displayed in the table. If you keep the default option under the date format, it will use the format as defined under File:Options:General.
 - 12.
Confirm that the Complete Variance table is selected in the More Tables dialog box and click Apply. Your new table will be applied to the Gantt Chart view. Save and close your project.
Viewing Variance Data in Tables
![]() The following exercise
uses the file VarianceAnalysis-2.mpp. Ensure this file is open before beginning.
The following exercise
uses the file VarianceAnalysis-2.mpp. Ensure this file is open before beginning.
- 1.
To view cost variances in your project, use the Gantt Chart dropdown under Task:View to apply the Task Sheet view to your project.
- 2.From View:Data, use the Tables dropdown to select the Cost Table. Notice the Cost Table includes the Cost Variance field and other cost-related fields that show how the Cost Variance was calculated (i.e., Baseline Cost – Cost = Cost Variance).
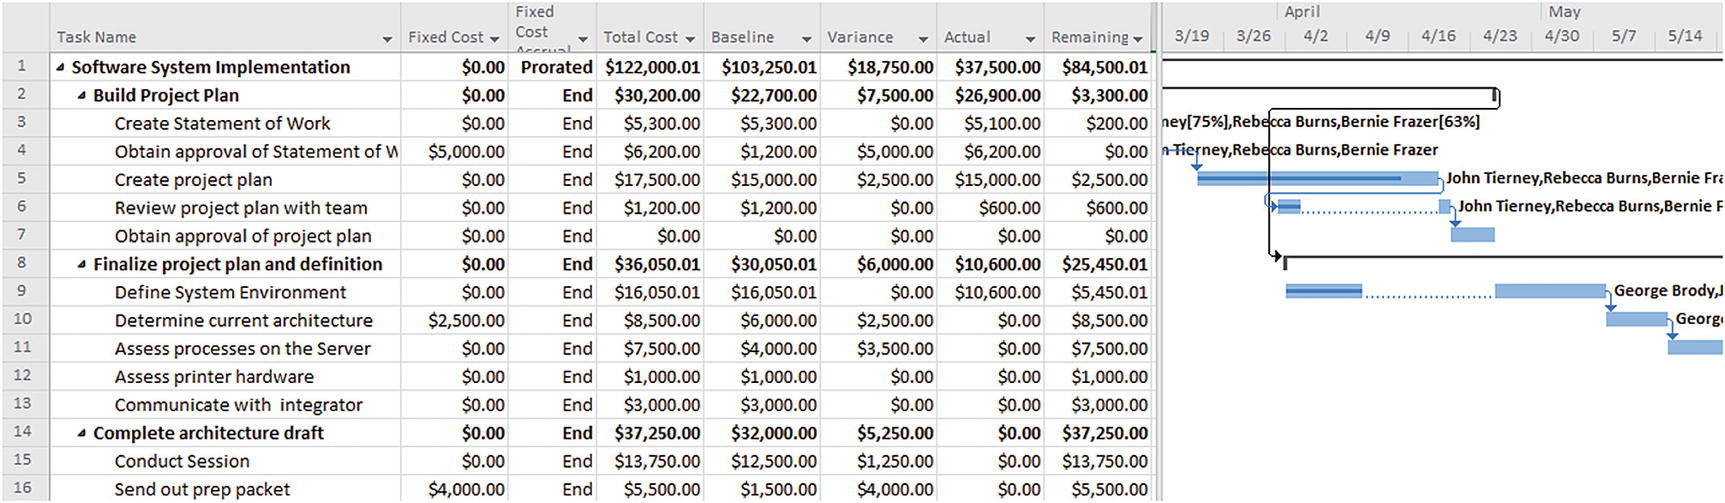 Figure 15-25
Cost Table applied
- 3.To view work variances, from View:Data, use the Tables dropdown to select the Work table. Notice the Work Table includes the Work Variance field and other work-related fields that show how the Work Variance was calculated (i.e., Baseline Work – Work = Work Variance).
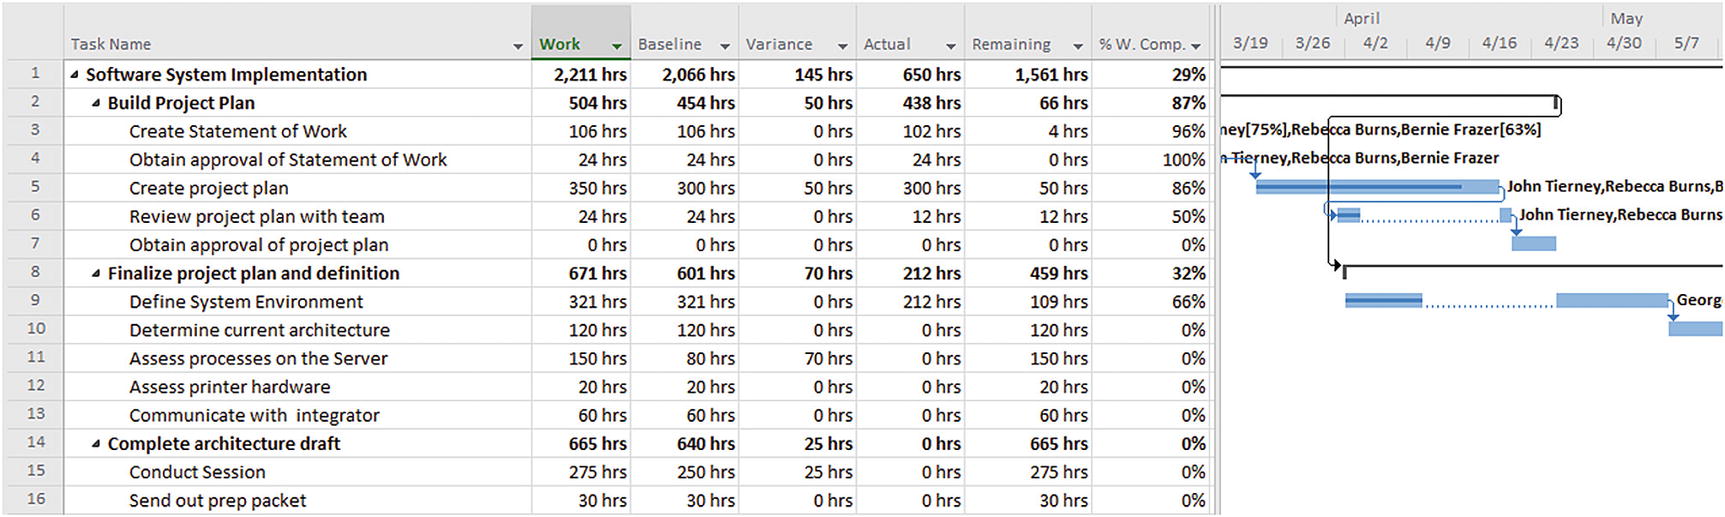 Figure 15-26
Work Table applied
- 4.To view schedule variances, go to View:Data and use the Tables dropdown to select the Variance table. Notice the Variance table includes the Start and Finish Variance fields and other schedule-related fields that show how the Start and Finish variances were calculated (i.e., Baseline Start – Start = Start Variance and Baseline Finish – Finish = Finish Variance).
 Figure 15-27
Variance Table applied
- 5.
Close your project.
Filtering Project Information
A filter is a set of formatting instructions that tells Microsoft Project which rows to display on the screen, in the same way that the table determined which columns are on the screen. If your project is especially complex with many tasks and resources, filters can help you organize your information and display a specific range of information at any time. For example, you may want to see only the tasks on your critical path, project milestones, or tasks that have not started yet.
Microsoft Project 2019 provides preconfigured filters for viewing specific task and resource details. If these filters do not match your needs exactly, you can modify an existing filter or create a brand new one.
In addition to standard filters, Microsoft Project 2019 offers AutoFilters which are visible in most sheet views.
AutoFilters
AutoFilters enable you to locate a specific type of project data quickly and efficiently. By default the AutoFilter tool is activated for each column that appears in your project table. When a particular criterion has been selected from an AutoFilter dropdown list, the dropdown arrow and column title will have a filter symbol to the right. Each type of column has a different set of AutoFilter options.
- 1.
Apply the Task Sheet view to the project.
- 2.From View:Data, click Tables, and from the dropdown list, select Cost. Your screen will resemble the following.
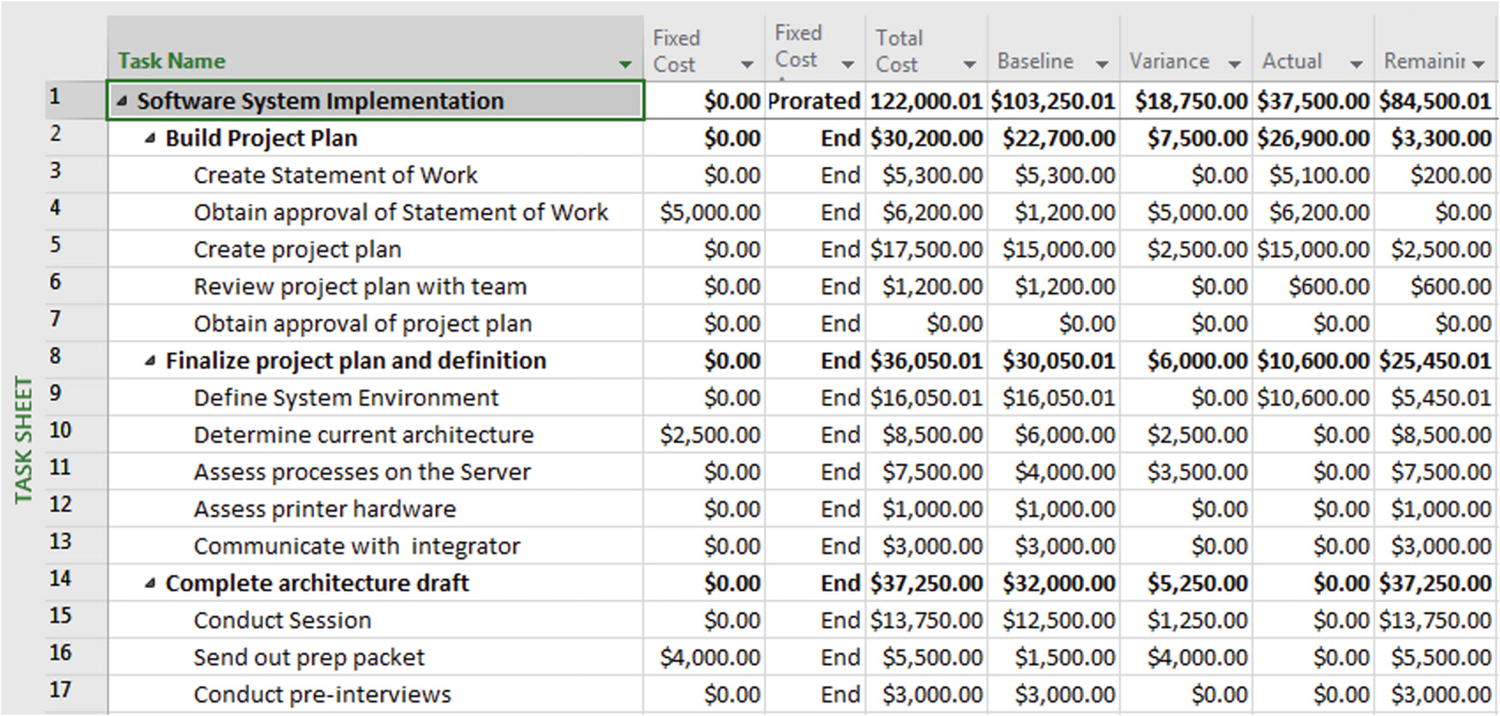 Figure 15-28
Task Sheet with Cost Table
- 3.
From View:Data, use the Filter dropdown to select Display AutoFilter. Note: This option is applied by default.
- 4.Click the AutoFilter dropdown arrow in the Baseline Variance cost column, select $1,500.00, and click OK. The Baseline Variance cost column will filter your project data for all tasks that have an estimated cost equal to $1,500.00. Note that the Baseline Variance column header has a filter symbol next to it. Your screen will resemble the following.
 Figure 15-29
Baseline cost AutoFilter ($1,500.00)
 Note An AutoFilter includes both the tasks that meet the criteria and the summary tasks associated with them—the outline structure is maintained.
 - 5.
Again, select the Baseline AutoFilter dropdown, and click Select All and then OK. The column’s original data will reappear.
![]() A caution when using AutoFilter: It is possible for an AutoFilter selection to be active, yet the field on which the AutoFilter applies may not be displayed on the screen. In this case, it is not obvious why some tasks are not being displayed. A good practice when working with AutoFilter is to periodically deselect and reselect the AutoFilter option. This has the effect of removing any forgotten, residual AutoFilter selections.
A caution when using AutoFilter: It is possible for an AutoFilter selection to be active, yet the field on which the AutoFilter applies may not be displayed on the screen. In this case, it is not obvious why some tasks are not being displayed. A good practice when working with AutoFilter is to periodically deselect and reselect the AutoFilter option. This has the effect of removing any forgotten, residual AutoFilter selections.
Creating a Custom Filter
![]() This exercise continues the use of the file Filters.mpp. If it is not already open, please open it now.
This exercise continues the use of the file Filters.mpp. If it is not already open, please open it now.
- 1.
Ensure your project is open in the Gantt Chart view with the Entry Table applied.
- 2.From View:Data, select New Filter from the Filter dropdown list. You will see the Filter Definition dialog box.
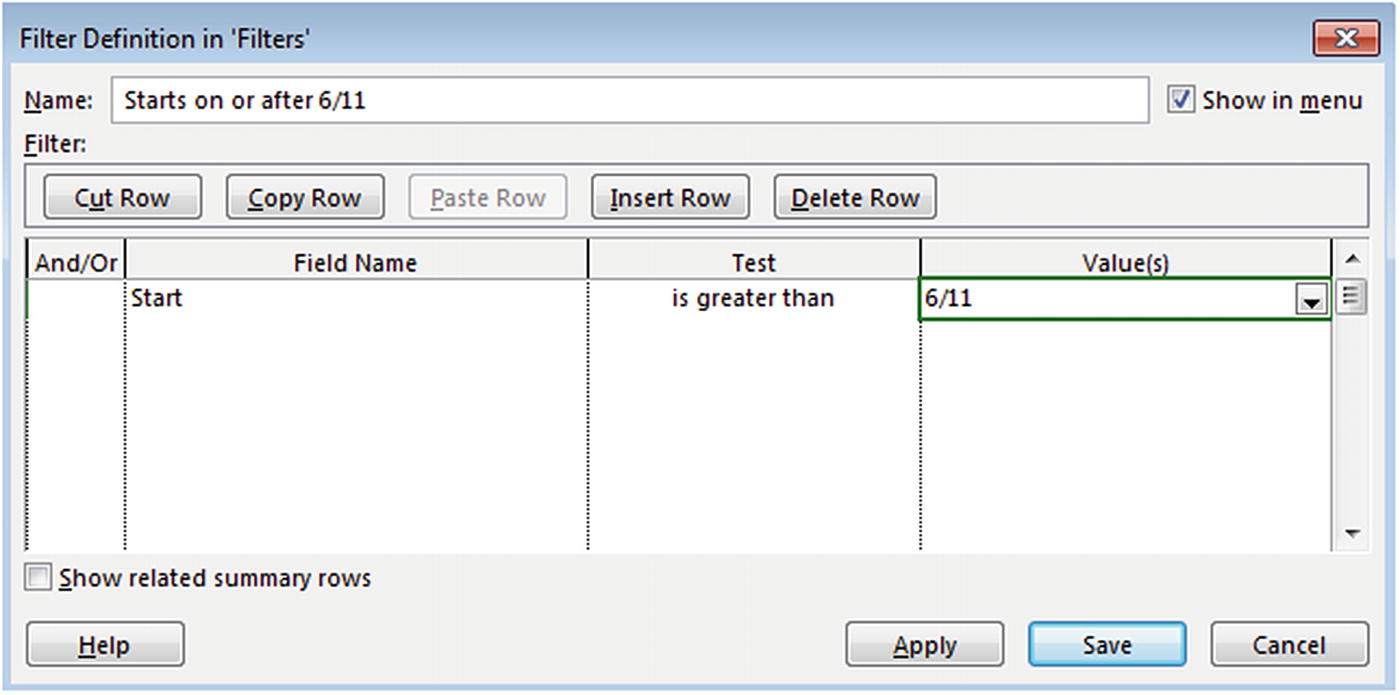 Figure 15-30
New Filter Definition dialog box
- 3.
In the Name field, replace the existing text with “Starts on or after 6/11.”
- 4.
From the Field Name dropdown list, select Start.
- 5.
From the Test dropdown list, select is greater than or equal to.
- 6.In the Value(s) field, enter “6/11” and click Apply. Your new filter will appear in the Filters menu dropdown.
 Figure 15-31
New filter in Filters dropdown menu
- 7.Select this filter on the Filters dropdown menu. All tasks that are scheduled to start on or after 6/11 are displayed. Note: Only summary tasks that independently meet the filter criteria are displayed (in this case, no summary tasks are displayed).
 Figure 15-32
Filter applied
- 8.
Save your project.
Creating a New Filter by Copying an Existing Filter
![]() This exercise continues the use of the file Filters.mpp from the previous exercise. Alternatively, you can open Filters_Inst1.mpp.
This exercise continues the use of the file Filters.mpp from the previous exercise. Alternatively, you can open Filters_Inst1.mpp.
- 1.
From the Filter dropdown, select [No Filter] to clear your filter.
- 2.
From the Filter dropdown, select More Filters….
- 3.
In the More Filters dialog box, select Starts on or after 6/11 and click Copy….
- 4.
In the Name field of the Filter Definition dialog box, replace the existing text with “Starts on or after 6/11 and finishes before 7/31.”
A filter can contain more than one condition; the And/Or field determines the relationship of the various criteria. If you select the value And, then both conditions must be true in order for the task or resource to be displayed. If you select the value Or, either condition can be true and the task or resource will be displayed.
- 5.
In the second row of the And/Or column, select And.
- 6.
In the same row, select Finish from the Field Name dropdown list.
- 7.
In the same row, use the Test dropdown list to select is less than.
- 8.In the same row, enter into the Value field “7/31.” The Filter Definition dialog box will resemble the following.
 Figure 15-33
Existing filter copied and modified
- 9.
Click Save.
- 10.Select this filter on the Filters dropdown menu. Your screen will resemble the following.
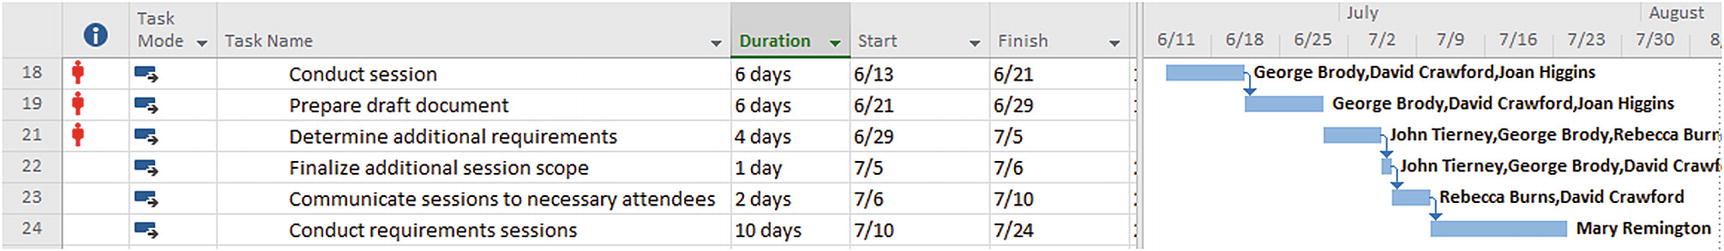 Figure 15-34
Combined filter results
- 11.
From the Filter dropdown, again select [No Filter] and save your project.
Value Lists in Filters
When you created a filter in Microsoft Project 2013 or earlier, the Value(s) field did not allow you to choose values from a pick list. For example, if you had defined the Text 1 field to include a pick list with the values of A, B, and C and wanted to create a filter that found all tasks with the letter A in the Text 1 field, you would have had to remember what value you want to filter for and typed it into the Value(s) field.
This wasn’t too hard to manage if your value pick lists were simple. However, with hierarchical fields, remembering exactly what value to enter into your filter could be difficult. In Microsoft Project 2019, you can use a pick list to select the value(s) for your filters by entering the custom field in the Value(s) area.
Filters can be specific or interactive. Interactive filters prompt you for information during the process, so you can specify criteria for each search.
Creating a Custom Interactive Filter
The predefined interactive filters that ask for information in Microsoft Project may not always meet your requirements, so you may want to create a custom interactive filter.
- 1.
Confirm you are in the Gantt Chart view with the Entry Table applied.
- 2.
The date range filter you wrote earlier was useful, but you have decided it would make more sense to be able to re-use it by entering the “Starts after” and “Finishes on or before” dates. From the Filter dropdown list, select More Filters…. You will be presented with the More Filters dialog box.
- 3.
Select the Starts on or after 6/11 and finishes before 7/31 filter and click Edit…. The Filter Definition dialog box will appear.
- 4.
In the Filter Definition dialog box, change the Name field to “Starts on or after and finishes before.”
- 5.In the Value(s) field for the Start line, type “Enter the start date”? (include the quotation and question mark after the double quotes), and in the Value(s) field for the Finish line, type “Enter the finish date”? The text contained within the quotes is what you will be prompted for when the filter is applied, and the question mark tells Microsoft Project this is an interactive filter. Your screen will resemble the following.
 Figure 15-35
Interactive filter definition
- 6.
Click Save. In the More Filters dialog box, ensure the new filter is selected and click Apply. You will be prompted to enter a start date; enter “6/11” and click OK. Notice that there is a dropdown calendar you can use to select the date, if you prefer.
- 7.
You will be prompted to enter a finish date; enter “7/7” and click OK.
- 8.You will again see only those tasks that meet the selected parameters. Your screen will resemble the following.
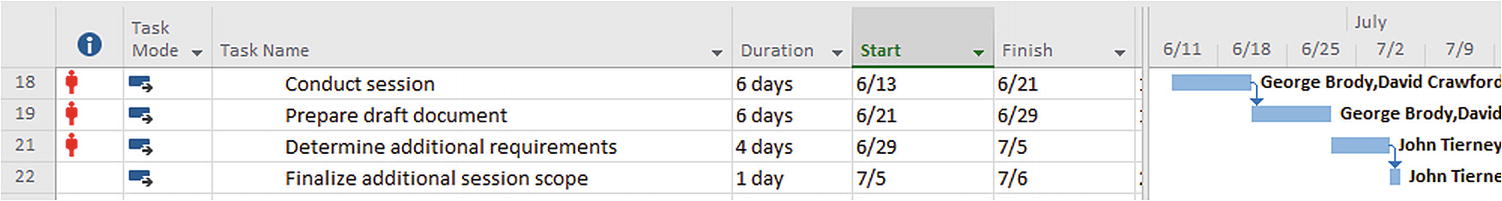 Figure 15-36
New filter applied
- 9.
Save your project.
Applying a Highlighting Filter
By default, whenever you apply a filter to your project, the tasks or resources that do not fit the filter criteria are hidden. However, if you want to view all of the tasks in your project and simply distinguish which tasks do and don’t fit the filter, Microsoft Project 2019 enables you to apply a highlight filter to your tasks.
- 1.
Ensure you are in the Gantt Chart view with the Entry Table applied. From the Filter dropdown list, again select [No Filter] to provide an unfiltered view of your project.
- 2.In View:Data, click the Highlight dropdown list. You will see the following options.
 Figure 15-37
Highlight dropdown list
- 3.
Click the Starts on or after and finishes before filter.
- 4.
When prompted, provide a Start date of “6/2” and Finish date “6/30.”
- 5.Tasks that meet the established criteria will now be highlighted, as shown in the following figure.
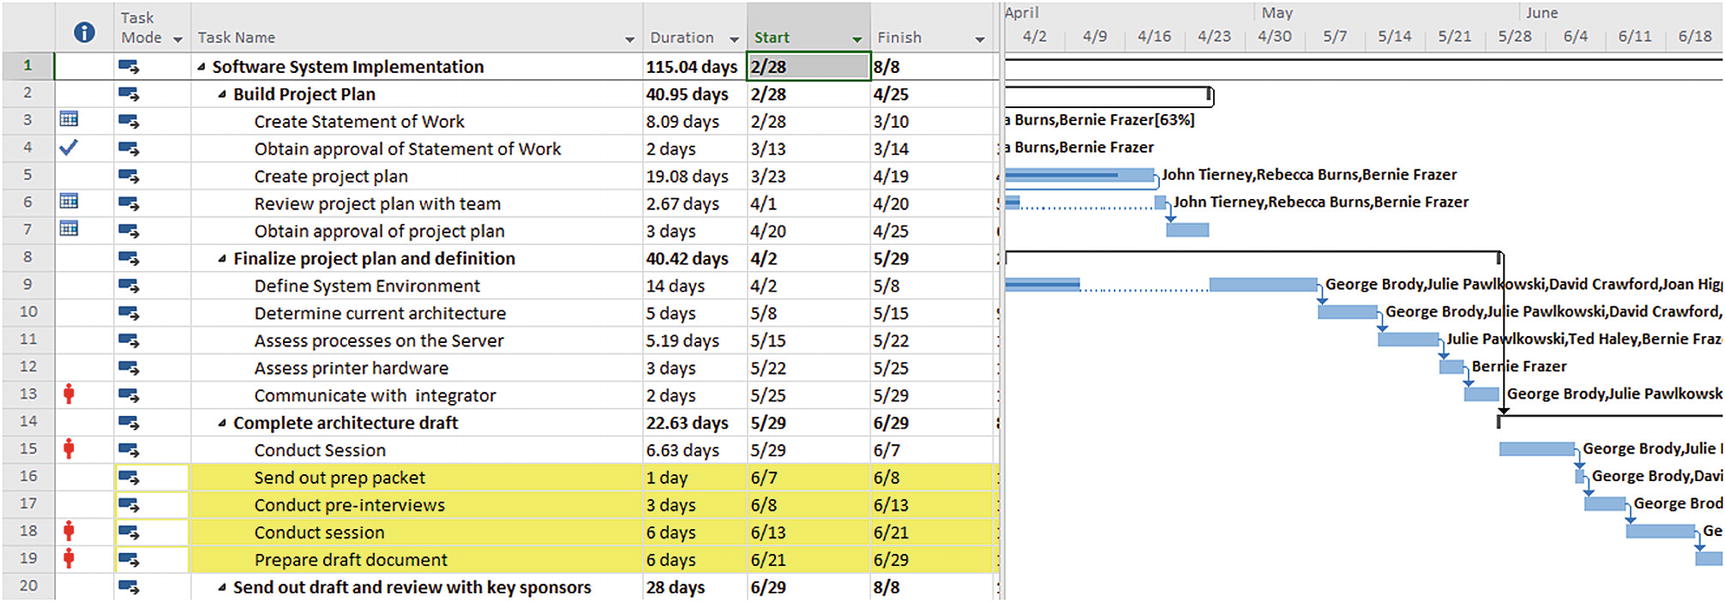 Figure 15-38
Highlighted tasks
- 6.
From the Filter dropdown list, again select [No Filter] to restore the original appearance.
- 7.
Save your project.
Microsoft Project 2019 has additional uses for the filtering function. For example, the Assign Resources dialog box includes a Resource list options feature that includes a filtering capability. Resources can be filtered by their availability to work a certain number of hours, or they you can use a number of built-in resource filters.
Project Web App views offer many of the same filtering options, with the exception of interactive and highlight filters.
Sorting Project Information
By default, Microsoft Project 2019 displays the tasks and resources in your project from lowest to highest ID number. You can sort tasks or resources by other criteria such as task name, deadline, and resource name. Sorting can add value when you need to see tasks in a particular sequence.
Sort the Task List
- 1.
Apply the Task Sheet view to your project and then apply the Cost Table.
- 2.
From View:Data, use the Sort dropdown to select by Cost. The summary tasks in your project will be sorted by descending cost and the tasks within each summary will be sorted by descending cost.
Sort by Multiple Fields
- 1.
From View:Data, use the Sort dropdown to select Sort By…. You will see the Sort dialog box.
- 2.
Choose Cost in the Sort by dropdown.
- 3.
Next to the Sort by field, select the Ascending button.
- 4.From the Then by dropdown list, choose Duration and select the Descending button.
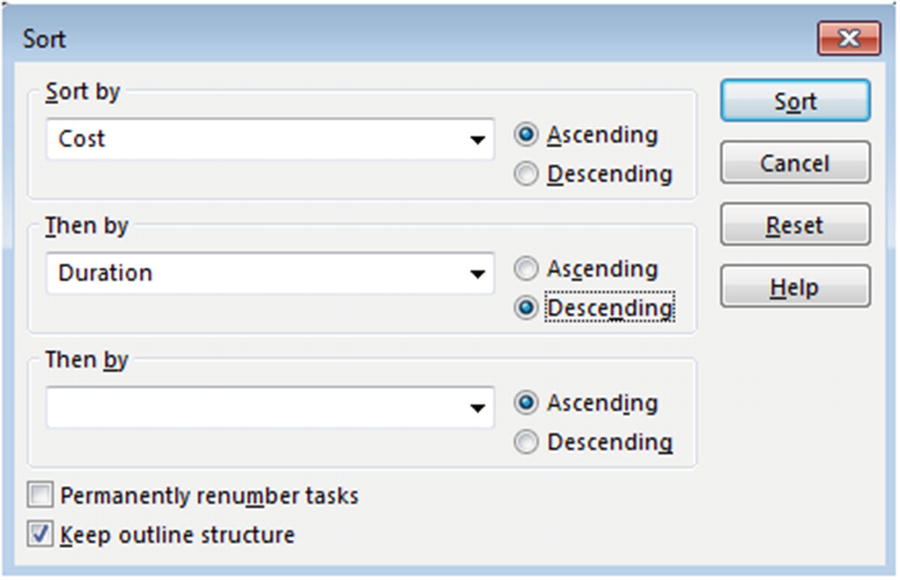 Figure 15-39
Sort dialog box
- 5.Click Sort. Your screen will resemble the following (insert the Duration field next to the Total Cost column to see how the dual sort works).
 Figure 15-40
Sorted by ascending cost and descending duration
Note You may wish to insert the Duration field to validate your results.
- 6.
From the Sort dropdown, select by ID to restore the original task order to your project.
- 7.
Save your project.
Grouping Project Information
Grouping allows a project manager to view tasks or resources in predefined or customized “sets.” Grouping creates new summary tasks to show rolled-up totals. Microsoft Project 2019 allows you to group based on assignment fields as well as tasks or resources in Usage views. The dialog box has a checkbox option for Group assignments, not Tasks (in a Task Usage view) or Group assignments, not Resources (in a Resource Usage view). All assignment timephased fields are rolled up to summary tasks except for Cumulative % Complete, Over-allocation, Peak Units, and Percent Allocation.
- 1.
Apply the Task Sheet view with the Entry Table selected.
- 2.From View:Data, use the Group by dropdown list to select Duration. Your screen should resemble the following figure.
 Figure 15-41
Project grouped by duration
- 3.
From View:Data, use the Group by dropdown list to select [No Group] to restore the original view.
- 4.
Apply the Resource Usage view.
- 5.From View:Data, use the Group by dropdown list to select Resource Group. Collapse the assignment information for each resource so that all assignments are hidden (Hint: Click the black triangle next to each resource’s assignments). Your screen will resemble the following figure.
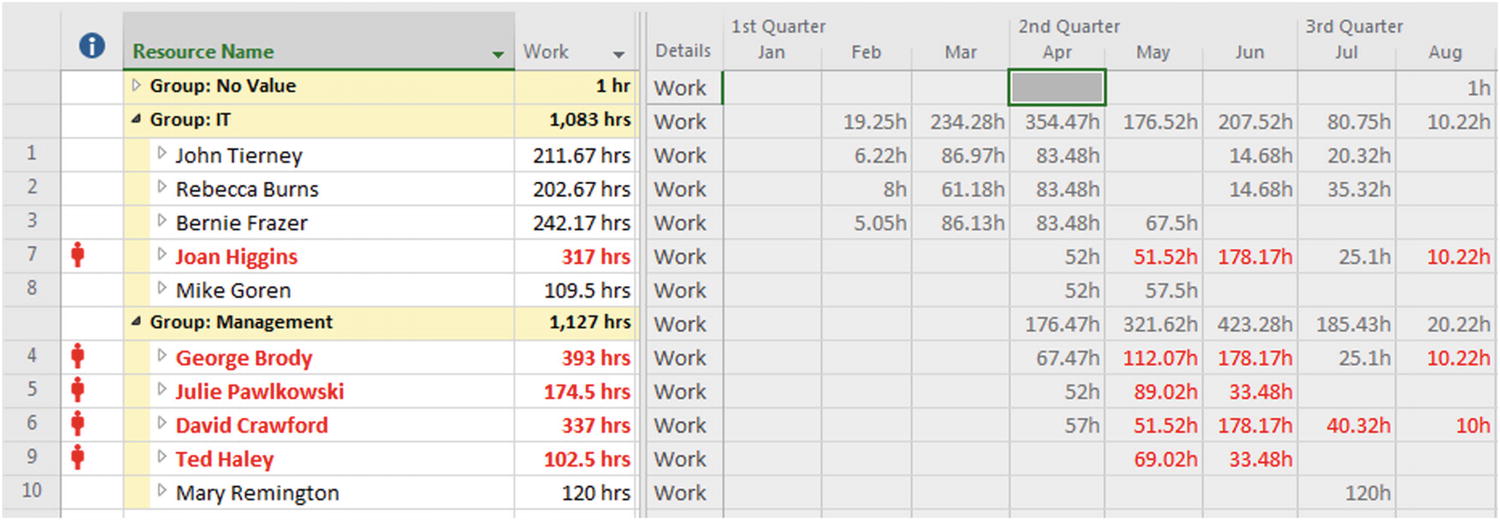 Figure 15-42
Resource Usage view grouped by resource group
- 6.
Grouping can be customized just like filtering and sorting.
- 7.Apply the Gantt Chart view. From the Group dropdown, select New Group By… to see the Group Definition dialog box.
 Figure 15-43
Group Definition dialog box
- 8.Click in the Field Name column in the Group By row, and select Start from the dropdown list. Click Apply. Your screen should resemble the following figure.
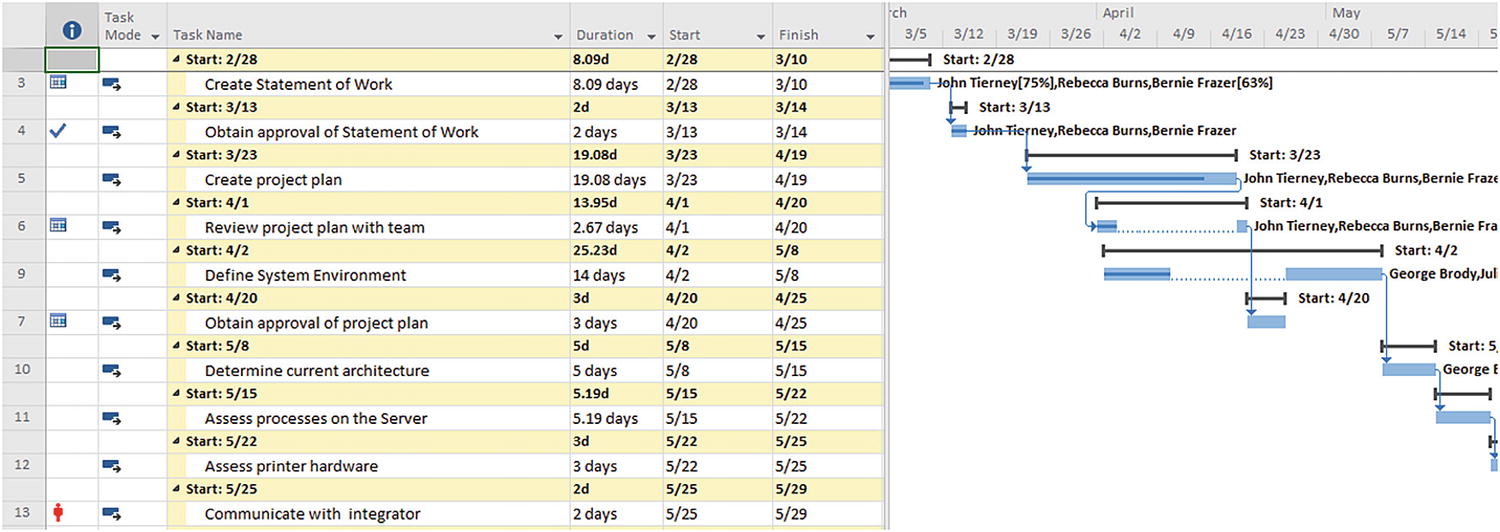 Figure 15-44
Tasks grouped by start date
- 9.
From the Group dropdown, select [No Group] to return to the original view and save your project.
Microsoft Project Server/Project Online Grouping Styles
Project Web App views also offer grouping as a tool to clarify and evaluate the information contained. The Microsoft Project Server administrator can set colors for different grouping levels in the views as well as set the color and font style of the text displayed inside the cells.
Defining Custom Views
If none of the views included with Microsoft Project meet your needs, you can create a new view or modify an existing one. When you save your project, your new or modified view is saved with the project. In the following exercises, you will create a new single view and a new combination view, a split screen combination of two single views.
Creating a New View
- 1.
From View:Task Views, click Other Views and then More Views…. You will be presented with the More Views dialog box.
- 2.In the More Views dialog box, click New… to see the Define New View dialog box.
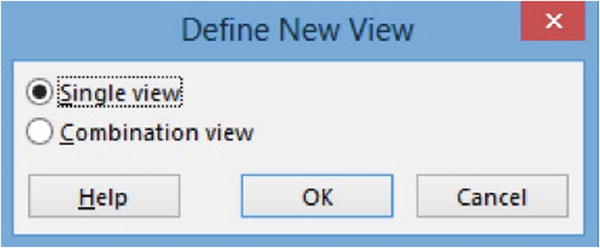 Figure 15-45
Define New View dialog box
- 3.Ensure the Single view default option is selected, and click OK to see the View Definition dialog box.
 Figure 15-46
View Definition dialog box
- 4.
In the Name field, replace the existing text with “Cost Variance.”
- 5.
From the Screen dropdown list, select Task Usage.
- 6.
From the Table dropdown list, select Variance.
- 7.
From the Group dropdown list, select No Group.
- 8.
From the Filter dropdown list, select Cost Greater Than….
- 9.
Select the Highlight Filter checkbox so that Microsoft Project distinguishes your filtered data from the rest of the data in the view.
- 10.
Select the Show in menu checkbox so that your new view will be easy to access from the View ribbon.
- 11.
Click OK. Confirm that Variance is selected in the More Views dialog box.
- 12.In the More Views dialog box, click Apply. Enter “5000” in the interactive filter box (Cost greater than) that appears, and click OK. Your screen will resemble the following.
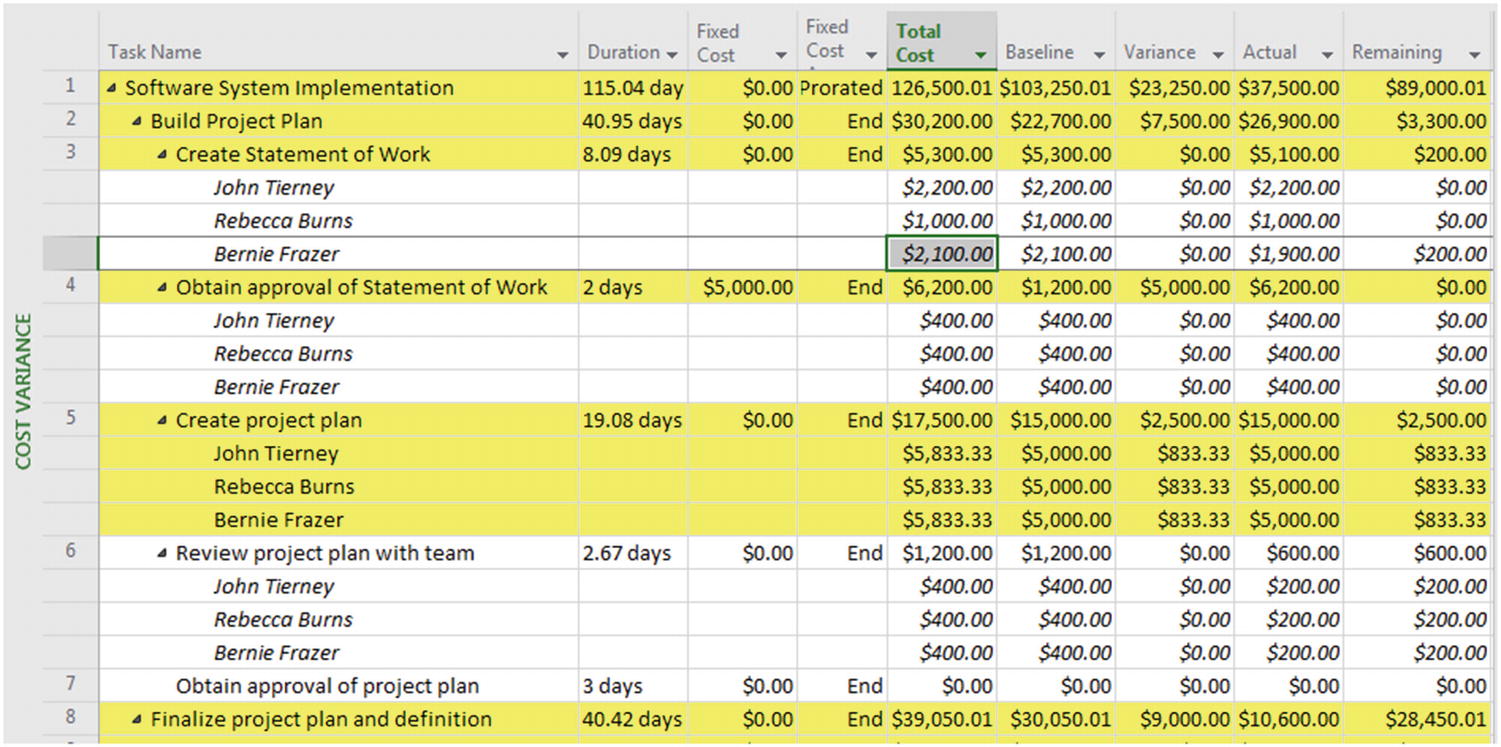 Figure 15-47
Variance custom single view
- 13.
Save your project.
Creating a Combination View
- 1.
From View:Task Views, click the Other Views… dropdown and select More Views….
- 2.
In the More Views dialog box, click New.
- 3.
In the Define New View dialog box, select the Combination view option button and click OK.
- 4.
In the View Definition dialog box, replace the existing text in the Name field with “Resource Allocation Diagram.”
- 5.
From the Primary View dropdown list, select Resource Usage.
- 6.From the Details Pane dropdown list, select Resource Graph. Your screen will resemble the following.
 Figure 15-48
View Definition (Combination view)
- 7.Click OK, confirm that Variance Diagram is selected in the More Views dialog box, and click Apply. Your screen will resemble the following.
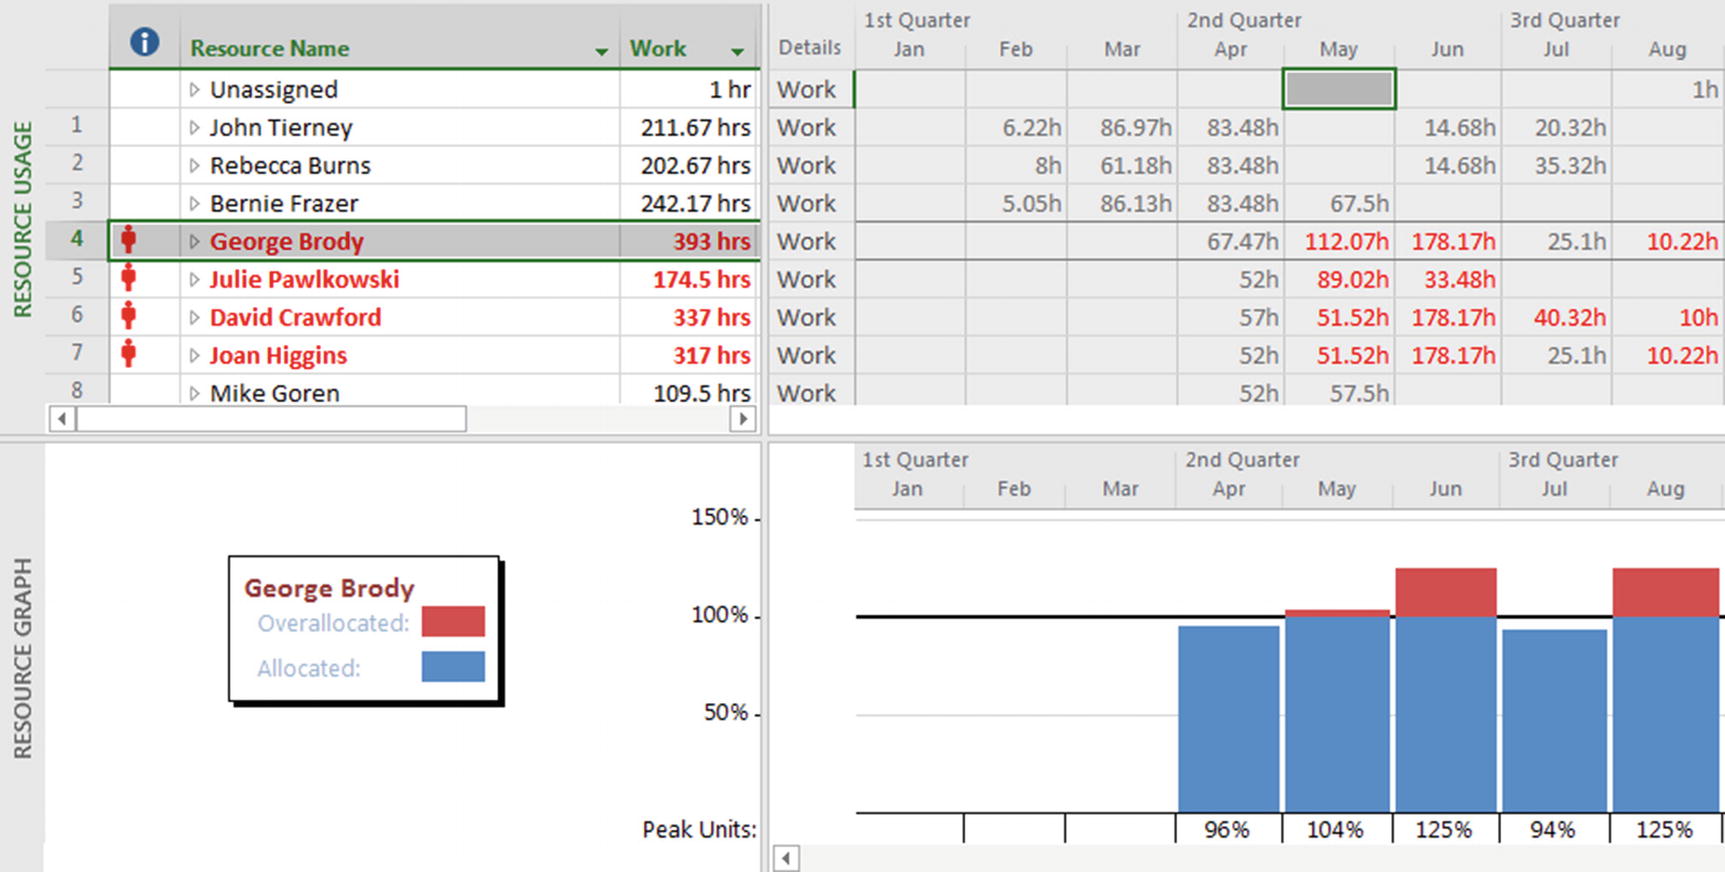 Figure 15-49
Resource Allocation Diagram (Custom combination view)
- 8.
Save and close your project.
15.3 Defining and Using Custom Fields
Local custom fields – These are fields that can be set up by the project manager within a project plan and shared across other project plans using the Organizer and the Global.mpt. We will cover the Organizer and Global.mpt in greater depth later in this chapter.
Enterprise custom fields – These are fields set up by the Project Server administrator that can be used across all projects that are saved and published on Project Server.
This chapter focuses on the use of local custom fields.
- 1.From Format:Columns, click the Custom Fields icon [
 ]. You will see the Custom Fields dialog box.
 Figure 15-50
Custom Fields dialog box
Notice that Task, Resource, and Project fields are available. A custom Task field will be assigned to every task in a project; a custom Resource field will be assigned to every resource; and a custom Project field will be assigned only to the project summary task (title). Project fields are applicable only as enterprise tools.
- 2.Click the dropdown arrow by the Type field to see the related options, per the following figure.
 Figure 15-51
Type dropdown list
Most of the field types are self-explanatory: Cost fields contain costs, Date fields contain dates (including the Start and Finish fields), and so on. Two fields, however, may not be self-explanatory:Flag fields are yes/no fields used to mark any kind of status. They are No by default and can be changed to Yes to mark the task, resource, or project.
Outline Code fields are hierarchical fields used to describe something like the location of a task or resource. The outline format allows you to specify information such as country, state, and city in a geographical or location description.
Notice that the commands below the window allow you to rename a field (which then displays the field both by its generic name and by the new name in field lists) or to define the contents and presentation of information. We will explore these options later.
- 3.
In the Custom Fields dialog box, ensure the Task option is selected and select Number from the Type dropdown list. Note that all Enterprise fields of this type (Number) are listed, as well as the local fields (Number 1, Number 2, etc.). You cannot change the details of these enterprise fields here, but you are able to see their parameters.
- 4.Next, from the Field list, select Number 1 and click Rename. You will see the Rename Field dialog box.
 Figure 15-52
Rename Field dialog box
- 5.
We want to use this field to assign a hazard level to tasks involving flammable or toxic materials, so in the Rename Field dialog box, rename Number 1 as Hazard, and click OK.
- 6.Note that Hazard (Number 1) now appears in the list of available fields in the Custom Fields dialog box. The Hazard level will be assigned as follows: 0 indicates no known hazard, while 3 indicates a hazard requiring the highest level of safety precautions. To allow users to properly assign a Hazard level, ensure the Hazard (Number 1) field is selected, and then click Lookup to see the Edit Lookup Table for Hazard dialog box.
 Figure 15-53
Edit Lookup Table for Hazard dialog box
- 7.
In this dialog, enter 0, 1, 2, and 3 in the Value column, using Enter to move from one row to the next. You can also add descriptive information about each of the values noted. This additional information is not saved with a project but may be useful at the time the selection is being made. Because we want the default value for the Hazard field to be 0, click Use a value from the table as the default entry for the field, select 0, and click Set Default. Now click Close, and then click OK to accept the changes made in the Custom Fields dialog box.
- 8.In the Gantt Chart view for your sample project, right-click the column header Duration and select Insert Column. From the list of fields, select the new Hazard field as indicated in the following figure.
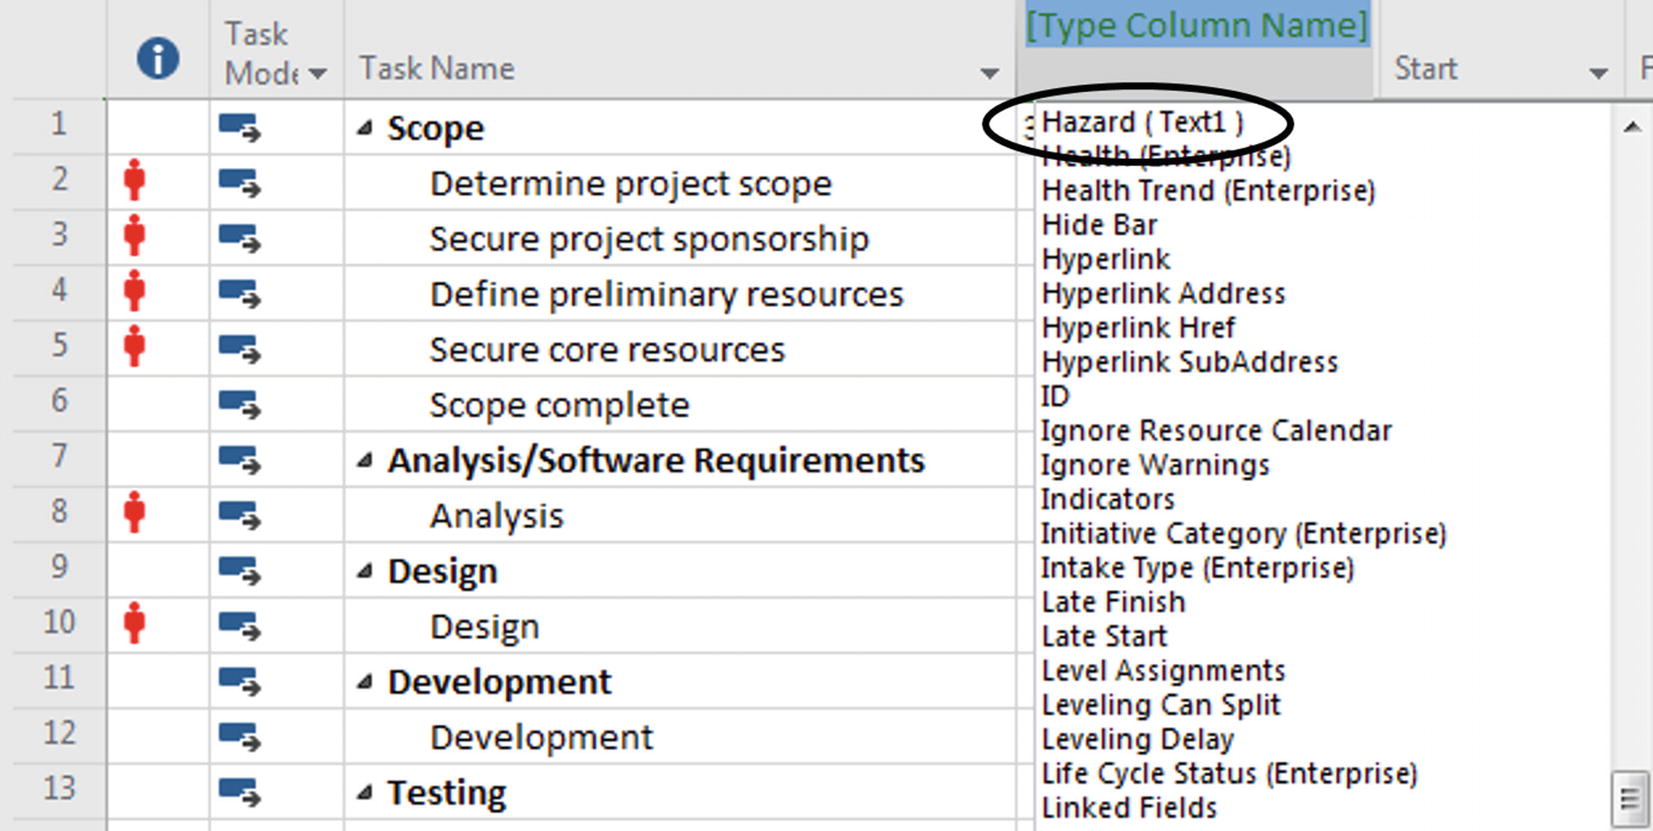 Figure 15-54
Selecting the Hazard field
Notice that if you scroll through the field names, you will also see your new field listed as Number 1 (Hazard), a result of renaming the field.
If you insert a new column in this manner while in an Enterprise view (such as the Enterprise Gantt Chart view) that has been defined in the Enterprise Global, Microsoft Project will warn you that these changes won’t be saved. The normal Gantt Chart view, however, is local and not defined in the Enterprise Global—you can modify it at will. Changes will be saved as part of your local Global.mpt.
- 9.The new Hazard field will be inserted as a column in the Entry Table. Click the dropdown arrow in the Hazard cell associated with one of the tasks to see the values you established, as in the following figure.
 Figure 15-55
Dropdown values for custom Hazard field
A Project Server administrator can make a local field an enterprise field. It’s generally considered a best practice to first create a field and make sure it works correctly in a project, and then add it to the Enterprise Global.
- 10.Re-open the Custom Fields dialog box, select the field you just created (Hazard), and click Add Field to Enterprise. If you are an administrator, you will see the Add Field to Enterprise dialog box, which asks you to confirm or edit the Field Name and the Lookup Table Name.
 Figure 15-56
Add Field to Enterprise dialog box
- 11.
In this case, there is no look-up table so the Lookup Table Name should be deleted and left empty. Click OK. Microsoft Project will confirm the field has been successfully added as an enterprise field to Project Server. Note: Generally only administrators are able to add custom fields to the enterprise.
In addition to custom fields, administrators can create filters, tables, views, and base calendars at the enterprise level by modifying the checked-out Enterprise Global.
To use any new Enterprise Global features, changes to the Enterprise Global must be saved and the project must be checked in; you then must exit from and restart Microsoft Project to refresh the cached enterprise data. It’s easy to overlook this feature and think you have not successfully changed the Enterprise Global when the new field you just created can’t be seen!
In contrast to some of the earlier versions Microsoft Project, all types of custom fields are now available for use in portfolio management.
The Organizer and Sharing Custom Objects
Microsoft Project 2019 enables you to share custom objects between projects through the Organizer. The simplest and easiest way to distribute your custom objects to your other project files is to copy the objects from your individual project file to the local Global.mpt file. The Global.mpt is a file that Microsoft Project uses as a template to store a master copy of all your custom objects.
Objects | Availability |
|---|---|
Views, Tables, Filters, Calendars, Reports, Custom Fields, Groups | Generally, any changes you make to views, tables, filters, calendars, reports, and forms are “local” and only occur in the active project file. When you open a new project file, it only contains the native Microsoft Project defaults for those elements, which are saved in the global file. |
Import/export maps | Conversely, any changes you make to import and export maps are global, in that the changes affect the global file and apply to all project files on your computer. When you open a new project file, it contains your customized import and export maps. |
Visual Basic modules | Changes you make to Visual Basic modules can be either global or local, according to your preference. |
Format settings | When you change format settings (such as bold, italic, color, or bar shape), those settings apply only to the active project file and not to other project files on your computer. |
Using the Organizer, you can also manually copy customized objects from one open project to another. For example, if someone sends the Project Server administrator an .mpp file with a new custom table or view, the administrator can easily copy it into the checked-out Enterprise Global (making sure that the name does not conflict with the defaults) to make it available to all enterprise projects.
- 1.Open a project that is published to Project Server and click the File tab to see the following options (Info is selected by default).
 Figure 15-57
Info page
- 2.Click the Organizer button, and from the two available options, select Organizer. You will see the Organizer dialog box.
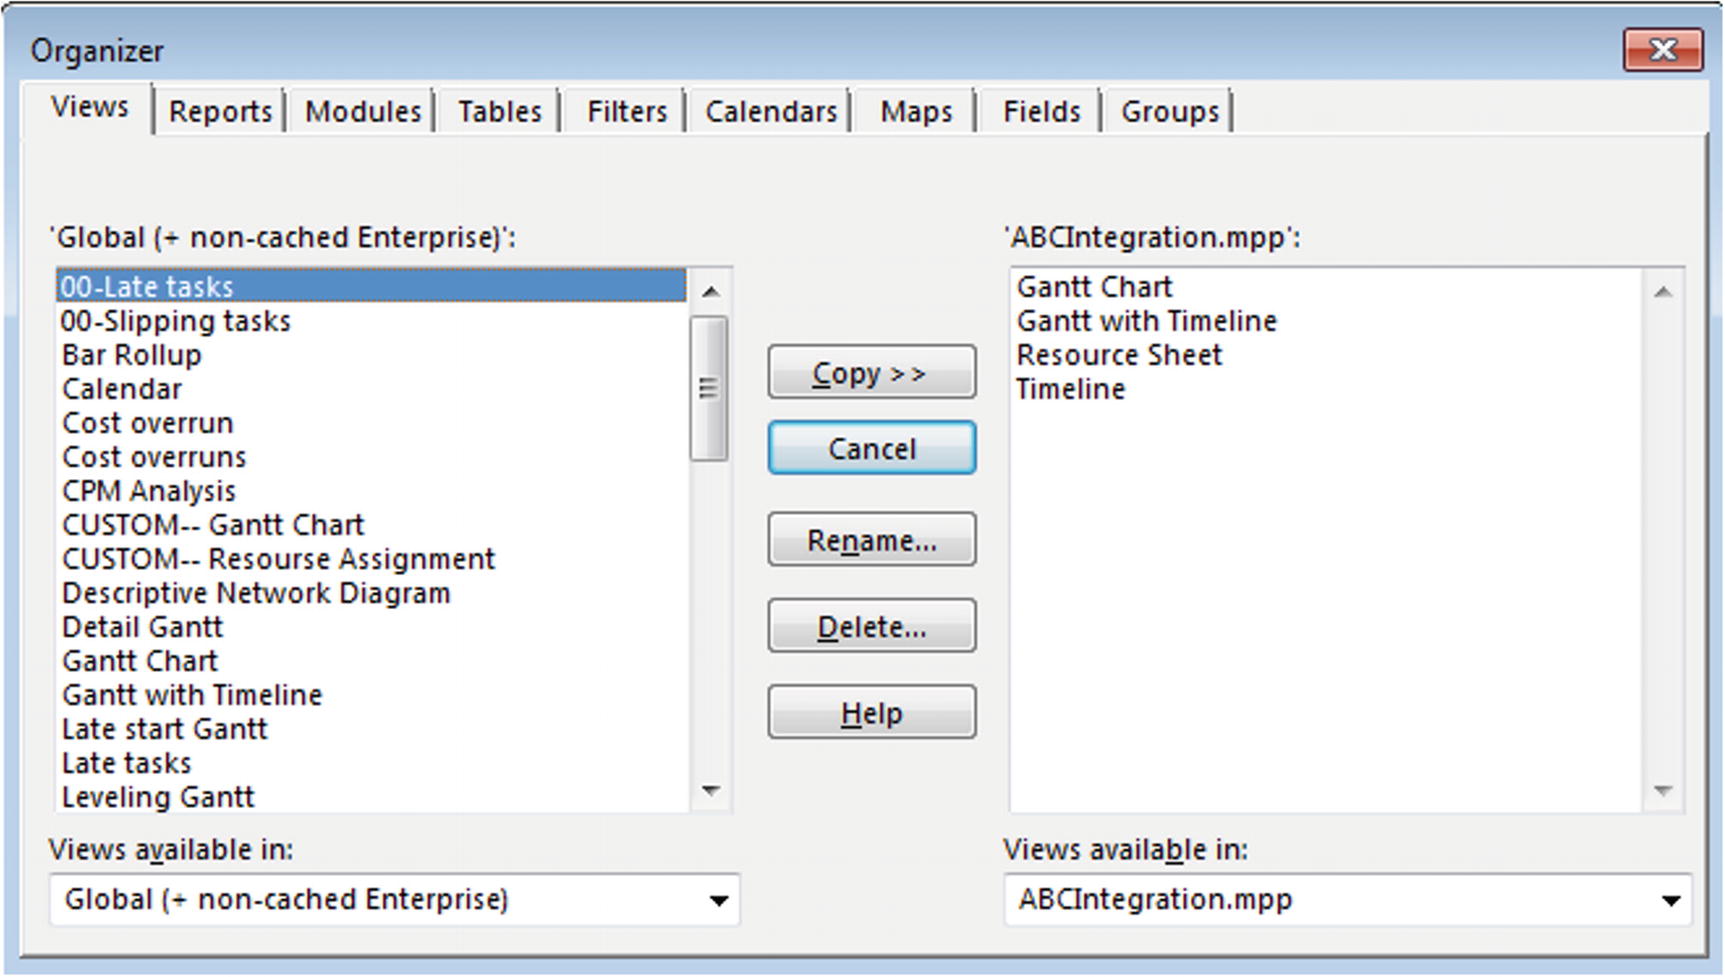 Figure 15-58
Organizer dialog box
- 3.
Select the tab that is appropriate for your needs, and use the Copy, Cancel, Rename, and Delete buttons to change the objects available in the Global.mpt (to all projects) and the current open file.
- 4.Alternatively, you can access the Organizer dialog box in several other ways, including the following:
- From View:Data, click the Tables icon, and from the dropdown list, select More Tables. In the More Tables dialog box, click Organizer.
 Figure 15-59
More Tables dialog box
- From View:Data, click the Filters dropdown arrow and select More Filters. In the More Filters dialog box, click Organizer.
 Figure 15-60
More Filters dialog box
- From View:Task Views, click the Gantt Chart dropdown arrow and select More Views. In the More Views dialog box, click Organizer.
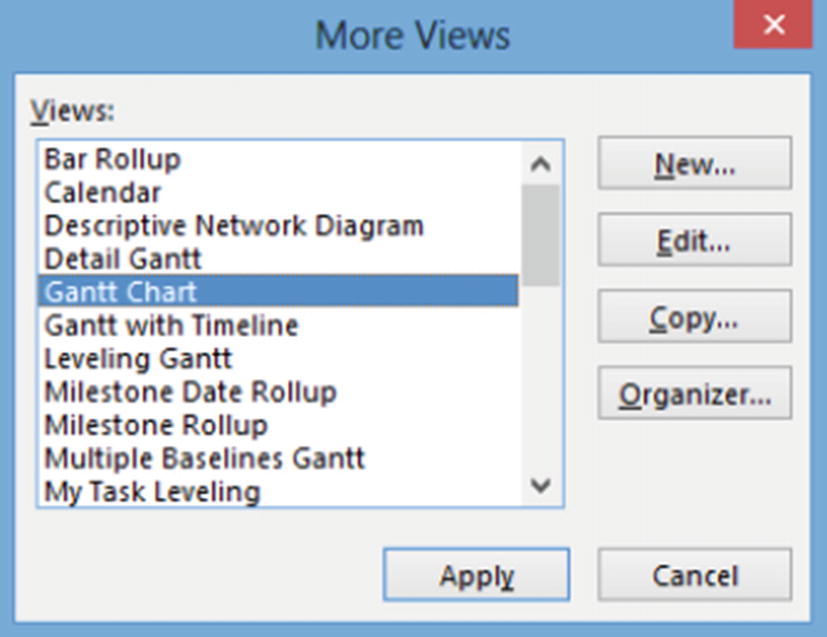 Figure 15-61
More Views dialog box
- From View:Resource Views, click the Team Planner dropdown arrow and select More Views. In the More Views dialog box, click Organizer.
 Figure 15-62
More Views dialog box
- 5.
Close the project.
15.4 Communicating Project Information
Reporting on various aspects of a project is a key project management function.
Microsoft Project 2019 offers a comprehensive set of preconfigured, visually appealing and informative reports that can be shared with others. This out-of-the-box reporting capability can be further improved by a robust custom report building functionality that is integrated with Microsoft Excel.
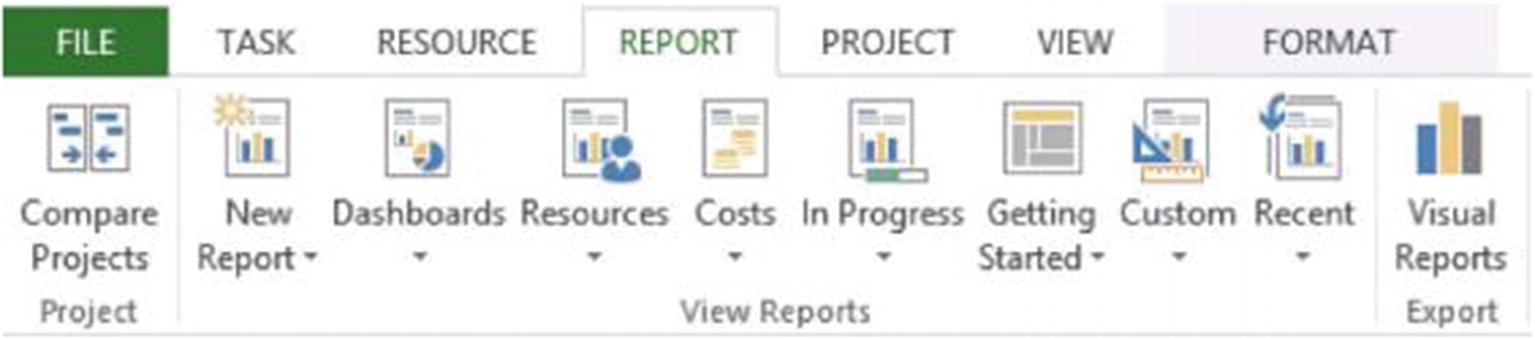
Overview of the Reports tab
In this section, we will first review the various preconfigured reports that are available in Microsoft Project 2019, and then we will discuss how to edit, customize, and share them to meet your unique needs.
Exploring Preconfigured Reports
![]() This exercise uses the file Dashboards.mpp. Ensure this file is open prior to beginning.
This exercise uses the file Dashboards.mpp. Ensure this file is open prior to beginning.
In the Report toolbar, preconfigured reports fall into four categories: Dashboards, Resources, Costs, and In Progress.
The image on your screen may differ slightly from the screenshots shared in this exercise, unless you make modifications to the data.
Dashboard Reports
- 1.From Report:View Reports, click the Dashboards icon to see the available reports in this category.
 Figure 15-64
Dashboards reports
Dashboard reports provide information over the entire project duration, including summary tasks, critical tasks, project milestones, cost, and schedule information. These reports present data that allows you to quickly assess project status in different areas.
Burndown report – Compares planned, completed, and remaining work on a chart that updates automatically as you change project data; this report provides a visual, up-to-date project status. Though these reports are particularly useful in agile project management, they are helpful regardless of project management methodology.
To access a Burndown report, navigate to Report:View Reports:Dashboards icon, and select Burndown from the dropdown list. Your screen will resemble the following. Figure 15-65
Burndown report
Cost Overview report – Shows the current cost status of your project and its top-level tasks; fields available include planned costs, remaining costs, actual costs, cumulative costs, baseline costs, and percentage of completion. This report is especially useful as you work to keep your project within budget.
To access a Cost Overview report, go to Report:View Reports:Dashboards icon, and select Cost Overview. The following is a sample Cost Overview report. Figure 15-66
Cost Overview report
Project Overview report – Shows how much of your project is complete, tasks that are late, and upcoming milestones.
To access a Project Overview report, go to Report:View Reports:Dashboards icon, and select Project Overview. The following is a sample Project Overview report. Figure 15-67
Project Overview report
Upcoming Tasks report – By default, shows work that has been accomplished in the current week, the status of other tasks that were/are due this week, and the tasks due to start in the coming week
To access the Upcoming Tasks report, go to Report:View Reports:Dashboards icon, and select Upcoming Tasks. Your screen will resemble the following. Figure 15-68
Upcoming Tasks report
Work Overview report – Provides work statistics for all top-level project tasks showing % complete and what is still to be accomplished; similar to a work burndown report
To access the Upcoming Tasks report, go to Report:View Reports:Dashboards icon, and select Work Overview. Your screen will resemble the following. Figure 15-69
Work Overview report
Resource Reports
- 1.From Report:View Reports, click the Resources icon to see the available reports in this category.
 Figure 15-70
Resources reports menu
Over-allocated Resources report – Shows the actual and remaining work for all over-allocated project resources; also includes a link to the Team Planner view, where you can work to resolve these over-allocations
To access this report, go to Report:View Reports:Resources icon and select Over-allocated Resources from the dropdown list. Figure 15-71
Over-allocated Resources report
Resource Overview report – Views the work status of all project resources to determine how much work is complete and what is still to be finished
To access this report, go to Report:View Reports:Resources icon and select Resource Overview from the dropdown list. Figure 15-72
Resource Overview report
Cost Reports
- 1.From Report:View Reports, click the Costs icon to see the available reports in this category.
 Figure 15-73
Costs reports menu
Cash Flow report – By default, shows the cost (including cumulative cost) of all top-level tasks by quarter; customizable, like most other preconfigured reports; you can display other costs and other time periods.
To access this report, go to the Costs icon under Report:View Reports and select Cash Flow from the dropdown. Your screen will resemble the following.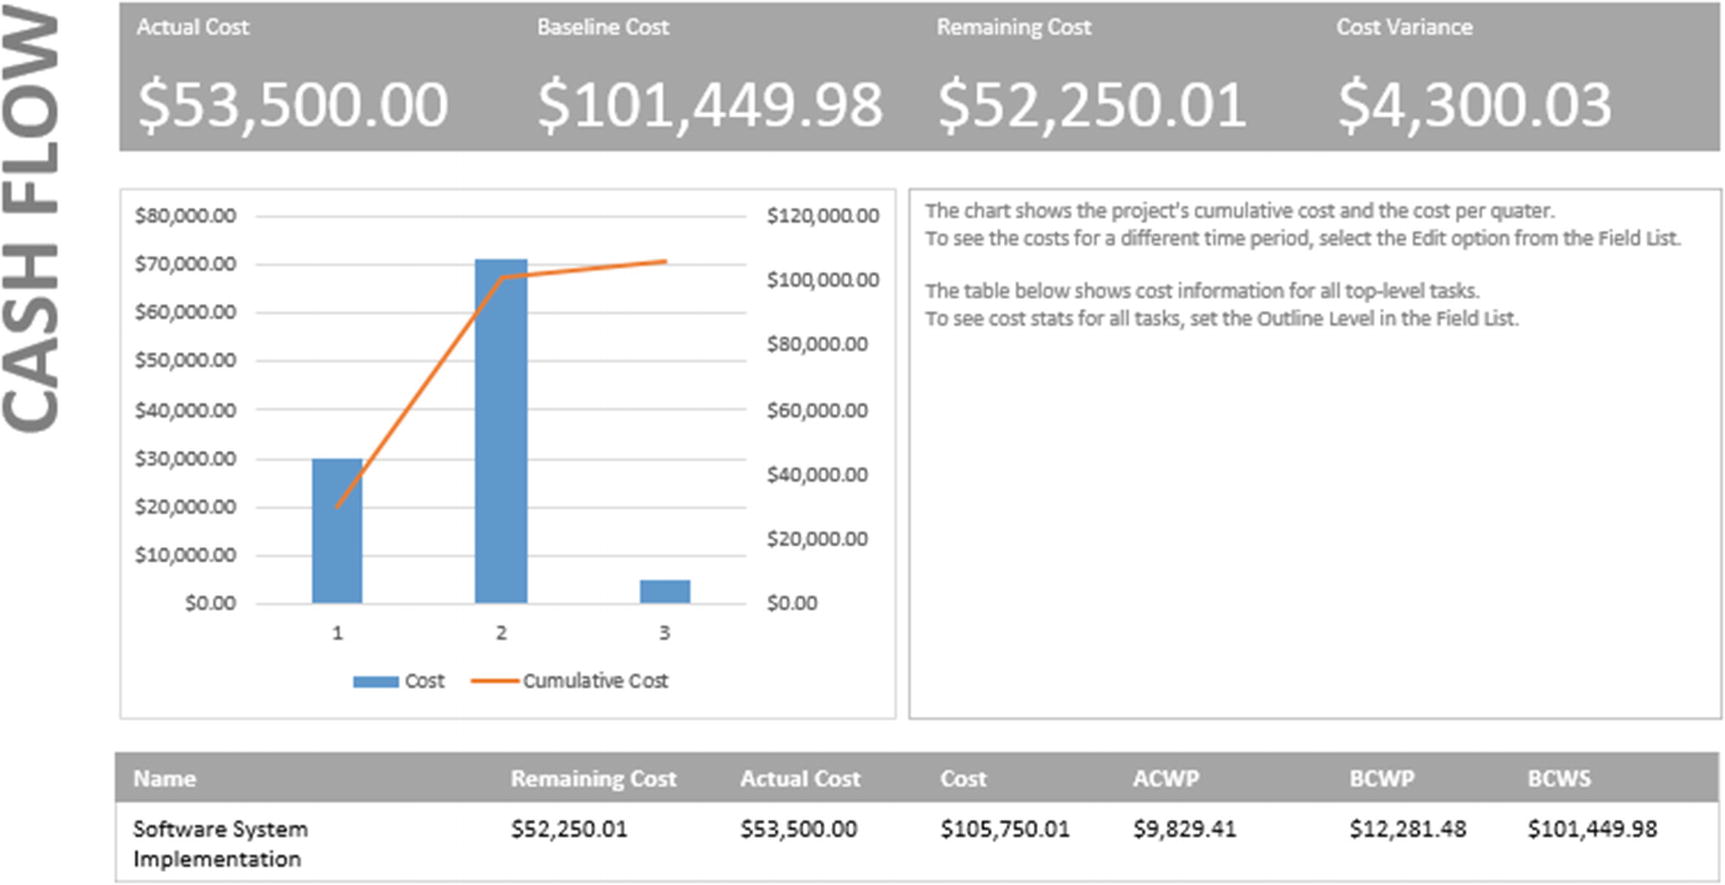 Figure 15-74
Cash Flow report
Cost Overruns report – Displays the cost variance for all top-level tasks and people assigned to your project; also shows where actuals exceed baseline costs.
To access the Cost Overruns report, go to the Costs icon under Report:View Reports and select Cash Flow from the dropdown. Your screen will resemble the following. Figure 15-75
Cost Overruns report
Earned Value report – Provides information about earned value, variance, and performance overtime; displays a comparison of costs and schedules to the baseline, which helps you determine if the project is on track
To access the Earned Value report, go to the Costs icon under Report:View Reports and select Cash Flow from the dropdown. Your screen will resemble the following. Figure 15-76
Earned Value report
Resource Cost Overview report – Shows the cost status of resources (people, material, and cost types) assigned to your project; cost details appear in a table, and cost distribution information is presented in a chart.
To access the Resource Cost Overview report, go to the Costs icon under Report:View Reports and select Cash Flow from the dropdown. Your screen will resemble the following. Figure 15-77
Resource Cost Overview report
Task Cost Overview report – Shows the cost status of your project’s top-level tasks; just like the Resource Cost Overview report, cost details appear in a table, and cost distribution information is presented in a chart.
To access the Task Cost Overview report, go to the Costs icon under Report:View Reports and select Cash Flow from the dropdown. Your screen will resemble the following. Figure 15-78
Task Cost Overview report
In Progress Reports
- 1.From Report:View Reports, click the In Progress icon to see the available reports in this category.
 Figure 15-79
In Progress reports menu
Critical Tasks report – Presents the status of all tasks on the project’s critical path
Remember: A delay in a critical path task will cause the schedule to slip.
To access the Critical Tasks report, from Report:View Reports, click the In Progress icon, and from the dropdown list, select Critical Tasks. Your screen will resemble the following. Figure 15-80
Critical Tasks report
Late Tasks report – Shows all tasks that either started or finished later than their scheduled start and finish dates and that aren’t progressing as planned
To access the Late Tasks report, from Report:View Reports, click the In Progress icon, and from the dropdown list, select Late Tasks. Your screen will resemble the following.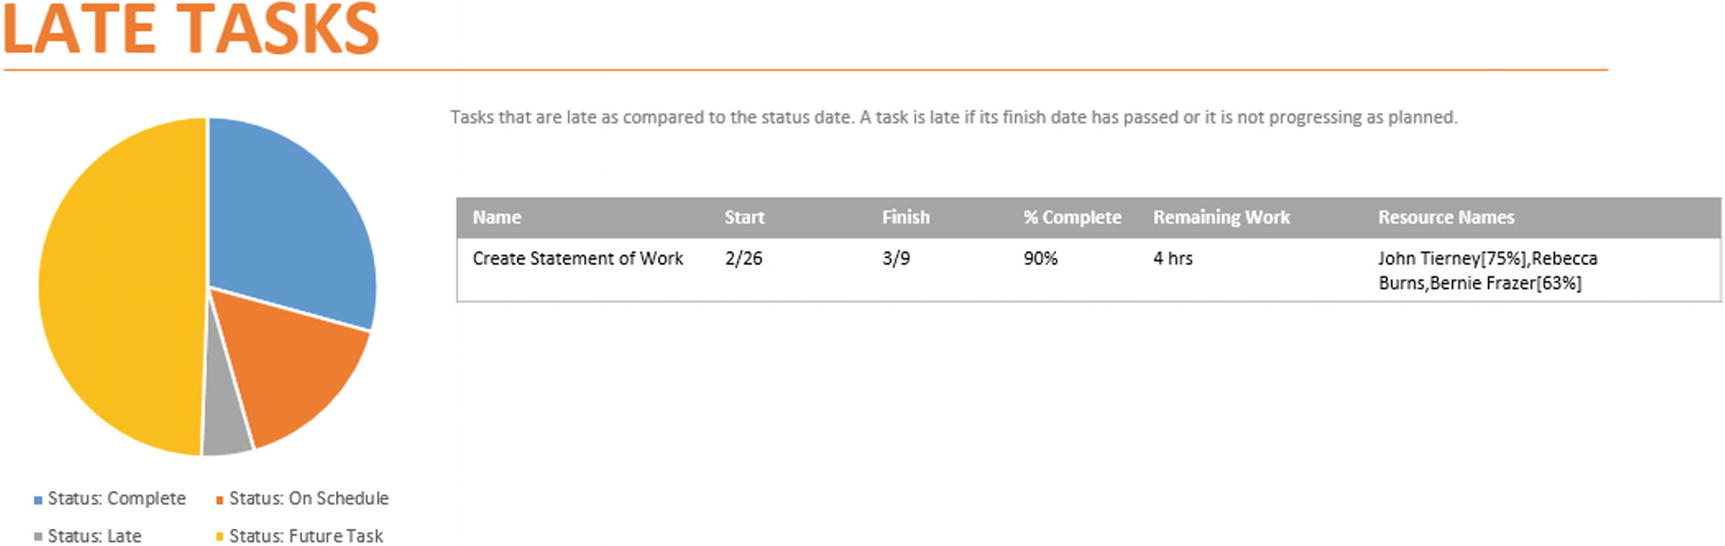 Figure 15-81
Late Tasks report
Milestone report – Presents the status of all project milestones, including if they are late, due, or completed
To access this report, from Report:View Reports, click the In Progress icon, and from the dropdown list, select Milestone Report. Your screen will resemble the following. Figure 15-82
Milestone report
Slipping Tasks report – Shows all project tasks that are taking longer to complete than expected (actual finish date is or will be later than baseline finish date)
To access the Slipping Tasks report, from Report:View Reports, click the In Progress icon, and from the dropdown list, select Slipping Tasks. Your screen will resemble the following. Figure 15-83
Slipping Tasks report
Creating a New Report
At times you’ll find that the available reports don’t meet your organization’s exact needs. Microsoft Project 2019 offers several report templates that help you to create your own reports.
- 1.From Report:View Reports, click the New Report icon to see a dropdown list with all available report templates.
 Figure 15-84
New Report templates: Blank, Chart, Table, and Comparison
Creating a Chart Report
- 1.From the New Report dropdown list, select Chart to view the Chart template. A Report Name dialog box will appear, similar to the following, prompting you to name your new report (it is named “Report 1” by default), as in the following figure.
 Figure 15-85
Report Name dialog box
- 2.Click OK to accept the default entry. Your new report based on the Chart template will appear, similar to the following.
 Figure 15-86
New Chart report
The chart-based report, by default, shows Actual Work, Remaining Work, and Work fields for your project. Use the Field List on the right side of the screen to select the fields you want to view and compare in the chart and to further customize the chart to suit your needs. Instruction around report customization is provided later in this section.
Creating a Table Report
- 1.From Report:View Reports, click the New Reports icon, and from the dropdown list, select Table. Name your table in the Report Name dialog box and click OK to see your new report.
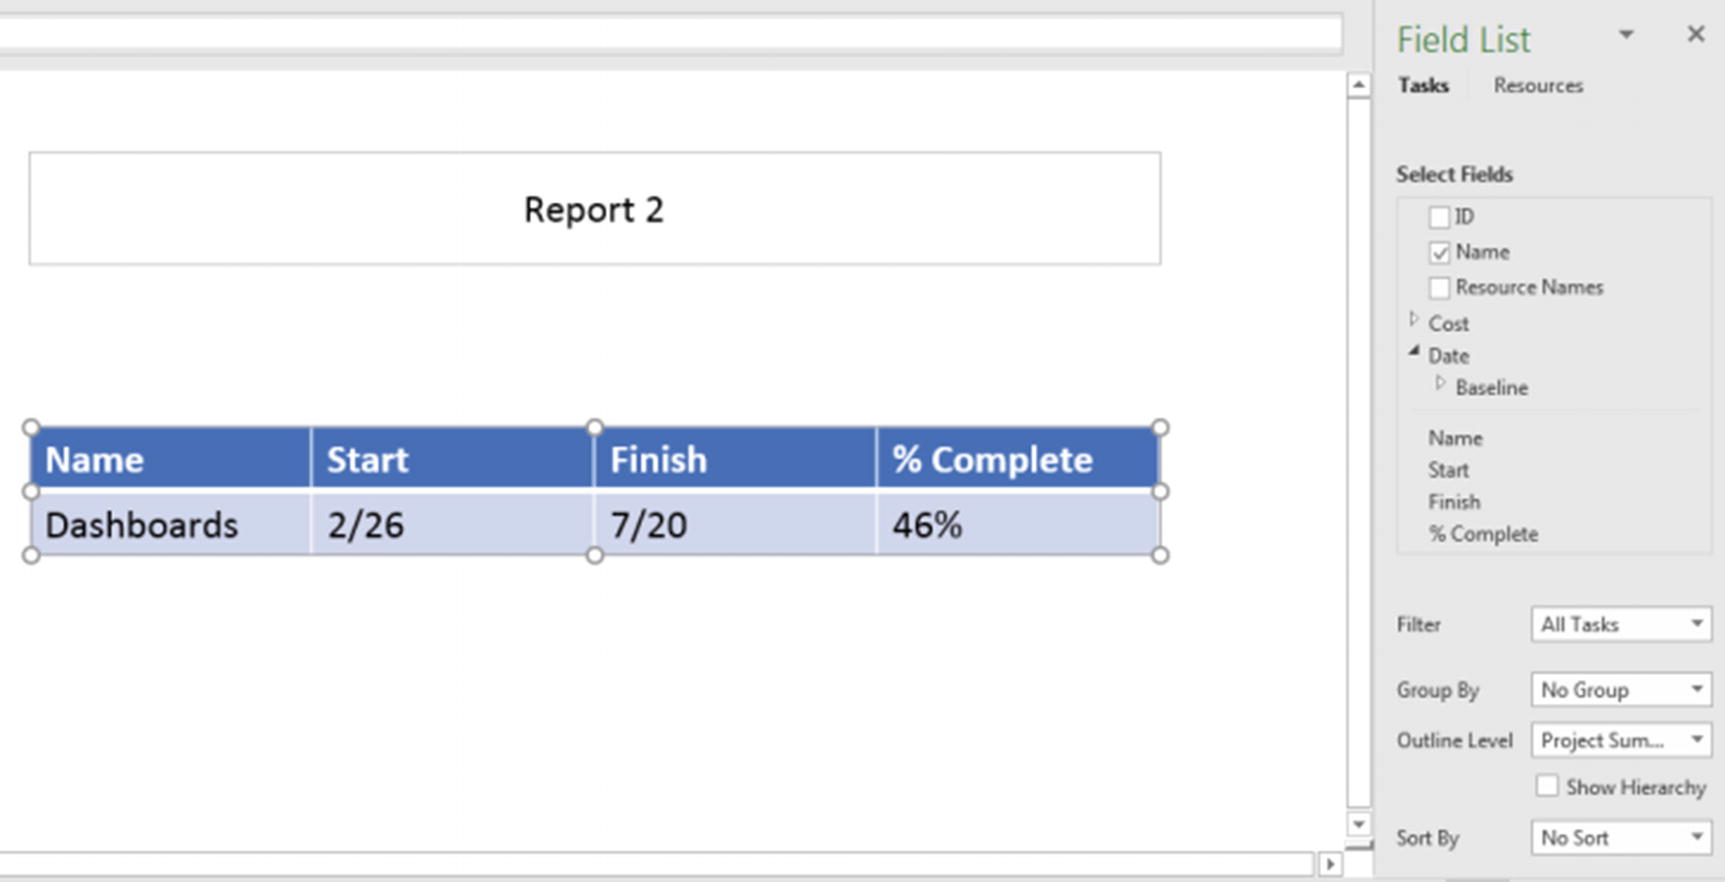 Figure 15-87
Table report
As you can see, by default this report shows project information that includes the Name, Start, Finish, and % Complete fields. By default, this report shows only data at the Project Summary task level (we will cover modifying default settings in the “Customizing Reports” sub-section of this chapter). Just as in the Chart report, you can use the Field List on the right side of the screen to customize the table to suit your needs. The Table Tools tabs at the top of your screen (Design and Layout) provide the ability to further customize the table.
Creating a Comparison Report
- 1.From Report:View Reports, click the New Reports icon, and from the dropdown list, select Comparison. Name your Comparison report in the Report Name dialog box and click OK to see your new report.
 Figure 15-88
Comparison report
Comparison reports, by default, show two identical chart-based reports showing Actual Work, Remaining Work, and Work. You can use the Field List selections to customize one chart, for the purpose of visually comparing one to the other. We will cover modifying default settings in the “Customizing Reports” sub-section of this chapter.
Creating a Blank New Report
- 1.The final New Report available is essentially an empty screen, where you can create a report “from scratch.” From Report:View Reports, click the New Reports icon, and from the dropdown list, select Blank. Name your new report in the Report Name dialog box and click OK to see the foundation for your new report.
 Figure 15-89
Blank report
Click the Report Tools tab functions (shown in the preceding figure) to add images, shapes, charts, tables, and text to your report.
When you create a custom report, it will appear in the list of available custom reports. To access this list, use the Custom icon in Report:View Reports.

Available custom reports
Customizing Reports
In the preceding section, we explored the various preconfigured reports and templates that are included with Microsoft Project 2019. Of course it’s likely that you’ll want to further customize some of these reports to best meet your organizational needs. Using built-in customization options, you can change the specific data that appears in a report as well as its overall appearance.
Changing the Information and Look of Reports
- 1.From Report:View Reports, click the Dashboards icon, and from the dropdown list, click Project Overview. This report (which by default shows how much of your project is complete, tasks that are late, and upcoming milestones) will resemble the following.
 Figure 15-91
Project Overview report
- 2.Click inside the % Complete chart in the upper-right portion of your screen and note the Field List sidepane that appears on the right side of your screen. It is within this sidepane that you find the tools to customize the data appearing in the selected report component (chart in this case).
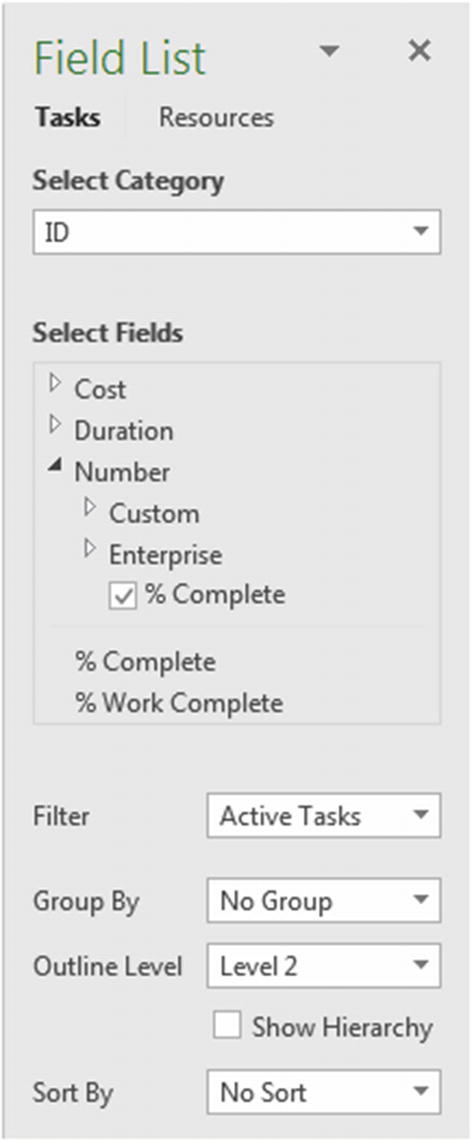 Figure 15-92
Field List sidepane
- 3.When you click a chart or table, notice that three buttons appear to the right of the chart, as follows:
- Chart Elements [
 ] – Click this button to easily add, remove, or change chart elements, such as the title, key, gridlines, and data labels. You will see a list of elements with a checkbox to the left of each. You can use these checkboxes to add (or remove) elements to your chart.
 Figure 15-93
Chart Elements dialog box
- Chart Styles [
 ] – Click this button for quick access to tools that allow you to change the style and color scheme for your chart. By default, the Style tab is selected. Use the scroll bar to view and select alternative chart styles. Select the Color tab to alter the chart color(s).
 Figure 15-94
Chart Styles dialog box: Style and Color tabs
- Chart Filters [
 ] – Click this button for quick access to tools that allow you to customize the data points and names that are visible on your chart.
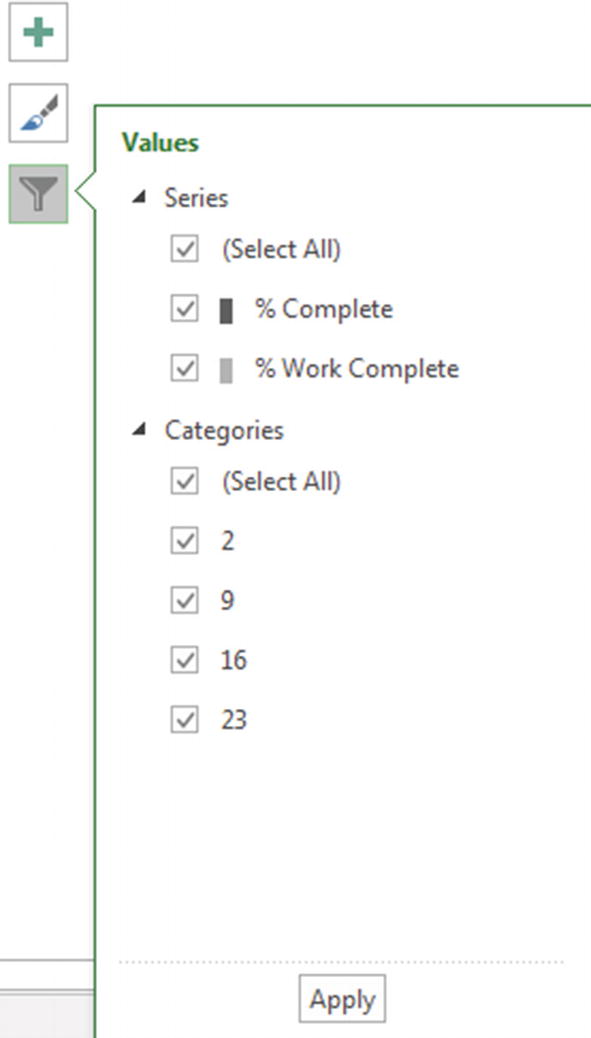 Figure 15-95
Chart Filters dialog box
- 4.When you first clicked the chart, the Field List sidepane and three additional formatting buttons appeared on your screen. Additionally, two more tabs appear in your toolbar, the Chart:Design tab and the Chart:Format tab.
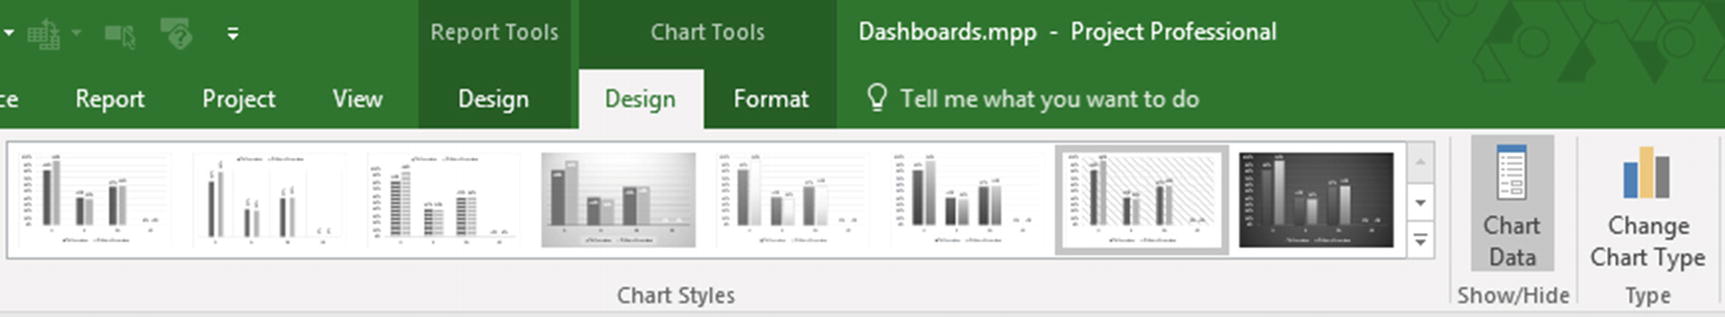 Figure 15-96
Chart:Design options
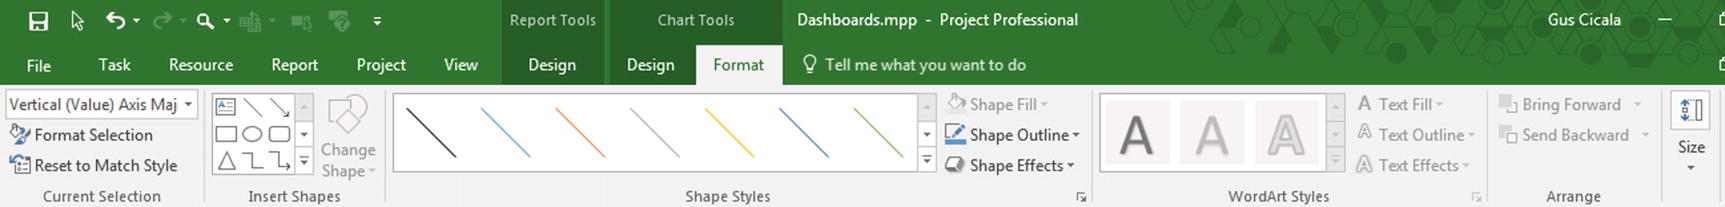 Figure 15-97
Chart:Format options
Note Similar toolbars appear when you’re working within a table—Table:Design and Table:Format.
- 5.Now that we’ve reviewed the most useful customization tools, let’s update our chart. Currently the chart reflects only the % Complete field. In the Select Fields section of the Task Field sidepane, uncheck the % Work Complete checkbox. Your chart will now resemble the following.
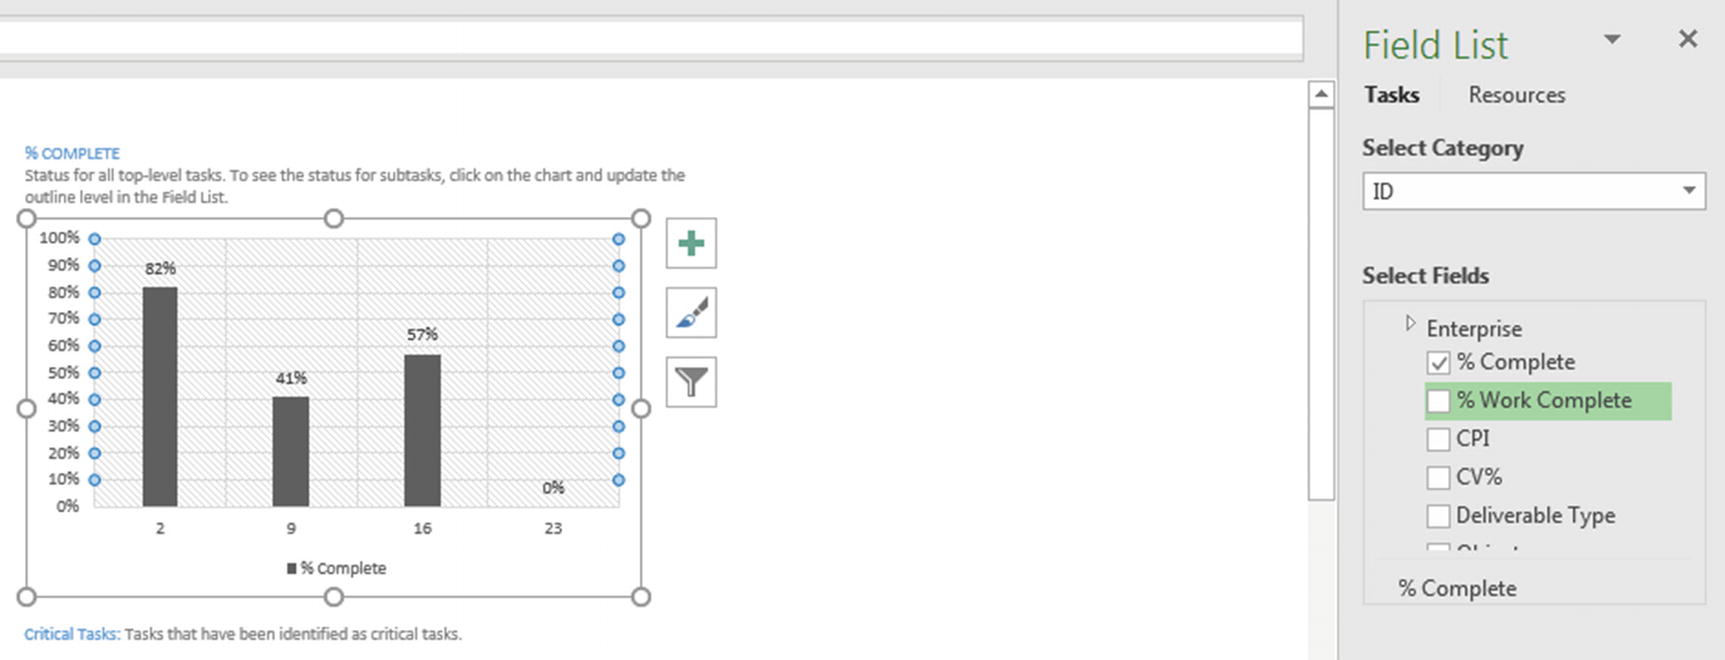 Figure 15-98
Customizing chart fields
- 6.Click the Chart Elements button (highlighted in the following figure), and from the list that appears, click Legend. A legend will appear on your chart, identifying the fields represented.
 Figure 15-99
Adding a chart Legend
- 7.By default, this report only shows the status of top-level tasks. To expand the tasks represented, in the Task Field sidepane, use the dropdown arrow in the Filter field to select In progress tasks. Note the change to your chart.
 Figure 15-100
Changing the chart data
- 8.From Chart Tools:Design, click one of the available design options to change the style of your chart.
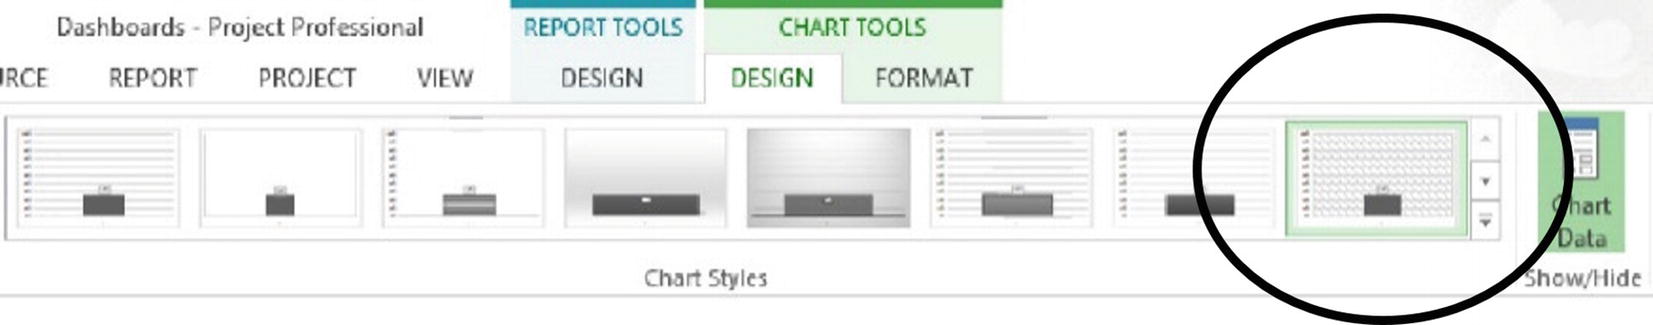 Figure 15-101
Chart design
- 9.
Let’s change our focus now to the Late Tasks table component of your Project Overview report in the lower right of your screen. Click your cursor within the table to activate the table customization options. The Field List sidepane will remain visible, and the Chart Tools:Design/Format toolbar tab will change to Table Tools:Design and Table Tools:Format.
- 10.Select Constraint Date in the Field List sidepane to add this field to your table.
 Figure 15-102
Adding a field to a table
- 11.Perhaps you’d like this table to reflect the status of all critical tasks, rather than late tasks. In the Task Field sidepane, use the dropdown arrow in the Filter field to select Critical. Now this table will reflect the status of all critical tasks.
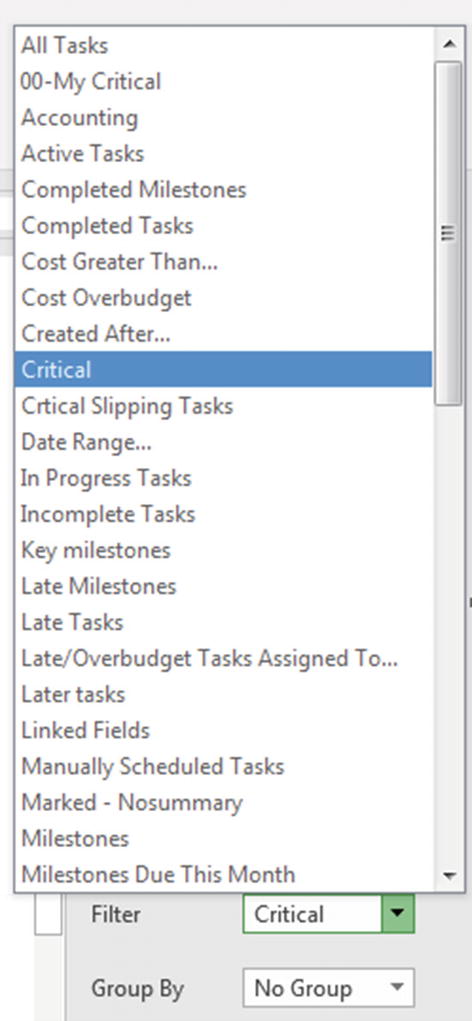 Figure 15-103
Critical selected in Filter dropdown
- 12.
Unfortunately, the title still says “Late Tasks.” Click Late Tasks—it’s a text box—and change the text to read “Critical Tasks: Tasks that have been identified as critical tasks.”
By default, the Project Overview report displays task information. If you’d prefer to view resource information in the various report components, click the Reports link at the top of the Field List sidepane.
- 13.
Save and close your project.
Getting Started
The Getting Started functionality provides some helpful information about how to begin using reports. Its purpose is primarily to provide a high-level tour about existing reporting capabilities.
- Best Practices Analyzer – Can be used to identify potential issues with your project, such as tasks to which no resources have been assigned.
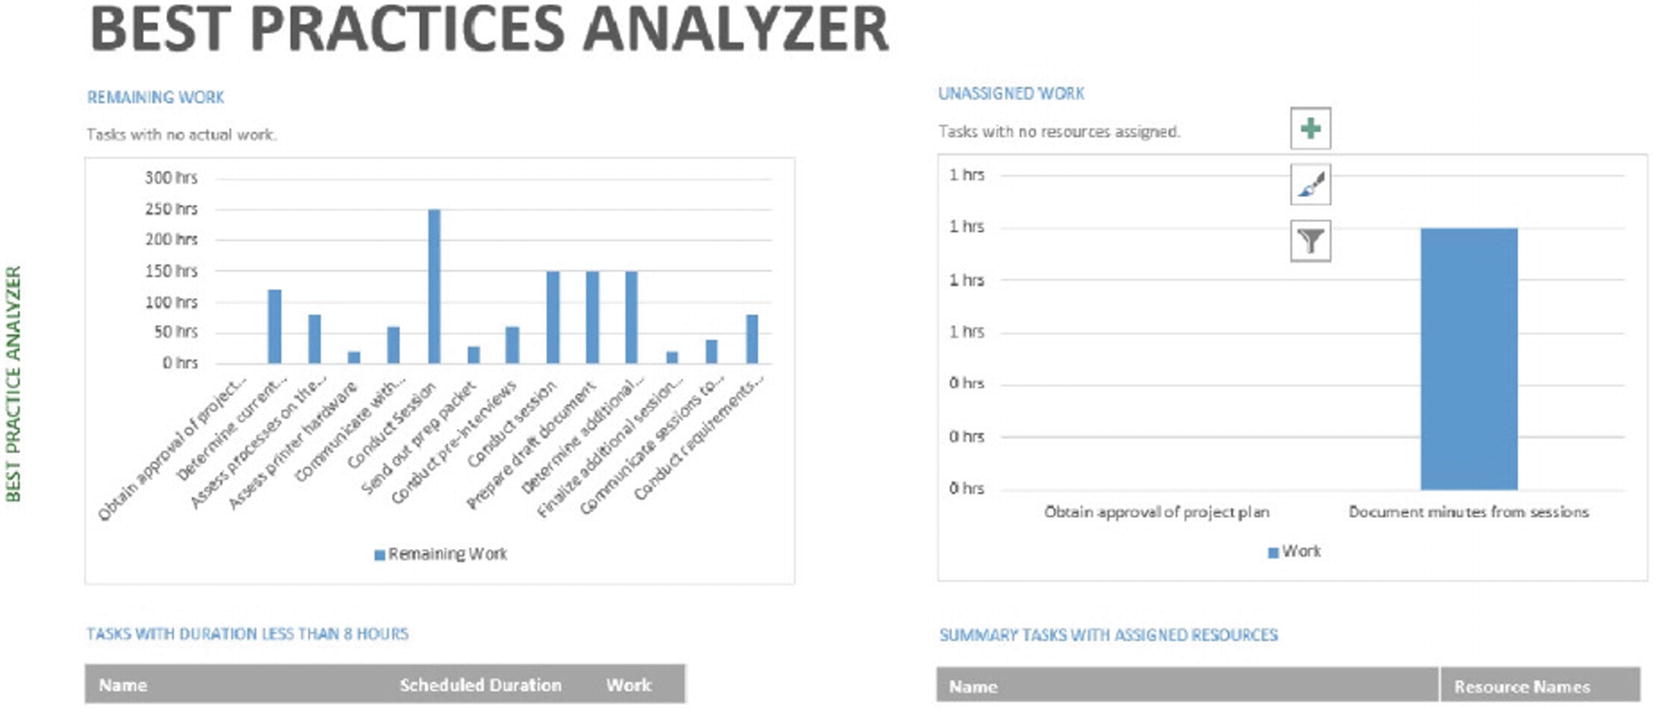 Figure 15-104
Best Practices Analyzer
- Create reports – An introductory sampling of a dashboard report, covered in more detail earlier in this section.
 Figure 15-105
Create dynamic reports
- Get started with Project – Provides an overview of the help topics available as you build your project. As an example, click the Organize tasks link, and you will be presented with additional help topics to help you build a project plan.
 Figure 15-106
Get started with Project
- Organize tasks and Share with your Team – Also provide help topics that can assist you as you build a project plan.
 Figure 15-107
Organize Tasks
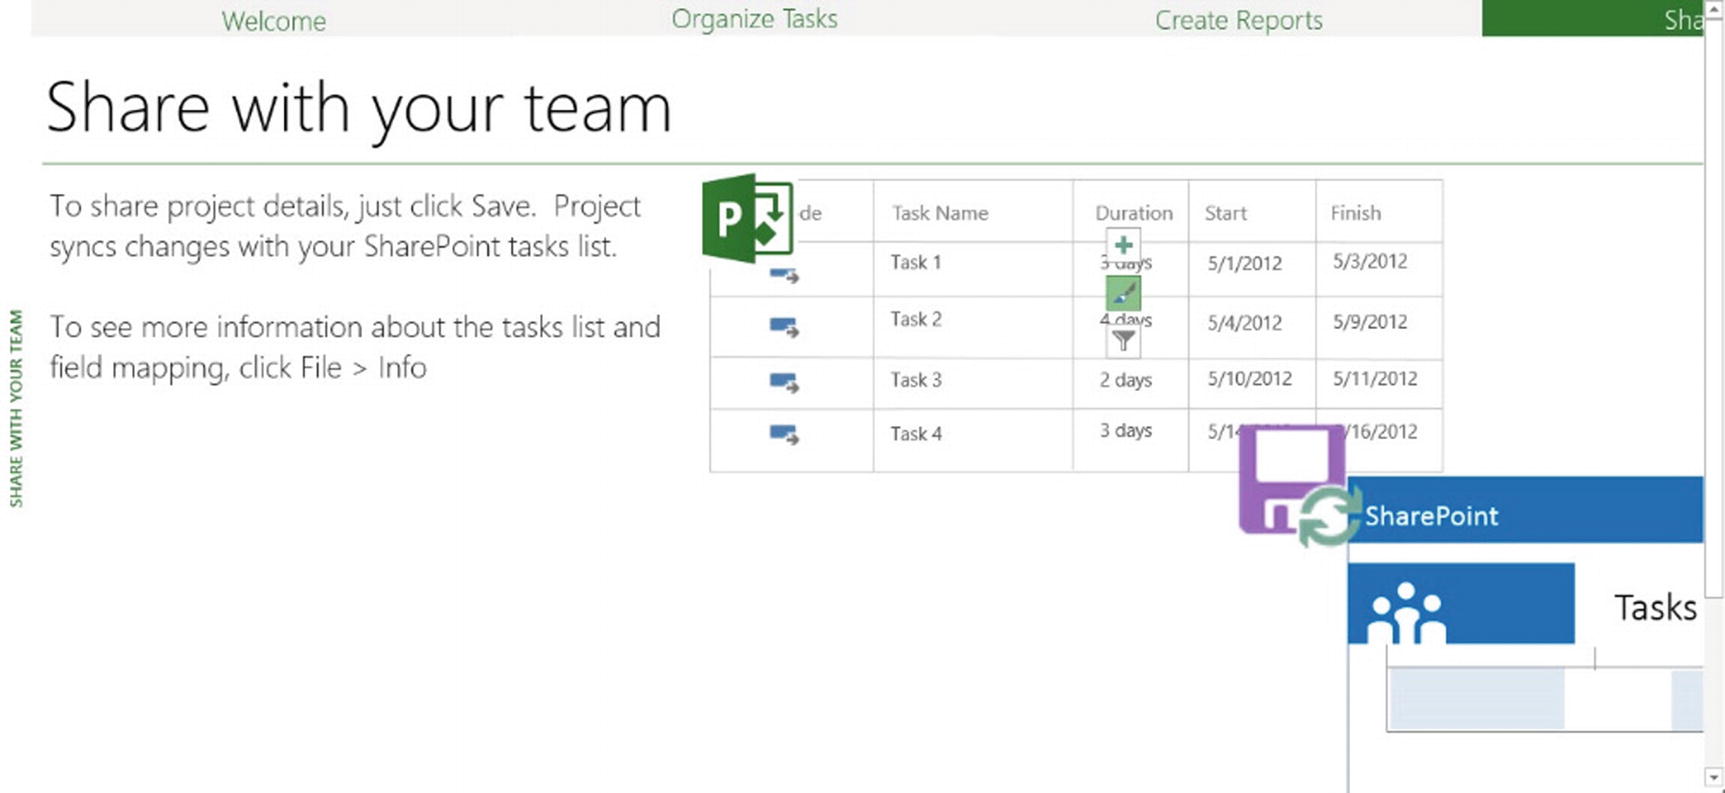 Figure 15-108
Share with your team
Every dropdown list in the Report:View Reports section of the Report toolbar (except New Report) provides access to every other available report (preconfigured or custom). Click More Reports… in any of these lists to access the Reports dialog box, where you can select from any of the available reports.

Reports dialog box
Sharing Project Information
As we’ve discussed, Microsoft Project 2019 provides several tools that help you share the project information you’ve gathered with team members and stakeholders. You can print current report views, save report information as a PDF file, and copy the information and then paste it into other Microsoft Office tools. Custom report templates can also be saved using the Organizer so they are available to others.
Printing a Current Report View
- 1.
From Report:View Reports, click the Dashboard icon, and from the dropdown list, click Project Overview. The Project Overview report will appear on your screen.
- 2.From the File menu, click Print to view the Print dialog box, resembling the following.
 Figure 15-110
Print dialog box
- 3.
Use the Printer dropdown list to select the printer you’d like to use. In the Settings section, you can define the look of your printed report by selecting the paper size and orientation and also by determining how much of the report you’d like to print (all, or just a selected page range). Note: As you change settings in the Print dialog box, the display on the right provides you with a current preview of your selected options.
- 4.
Click Print to print your report.
Capturing Report Information in a PDF File
- 1.Return to your Project Overview report. From the File menu, click Save As to access the Save As dialog box. Navigate to the location where you would like to save the file.
 Figure 15-111
Save As dialog box
- 2.In the Save as type field, use the dropdown list (as in the preceding figure) to select PDF Files and click Save. The Document Export Options dialog box will appear.
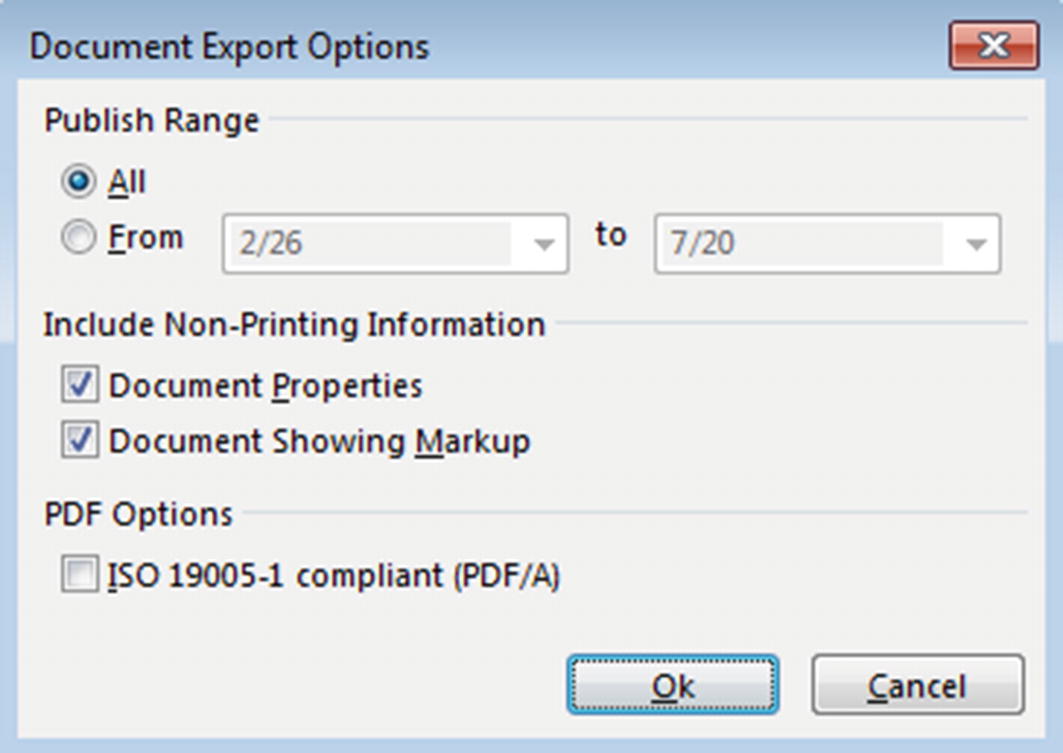 Figure 15-112
Document Export Options dialog box
- 3.
Click Ok to accept the default options in this dialog box. A PDF file containing your report information will appear in the location you assigned it to in Step 5.
Copying a Report
- 1.
Return again to your Project Overview report. In the Report Tools section of the toolbar, click the Copy Report icon [
 ] under Design:Report. The report data you just copied is stored in the clipboard.
 - 2.
Open a new blank document in Microsoft Word (or any other data presentation tool). Place your cursor within the new document, and from Home:Clipboard, click Paste to paste your report data into the Microsoft Word document.
- 3.
Close your project.
Custom Reports and the Organizer
![]() This exercise uses the file Dashboards_Inst1.mpp. Ensure this file is open before beginning.
This exercise uses the file Dashboards_Inst1.mpp. Ensure this file is open before beginning.
The Organizer allows you to add custom objects (reports, fields, calendars, tables, views, etc.) to your local Global template, where these objects are then available for use across all of your projects. In order to make these objects available on Project Server, contact your Project Server administrator to update the Enterprise Global template.
- 1.From Report:View Reports, click the Custom icon to see the custom reports you created earlier in this section.
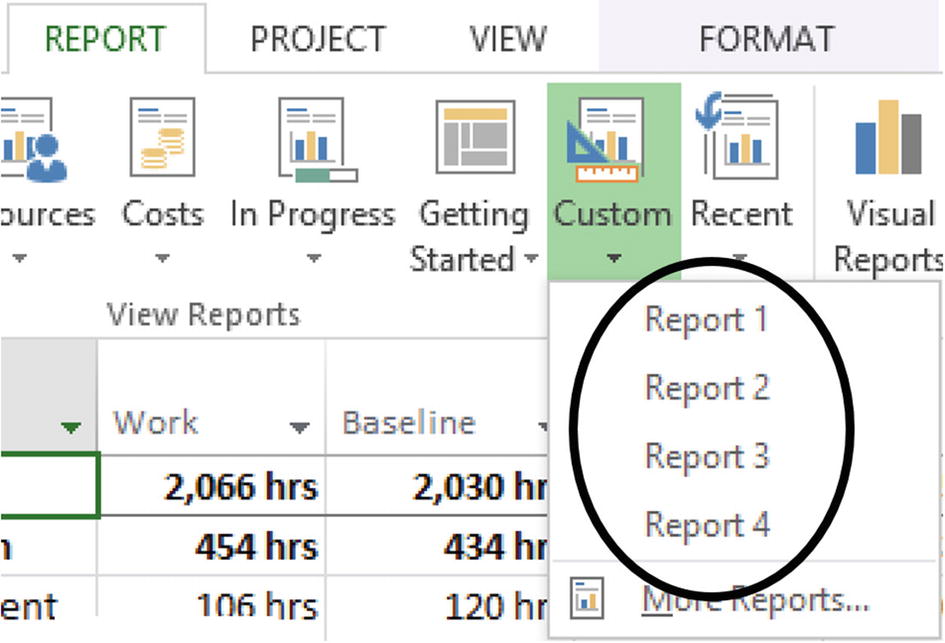 Figure 15-113
Custom reports
- 2.From File:Info, click the Organizer icon to see the Organizer dialog box.
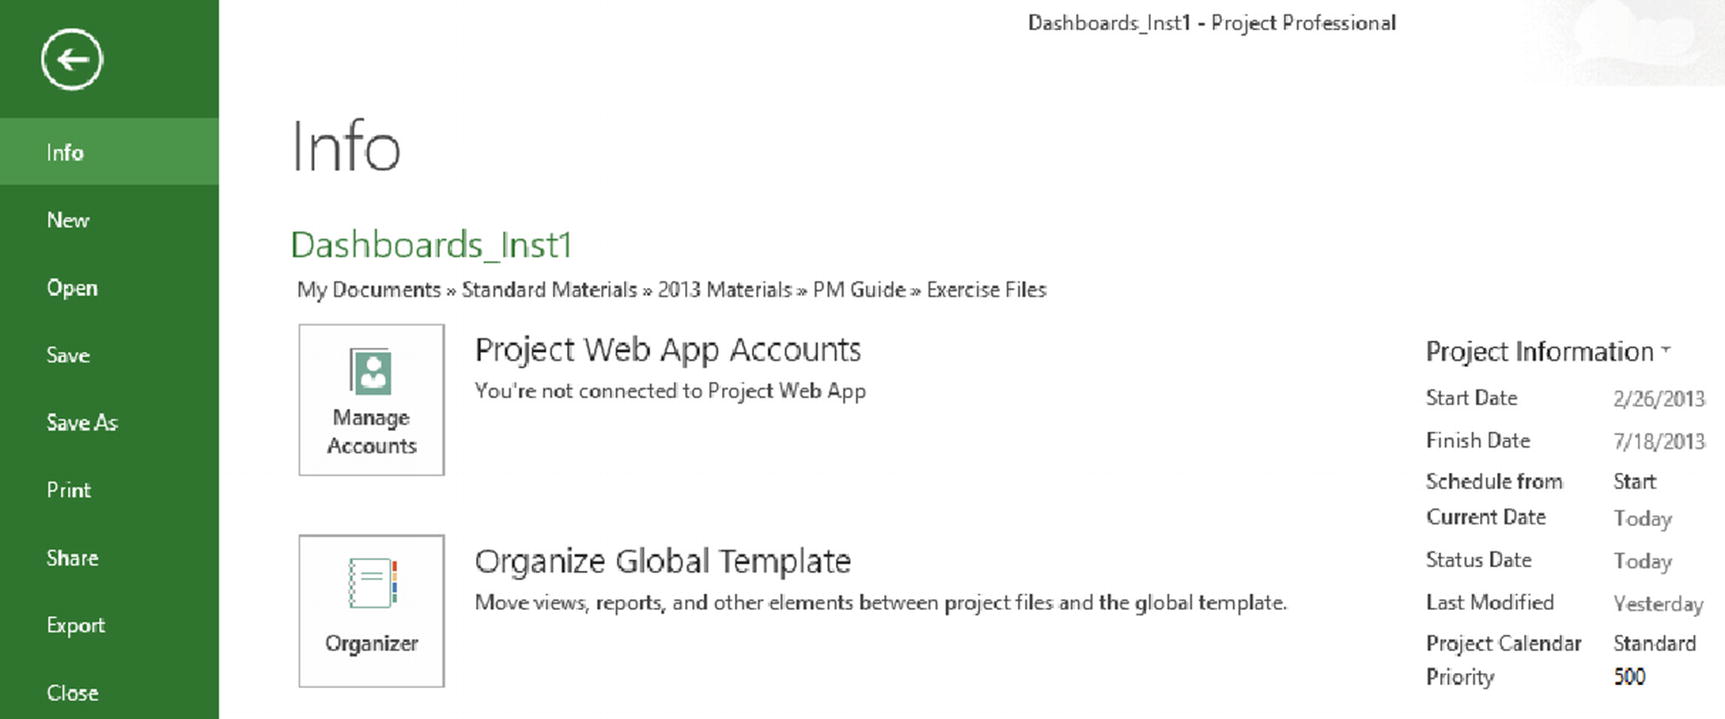 Figure 15-114
Accessing the Organizer
 Figure 15-115
Organizer dialog box
- 3.Select the Reports tab.
 Figure 15-116
Organizer dialog box with Reports tab selected
The list on the left side of the Organizer shows reports in the Global template, while the list on the right shows reports in the current project.
- 4.
Select Report 1 (the custom chart report you created) and then click the Copy button to move Report 1 to the Global template. Report 1 is now available to all of your projects.
- 5.
Click Close to close the Organizer, and then close your project.
15.5 Exporting Project Information
In addition to presenting project information within Microsoft Project, Microsoft Project data can be exported into other applications with additional reporting capabilities using the reporting functionality.
Visual Reports
Along with the Reports functionality we just reviewed, the Report toolbar includes a Visual Reports icon . This functionality provides access to Excel and Visio report templates to prepare graphic reports.
In the following exercise, you are in the middle of a project that is scheduled to end on October 1. You were asked to prepare a status report for management as of the end of last week, June 21 (of the current year).
- 1.From Report:Export, click the Visual Reports [
 ] icon. Your screen will resemble the following.
 Figure 15-117
Initiating a visual report
Notice this dialog box lists the currently available templates on the All tab—which appears by default—and shows a sample of the selected report layout in the smaller, right-hand window. You can also create new templates or edit existing ones to define the structure of the report.
- 2.
Select each of the available templates, and you will see a preview of the sample report in the Create Report dialog box.
- 3.With the All tab selected, choose the Baseline Cost Report and click View. Excel builds a local Online Analytical Processing (OLAP) cube file and Excel will open and present your data in an Excel PivotChart or Visio PivotDiagram. Your Microsoft Excel screen will resemble the following.
 Figure 15-118
Sample Baseline Cost Report
- 4.Click in the chart to see the PivotChart Fields sidepane, which you can use to adjust the presentation.
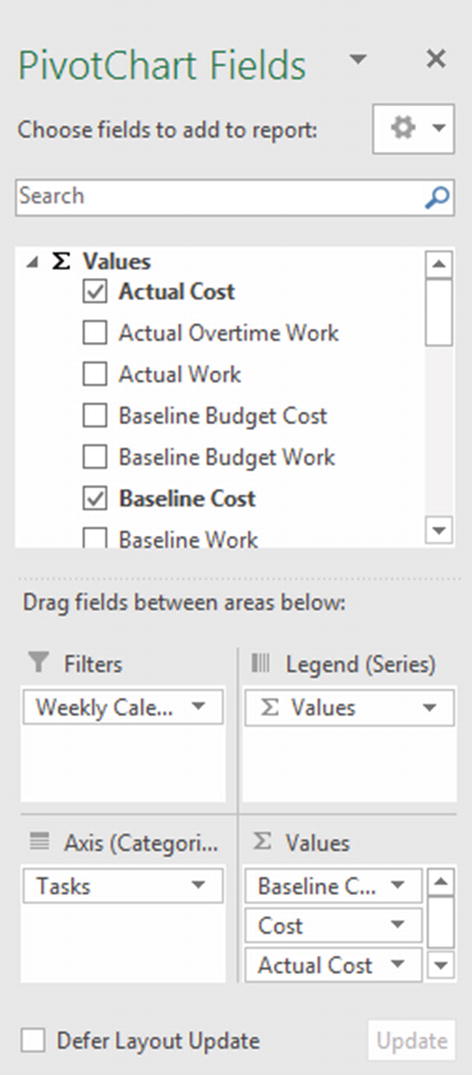 Figure 15-119
PivotChart Fields sidepane
- 5.
In the PivotChart Fields sidepane, highlight the Tasks checkbox and click the adjacent dropdown arrow.
- 6.In the Select field:Tasks dialog box that appears, click the plus sign left of the Project Name to reveal the phases and tasks that comprise the WBS. Clear the task Build Project Plan by deselecting the checkbox, as in the following figure.
 Figure 15-120
Modified Tasks list
- 7.Click OK to remove the empty column in the preceding figure. Your screen will now resemble the following.
 Figure 15-121
Modified Visual Report view
- 8.At the bottom of the Pivot Chart, click the Assignment Usage worksheet tab to see the corresponding tabular data. You also can click the plus sign left of the Project Name to reveal the phases and tasks that comprise the WBS.
 Figure 15-122
Assignment Usage Pivot Table worksheet tab
- 9.Note that you can add currency signs as you can with any Microsoft Excel spreadsheet. Also, if you click a task name within the chart, such as Finalize project plan and definition, a list of available PivotTable fields appears on the right, and the native PivotTable formatting capabilities available in Microsoft Excel are enabled in this worksheet. For more information regarding formatting PivotTables in Excel, please refer to Microsoft Excel online help.
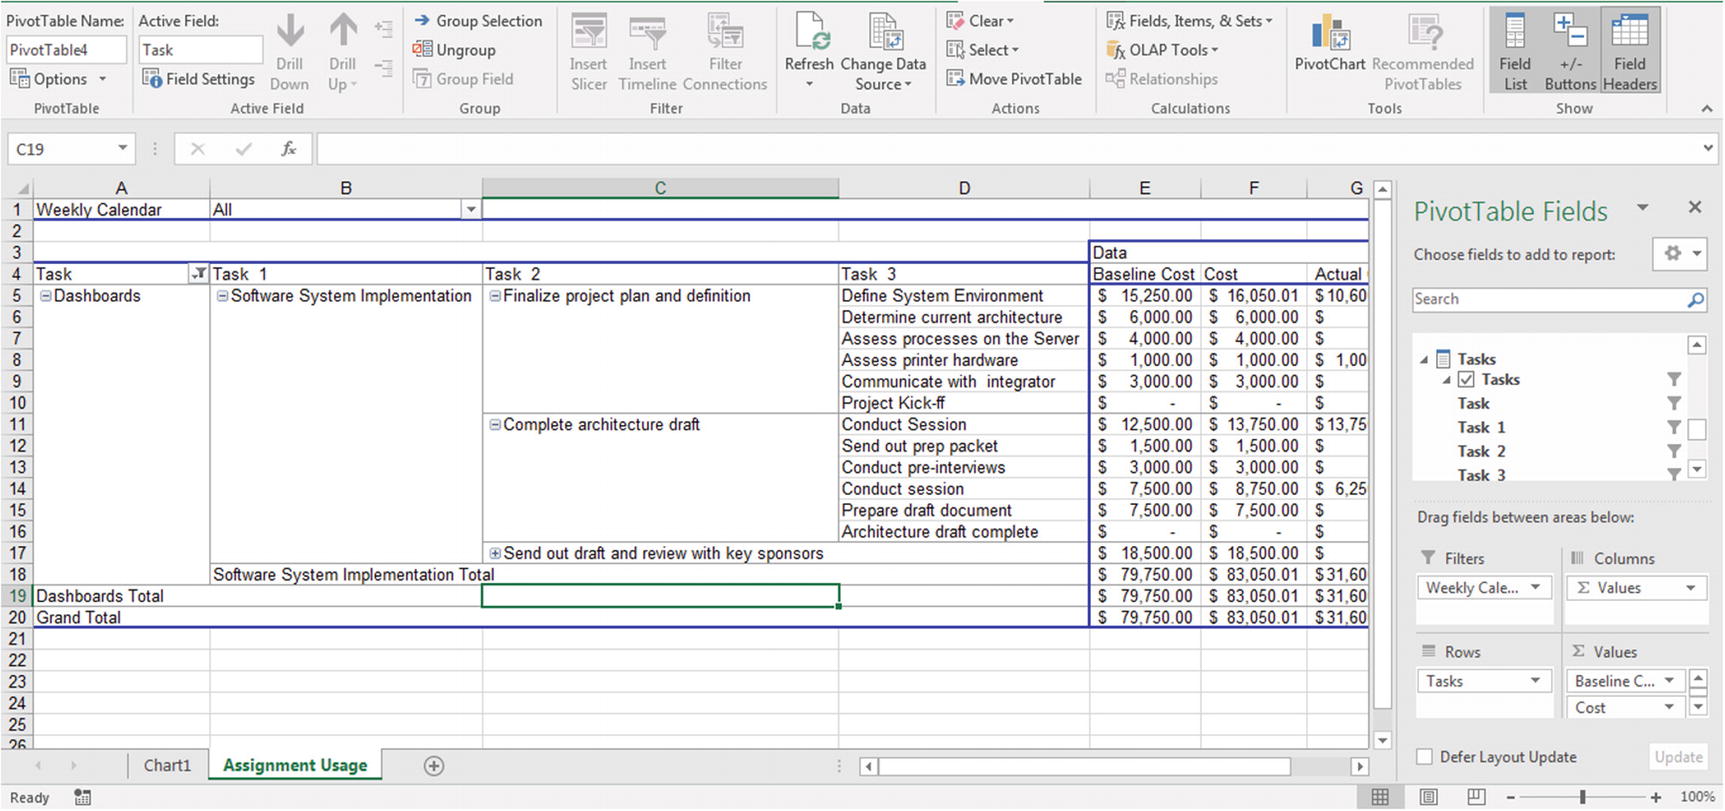 Figure 15-123
PivotTable Fields sidepane
- 10.
From the File menu in Microsoft Excel, click Close. You will be asked if you want to save the Excel document. If you click Save, you will save this report as a Microsoft Excel Workbook. Click Don’t Save and return to Microsoft Project.
- 11.Again, open the Visual Reports – Create Report dialog box (Report:Export:Visual Reports), and at the bottom, click Save Data. You will see the following dialog box.
 Figure 15-124
Save Data dialog options

Available pivot table types
- 12.Choose the Task Usage pivot table type. Then click the Field Picker button to see the available and included fields in this cube.
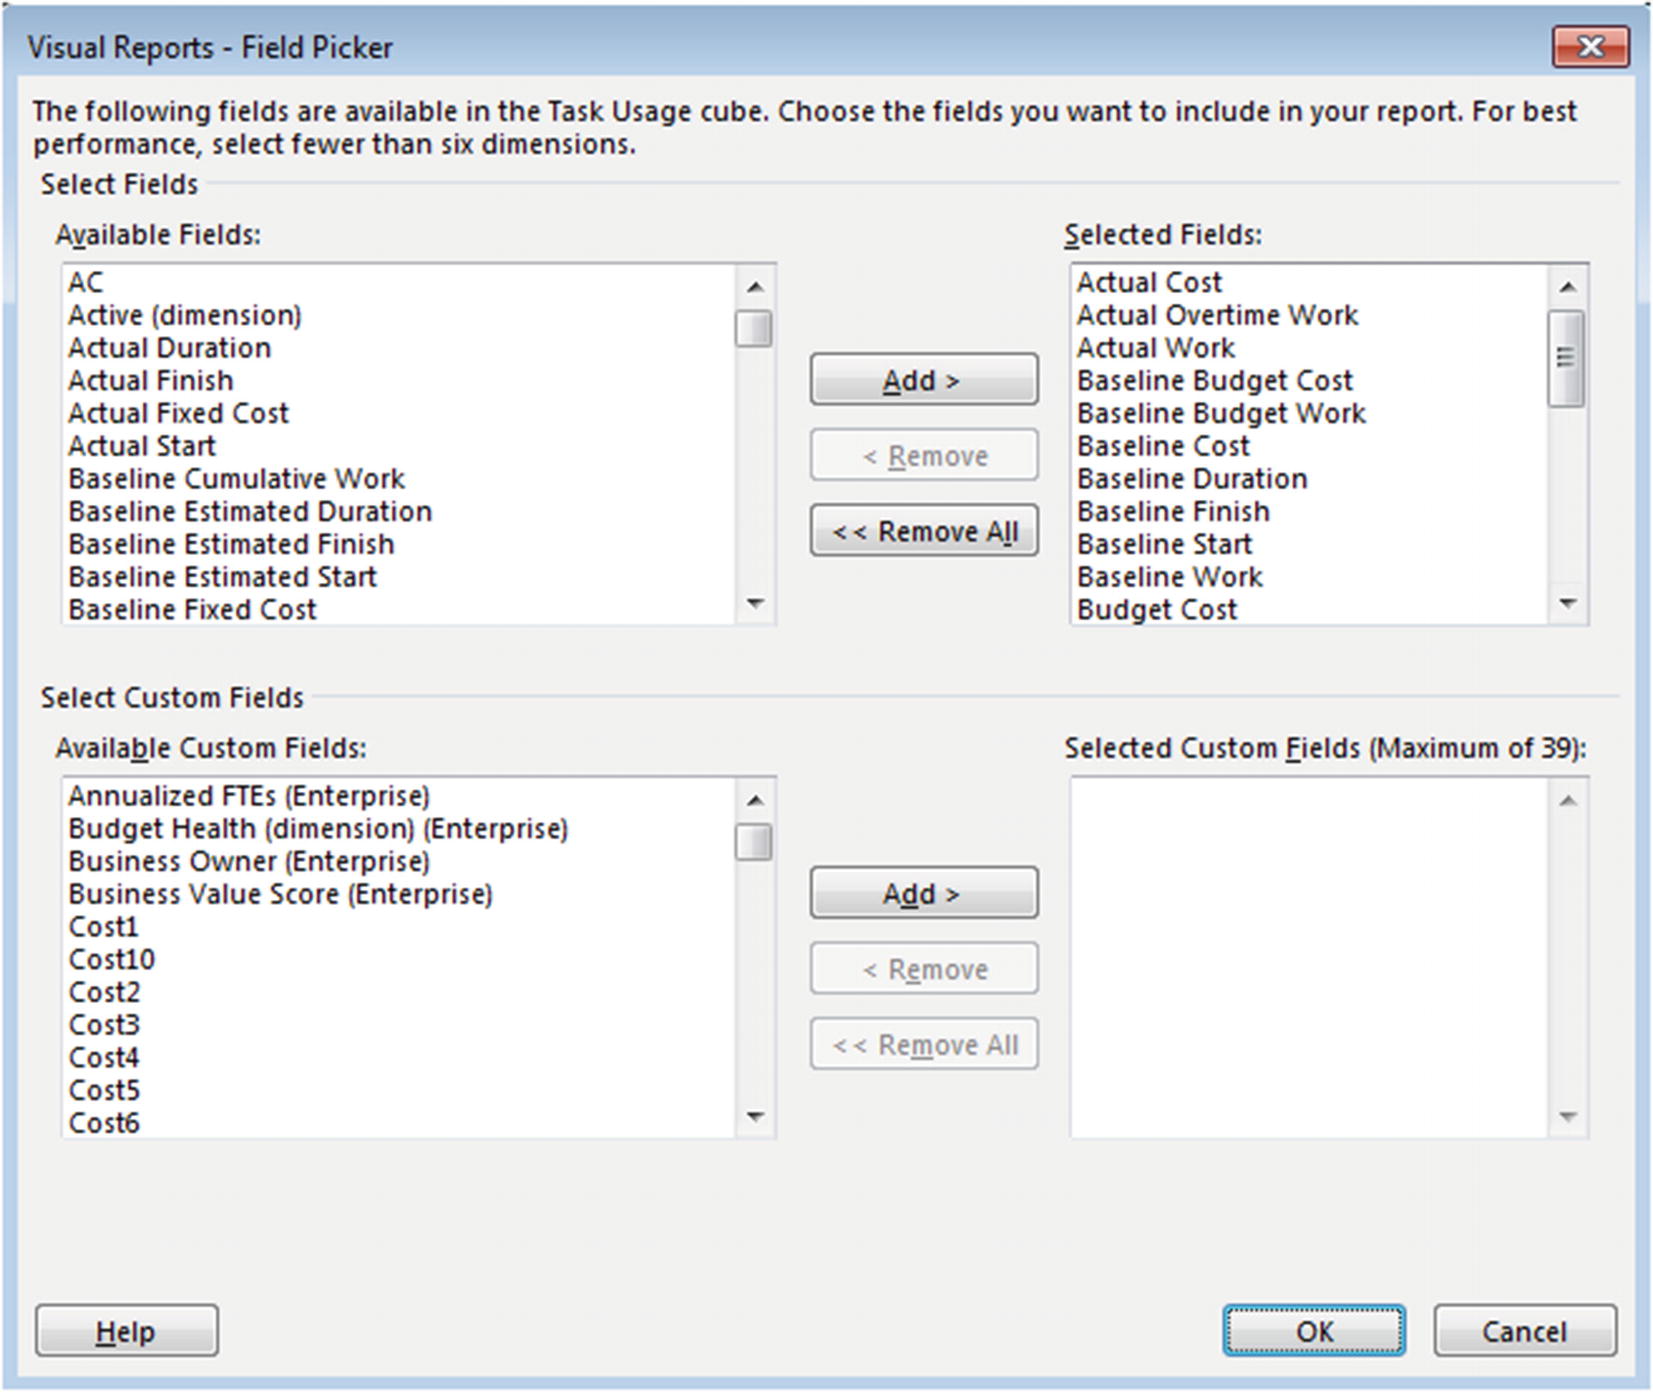 Figure 15-126
Field Picker tool
- 13.
Click Cancel to return to the Save Reporting Data dialog box. Click Close to return to the Visual Reports – Create Report dialog box.
- 14.
Save and close your project.
Some of the visual reports can also be rendered in Microsoft Visio. If you look at the icon next to each report name, you will see that the Excel and Vision icons indicate which type of output will be rendered from each visual report.
 End of Chapter Quiz Questions
- 1.
Which function enables formatting the Gantt bars and associated text labels on the Gantt Chart?

- 2.
Fill the blank: By comparing a task’s baseline to its plan in the __________ __________ view, you can see how a task’s actual schedule compares to its original estimate.
- 3.
How can you set the Current Date for a project in Microsoft Project?
- 4.
What are the two ways to change the bar style for a Gantt Chart?

- 5.
How would you insert the column Baseline Start to the left of the Start column in the Entry Table?

- 6.
True or False: Microsoft Project allows you to customize and control almost all aspects of information presentation, including views, formats, and layouts.
- 7.
Fill in the blank: Microsoft Project 2019 ________ calculates the difference between current progress and original estimates.
- 8.
What are the five different variance fields that Microsoft Project automatically calculates, and how are they calculated?

- 9.
How do you get accurate variance data when using % complete tracking?

- 10.
Fill in the blank: Any time the current estimated values are higher than the baseline values, the resulting variance will be a ________ number. This means that any variance greater than is considered ________.
- 11.
What can you see using the Project Statistics dialog box?

- 12.
What is a table?

- 13.
What can you do if none of the standard tables meet your needs?

- 14.
What are the most useful views for tasks?
__________________ and __________________
- 15.
What are the most useful views for resources?
__________________ and __________________
- 16.
What are the most useful views for assignments?
__________________ and __________________
- 17.
What does the Task Usage view display?

- 18.
What does the Resource Sheet display?

- 19.
What does the Resource Usage view display?

- 20.
How would you show the critical and non-critical tasks, as well as progress against those tasks, using a comprehensive view that shows estimates, actuals, and baselines all on the same Gantt Chart?

- 21.
True or False: There is no table that shows all five types of variance.
- 22.
How do you display the Variance table?

- 23.
How can you display cost variances in your project?

- 24.
How can you display work variances in your project?
___________________________________________________________
- 25.
How can you display schedule variances in your project?
___________________________________________________________
- 26.
Fill in the blank: The Variance table includes the ________ and ________ variance fields.
- 27.
What are filters in Microsoft Project, and when would they be helpful?

- 28.
How would you sort by multiple fields?

- 29.
Describe the Group by function.

- 30.
How do you create a new view?

- 31.
What are the two major categories of custom fields and who usually sets them up?

- 32.
What is the simplest and easiest way to share your custom objects to your other project files?
___________________________________________________________
- 33.
What are the four categories of preconfigured reports on the Report toolbar?
_________, _________, _________, and _________.
- 34.
How can you create a new report from a template?

- 35.
What does the Visual Reports function provide?

- 36.
How can you access the visual reports?
