
How Microsoft Project 2019 Handles Data
The Ribbon in Microsoft Project 2019
Navigating in Microsoft Project 2019 Views
Help Options in Microsoft Project 2019
Finding the Right Information
 Learning Objectives for This Chapter
Understand the basic information structure in Microsoft Project 2019
Become familiar with the ribbon in Microsoft Project 2019
Effectively navigate through the most common Microsoft Project 2019 Views
Find the Help options in Microsoft Project 2019
Know how to navigate to and change Microsoft Project options
Develop a comprehensive approach to finding the right information in Microsoft Project 2019
3.1 How Microsoft Project 2019 Handles Data
Microsoft Project 2019 is a powerful tool that allows you to plan, track, analyze, and report on the progress of one or many related projects. In the process of doing so, however, an enormous amount of data is generated. To avoid overwhelming the user, Microsoft Project uses a clever data management approach that simplifies the project manager’s job.
A project consists of activities that have a distinct beginning and end (known as tasks) and the people, equipment, and supplies used to complete those activities (known as resources).

Microsoft Project’s data categories
Microsoft Project also saves modified objects with the Microsoft Project plan.

Sample Organizer dialog box displaying a list of objects that are saved in Microsoft Project files
We mentioned earlier that project managers have to manage time, cost, and scope. Microsoft Project creates hidden storage areas that contain the necessary data. The Tasks area (above) contains details about each task—how long it should be (duration) and its relationship to any other tasks (dependencies). This is organized in a database format, with each row representing an individual task and each column a field associated with that task, as creating a task generates a large number of related fields. The Resources area contains details about each resource, including how much it costs to use that resource and availability data, such as how much time each person can devote to project work each day.
In theory, one could create a project schedule from the scope-related information (duration and dependency) for each task, but clearly resource availability affects when a task can be done. For that reason, connecting a task with a resource generates a resource assignment stored in the Assignment area. This combined information is used by Microsoft Project to create the actual schedule.
In addition to Tasks, Resources, and Assignments, there will be higher-level data related to the project itself, rather than its detailed components. Examples might include the geographic location of the project, the business unit that owns or requested the project, or the name of the project manager. The Project area gives us a place to store that type of data and is especially important for published projects, as we will see later.
Microsoft Project 2019 provides many different ways to enter, view, and report information about the tasks, resources, and resource assignments in a project. As with all Microsoft applications, these can be menu-driven or controlled by icons on toolbars.
3.2 The Ribbon in Microsoft Project 2019

The Microsoft Project 2019 ribbon
- 1.
Click the File tab and then select Options (going forward we will document this functionality as File:Options) at the bottom of the left sidebar. The Project Options dialog box will appear.
- 2.
In the left sidepane of this box, select Customize Ribbon.

Project Options dialog box with Customize Ribbon selected
- 3.
Click the Add and Remove buttons as required to move commands to and from various tabs in the ribbon.
- 1.
Click File:Options to open the Project Options dialog box.
- 2.
In the left sidepane of this box, select Quick Access Toolbar.
- 3.
Click the Add and Remove buttons as required to move commands to and from the Quick Access Toolbar. In the following figure, the command “Link the Selected Tasks” has been selected for addition to the Quick Access Toolbar.
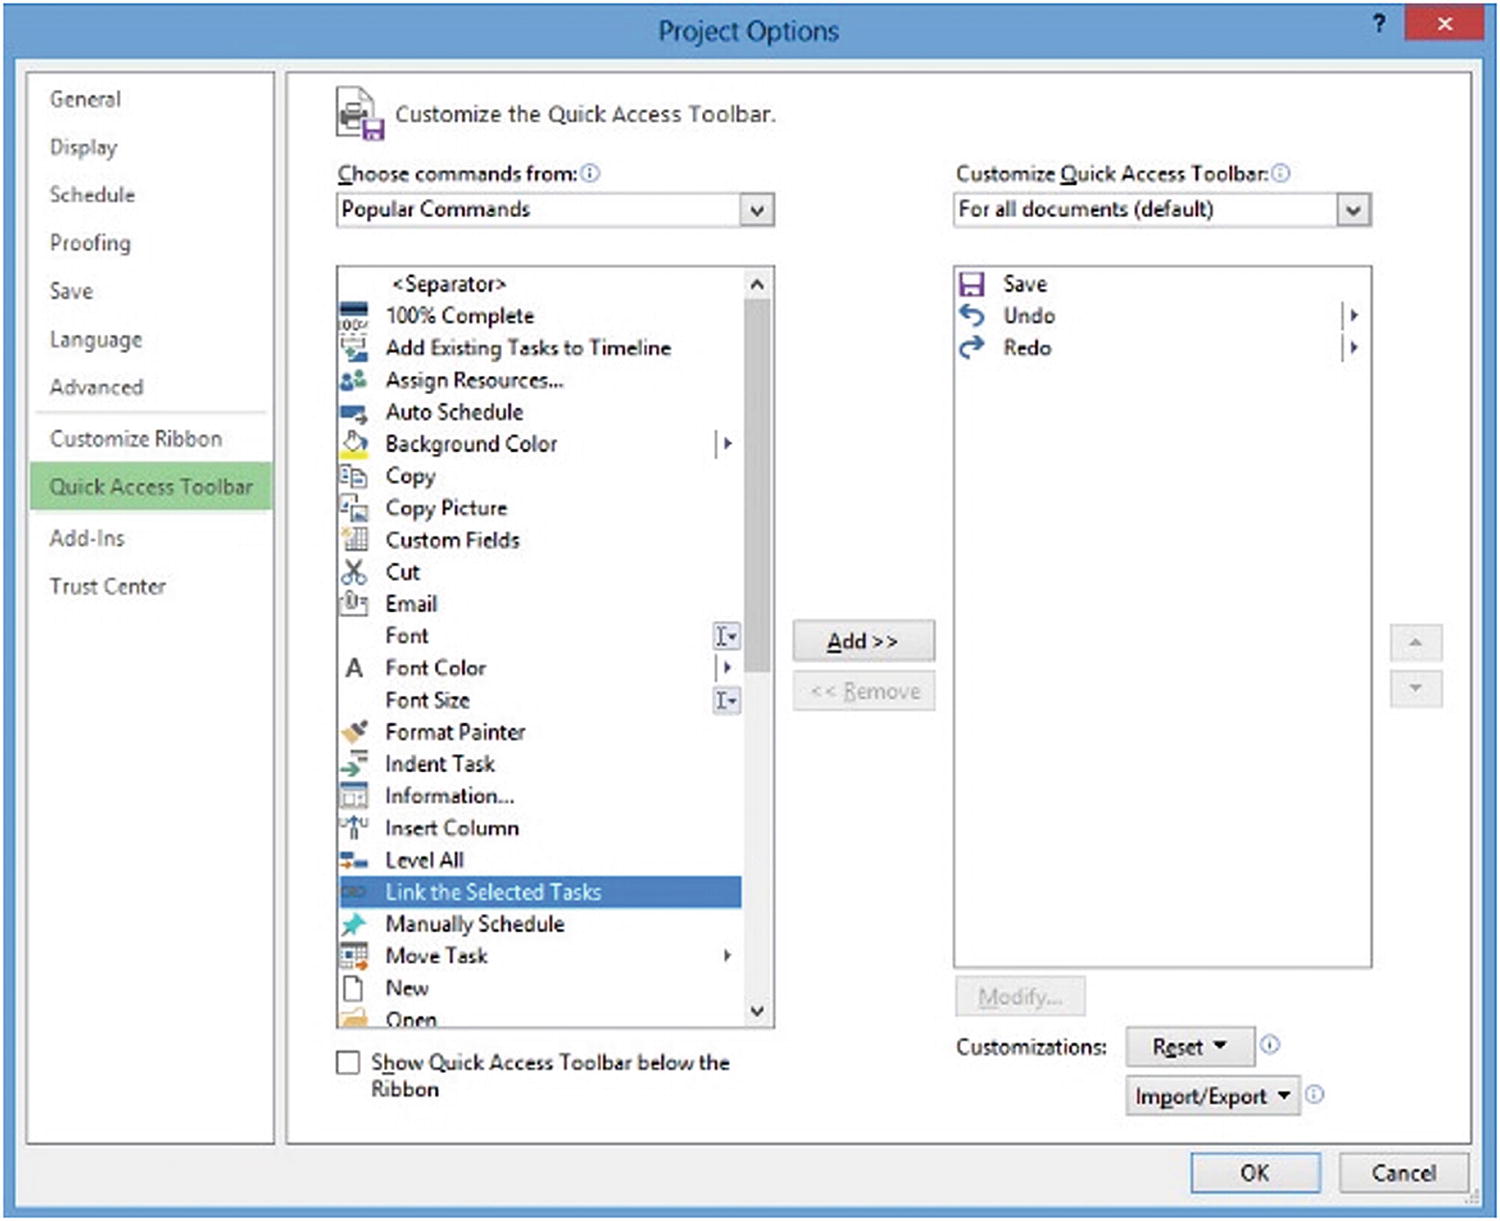
Project Options dialog box with Quick Access Toolbar selected
- 4.
Click OK to save your change. You will now see the Link the Selected Tasks icon in the Quick Access Toolbar.

Link the Selected Tasks icon

Right-clicking a tab
3.3 Navigating in Microsoft Project 2019 Views
Familiarizing Yourself with the Microsoft Project 2019 Screen
Once the desired view has been selected, finding the correct information within that view is fairly easy—that is, if you know the shortcuts and navigation tools available.
- 1.
In the left sidebar, you will see a list of recently opened projects, as shown in the following figure. Note: Your screen may differ as it will reflect projects you have recently opened.

Initial screen
- 2.
Assuming Navigation.mpp does not appear in the list of recently opened projects, select Computer and then click Browse to see the Open dialog box. From the Open dialog box, navigate to and select the file Navigation.mpp, and click Open.
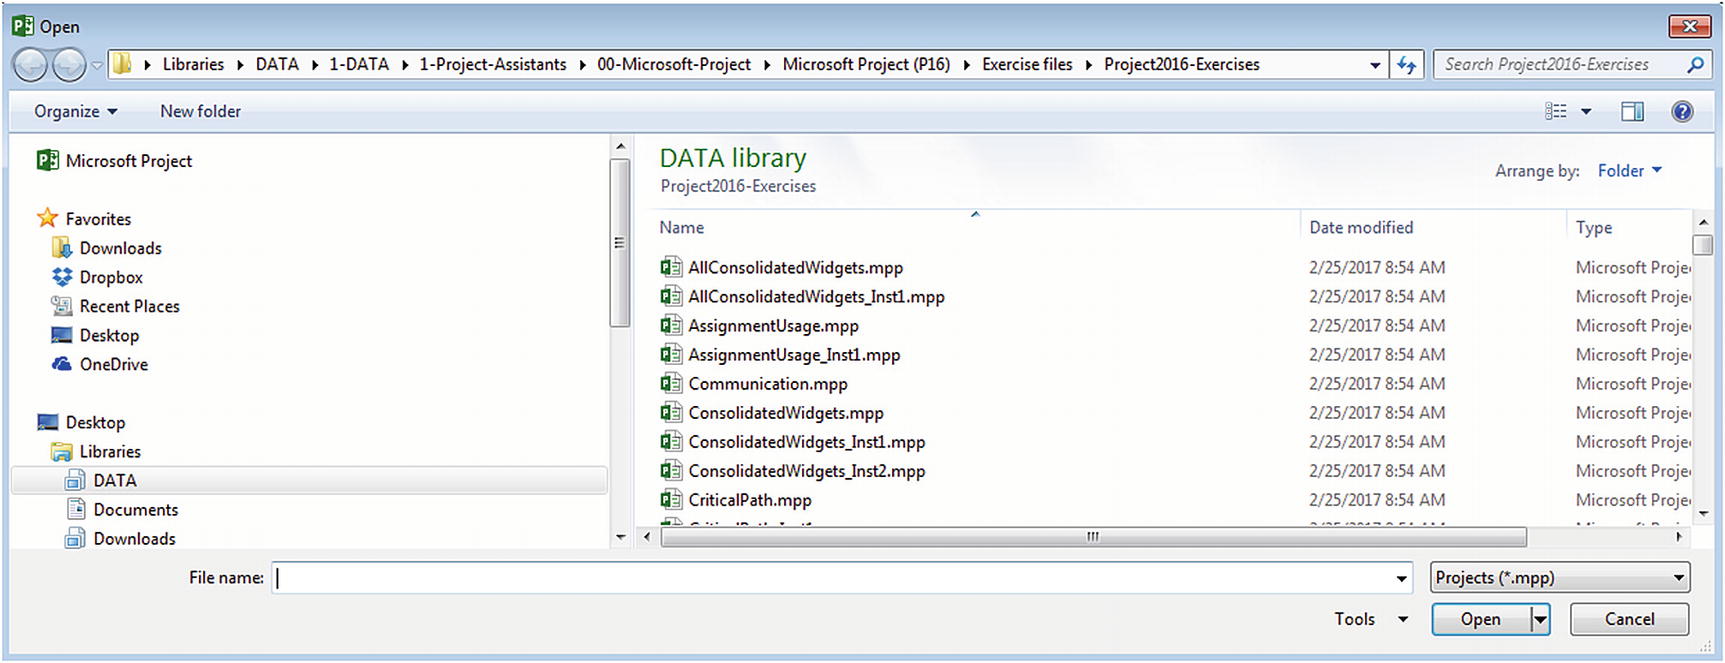
Open dialog box
- 3.
Click the right arrow button at the bottom of the task list section of the screen to scroll through the columns that are hidden behind the Gantt Chart. Your screen will resemble the following as you scroll through the various columns.

Scrolling through columns
- 4.
The vertical line that divides the data fields on the left from the chart on the right is the divider bar. Place the cursor on the divider bar to see a double vertical line with horizontal arrows. Click and drag to the right to show more data fields or to the left to show more of the Gantt Chart.
- 5.
Move your mouse over the cell just above Task ID 0. The following text box will appear to inform you of which view and table is currently applied to your project.

Display of Table and View
- 6.
Click the cell above Task ID 0 to Select All. Your screen will resemble the following.

Select all
- 7.
Press Ctrl+End on the keyboard. Your view will jump to the last column in the task list.
- 8.
Press Ctrl+Home. Your view will return to the first row and column of the task list.
- 9.
Press Alt+End. Your view will jump to the end of the project’s Gantt bars.
- 10.
Press Alt+Home. Your view will shift to the start of the project’s Gantt bars.
You can expand and collapse tasks hierarchically using the + or – on tasks. Alternatively, you can navigate to View:Data and then select the desired outline level from the Outline dropdown list.
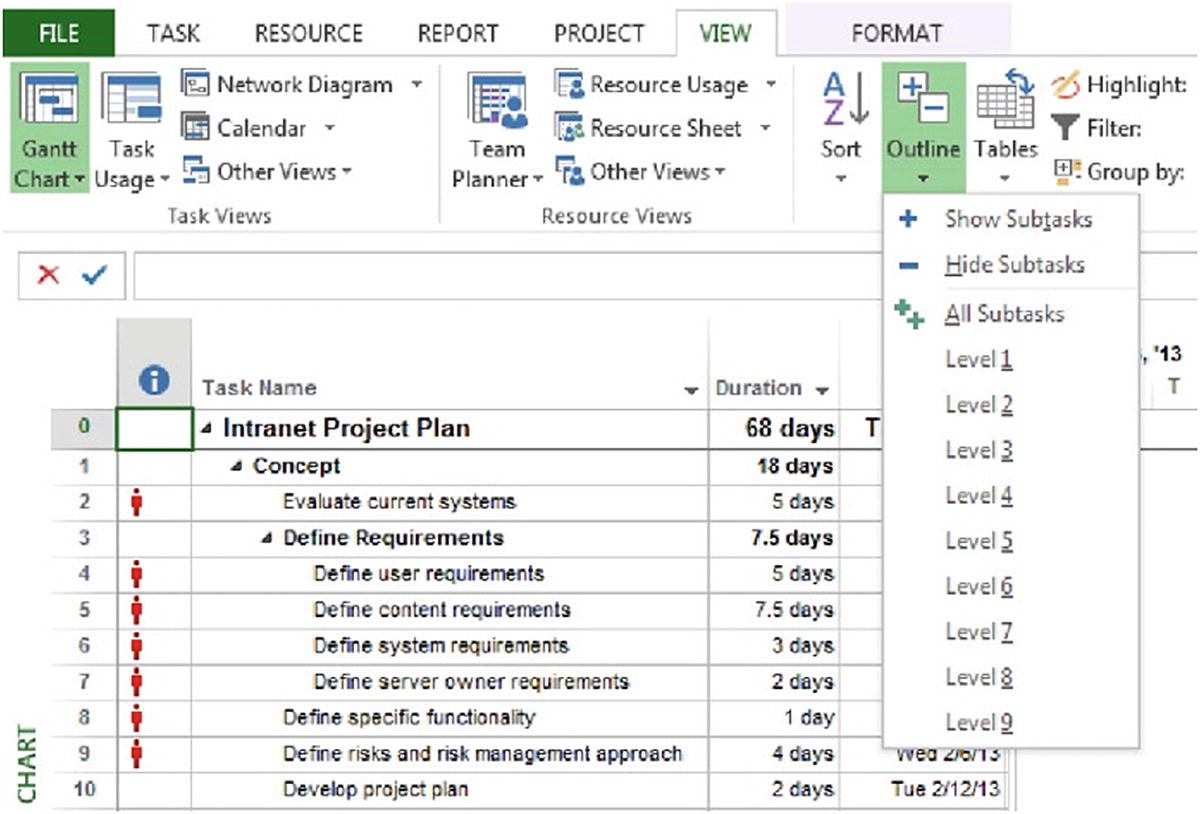
Outline level options
- 11.Select View:Data:Outline:Outline Level 1. This collapses the list of tasks so that your screen will resemble the following.
 Figure 3-14
Screen after collapsing list of tasks
You may want to adjust the timescale on the right side of the Task Usage, Resource Usage, or Gantt Chart views (e.g., if the default timescale is daily and you need a weekly or monthly summary). There are several ways to do this.
- 12.
From View:Zoom adjust the timescale by clicking the Zoom icon [
 ] and selecting Zoom In, Zoom Out, or Zoom. Zoom brings you to the Zoom dialog box where you can specify the desired Zoom level.
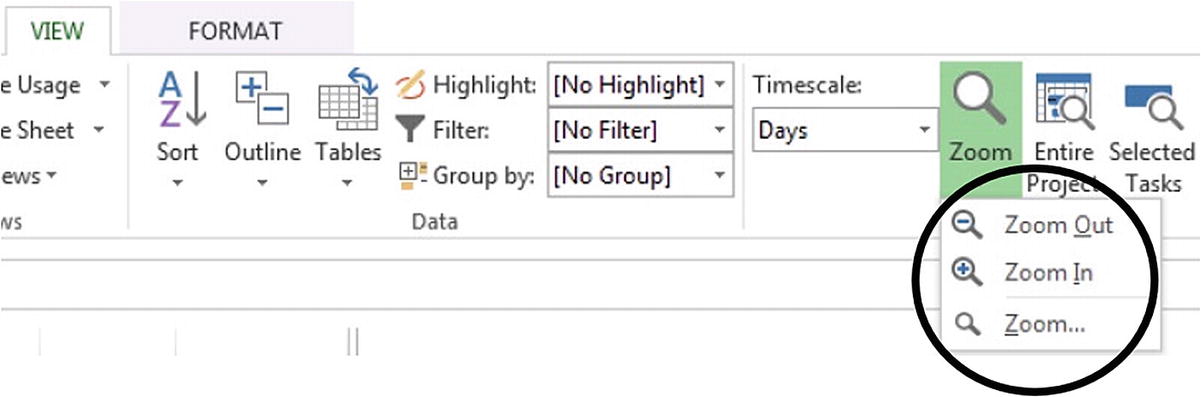
Adjusting the timescale
- 13.
In the Zoom group, the Timescale dropdown allows you to adjust the Units (e.g., from Days to Weeks or Months), along with any other items you want to change.
- 14.
The Entire Project or Selected Tasks icons in the Zoom group will resize to automatically fit the entire project or any selected tasks.
- 15.
At the bottom right of the screen is a Zoom Slider that can be moved left or right to increase or decrease the timescale.
- 16.
Move your mouse over the link line between Concept (Task ID 1) and Determine the layout of the site (Task ID 14). You will be presented with a screen tip for the task dependency, which displays the type of task dependency, the names of the dependent tasks, and any lag time between the tasks.

Screen tip for task dependency
- 17.
From the Task tab, select Task 12, Web Site Design, and in the Editing group, click the Scroll to Task icon [
 ]. Selecting a task and clicking the Scroll to Task button shifts the start of the selected task’s corresponding Gantt bar into view. Your screen will resemble the following.

Scroll to Task button
- 18.
Move your mouse over the Gantt bar for the task Evaluate current systems (ID 2). The start date, finish date, and duration of the task will appear in a box.
- 19.
Locate the task Define specific functionality (ID 8) and move your mouse pointer under the ID number until the icon changes to a double-ended arrow.
- 20.
Hold your mouse button down and drag the bottom line downward, and a dotted line will appear to help you determine where you want to set the row height.

Drag line
- 21.
Release your mouse button when the dotted drag line is midway through the Develop project plan (ID 10) row to make the row for Task 8 double height.
- 22.
Move your mouse pointer to the bar between the Task column heading and the Duration column heading until the icon changes to a double-ended arrow.
- 23.
Hold the mouse button down and drag the line either left or right to adjust the column width as required, just as you did to adjust row height in the previous section.
- 24.
To modify a task name, click to select the cell, and then click the same cell again to enter Edit mode. Locate the task Define risks and risk management approach (ID 9). Add the words “for corporate management” and press Enter. Notice that the long task name for Task 9 automatically wraps in the cell. Your screen will resemble the following.

Auto-wrapped text for Task 9
- 25.
You can add a separate data entry bar to display and edit text. To do so, go to File:Options to see the Project Options dialog box.

Project Options dialog box
- 26.
In the Project Options dialog box, select Display and then check Entry bar in the Show these elements section. Click OK. The contents of the active cell will display in an entry bar below the ribbon.

Contents of Task ID 9 displayed in the entry bar
- 27.
Alternatively, you can wrap text by selecting Format:Columns and then using the Column Settings dropdown list to select Wrap Text.
Microsoft Project 2019 allows you to modify the background of text cells, as well as the text itself.
- 28.
Locate the task Brief web development team (ID 11) and select the Task Name cell. The Task tab contains several buttons that allow you to make formatting changes to the selected text cells.
Click the small boxed arrow at the bottom right of the Font group to open the Font dialog box. Change the Color from Automatic to White and the Background Color from Automatic to Black. Select a Background Pattern that seems appropriate (solid, in the following example).
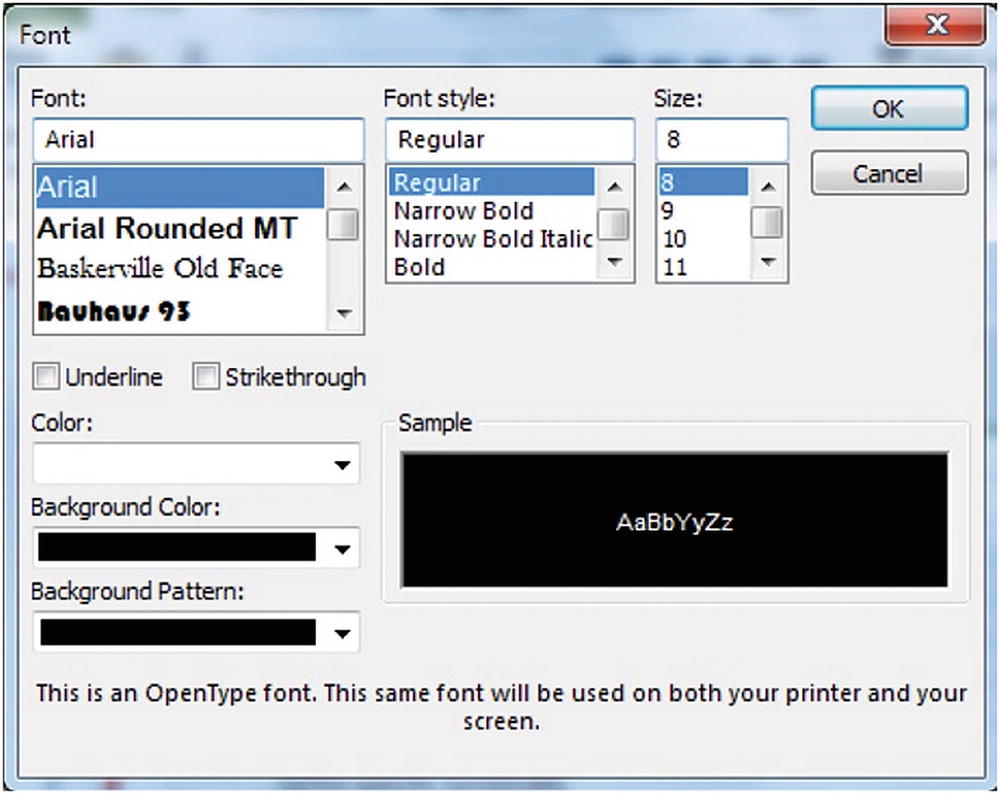
Modified font background instructions
- 29.
Click OK and the cell format is changed.
- 30.
From the File menu, click Close, and close Navigation.mpp without saving your changes.
3.4 Help Options in Microsoft Project 2019
- 1.
Start Microsoft Project 2019 without connecting to Project Server and click the Help button [
 ] in the upper-right corner of your screen. This icon will appear in the same place within every screen.

New screen with Help button circled
- 2.
Microsoft Project will present a web page for Project Help dialog box similar to the following.

Project Help page
- 3.
Use this interface to find a link to the information you need, or enter a search term to perform a more thorough search online.
- 4.
Close the Project Help window by clicking the X in the upper right-hand corner of the dialog box.
3.5 Finding the Right Information
The trick to using Microsoft Project effectively is first to know what type of information you are looking for and then to know which view you can use to display this information. A view is a set of formatting instructions that tells Microsoft Project what data to present and how to organize it into a useful format so that each view displays a unique combination of project information. Once you are in the correct view, you can modify the display to view the exact information you require, as described later.
Views in Microsoft Project 2019 can be categorized into sheet views, chart and graph views, and form views. Each of the available views will provide different presentations of project information. Unfortunately, with 27 different views to choose from, simply deciding which one to use can be a challenge.
For example, the default Gantt Chart view includes a calendar bar chart on the right side of the screen and a table of data on the left side. A table is a set of formatting instructions that specifies which fields from the data storage area should appear on the screen. The default Entry Table, for example, contains ID (the task numbers), Name (titled Task Name), Duration, Start, Finish, Predecessors, and Resource Names (who is assigned to the task).
The decision tree in the next section is intended to help guide you to the six most useful views in Microsoft Project. Microsoft Project 2019 does help by automatically opening certain views for you (e.g., custom tracking views when you set up the tracking method to be used for the project), but remembering these six views will save you valuable time.
For task information, the Gantt Chart (with and without a split window) is generally most useful. For resource information, the Resource Sheet (with and without a split window) is best. For assignment information, the Task Usage and Resource Usage views are the best starting points.
Selecting a View

- If you require task-based information, next decide if you are interested in information with or without resource assignments.
If the information you require is task-based, without resource assignments, the Gantt Chart should meet your needs (see Note 1 for additional detail).
If the information you require is task-based, with resource assignments spread over time, the Task Usage view should meet your needs (see Note 2 for additional detail).
If the information you require is task-based, with resource assignments not spread over time, the Gantt Chart with details in the lower pane (split window) should meet your needs (see Note 3 for additional detail).
- If you require resource-based information, next decide if you are interested in information with or without task assignments.
If the information you require is resource-based, without task assignments, the Resource Sheet should meet your needs (see Note 1 for additional detail).
If the information you require is resource-based, with task assignments spread over time, the Resource Usage view should meet your needs (see Note 2 for additional detail).
If the information you require is resource-based, with task assignments not spread over time, the Resource Sheet with details in the lower pane (split window) should meet your needs (see Note 3 for additional detail).
- If you are not seeing the information you want on the left side of the divider of the Gantt Chart view
Apply a table that contains the columns (or fields) you wish to view.
Add columns to the existing table.
Add columns to the existing table and then apply the table.
Create a new table that contains the columns (or fields) you wish to view.
- If you are not seeing the columns you want on the left side of the divider on the (Task or Resource) Usage View, you can do one or more of the following:
Apply a table that contains the columns (or fields) you wish to view.
Add columns to the existing table.
Add columns to the existing table and then apply the table.
Create a new table that contains the columns (or fields) you wish to view.
- The grid on the right side of the (Task or Resource) Usage view contains timephased information—work details broken down on a day-by-day basis (this time phasing can be modified). If you are not seeing the columns you want to see on the right side of the divider on the Usage view
To change the timescale, in the View:Zoom section of the ribbon, use the Zoom dropdown arrow to Zoom in/Zoom out.
To see a short list of display options for this grid, right-click anywhere in the grid area. When you do so, you will see the following list.
 Figure 3-25
Timephased details list
- If the data in the timescale (for the task, resource, or assignment you wish to view) is not appearing on the screen
From Task:Editing, click the Scroll to Task icon.
Zoom in/Zoom out.
In the Format:Zoom section of the ribbon, adjust the timescale.
- In the lower pane, if you are not seeing the fields you want to see
Right-click in the lower pane and select Predecessors & Successors, Resources & Predecessors, Resources & Successors, Schedule, Work, Cost, Notes, and/or Objects, as appropriate.
From View: (Task or Resource) Views, use the Other Views dropdown list to select More Views and then choose the appropriate “form” view.
From View:Split View, use the Details dropdown list to select the appropriate view.
- If you are not seeing the columns you want on the upper pane of the Gantt Chart view
Apply a table that contains the columns (or fields) you wish to view.
Add columns to the existing table.
Add columns to the existing table and then apply the table.
Create a new table that contains the columns (or fields) you wish to view.
- If you are not seeing the fields you want to see on the lower pane
Right-click in the lower pane and select Schedule, Work, Cost, Notes, and/or Objects, as appropriate.
From View: (Task or Resource) Views, use the Other Views dropdown list to select More Views and then choose the appropriate “form” view.
From View:Split View, use the Details dropdown list to select the appropriate view.
Evaluating the Most Useful Views
- 1.
When you open a Microsoft Project file, you will see the Gantt Chart view by default.
Navigation.mpp—Gantt Chart view
- 2.
Double-click a task name to see the Task Information dialog box, containing summary information about the selected task. The following figure shows a summary of the task information for Define content requirements.

Define content requirements Task Information
- 3.
To view task-based information with resource assignments summarized over the project lifetime, the Gantt Chart (with window split) is the most useful view. As covered earlier, Microsoft Project defaults to the Task tab and Gantt Chart view upon opening.
- 4.
In the ribbon, the View group (top-left of your screen) includes a Gantt Chart view icon [
 ]. Clicking the arrow next to Gantt Chart displays a dropdown list of additional views.

Gantt Chart dropdown
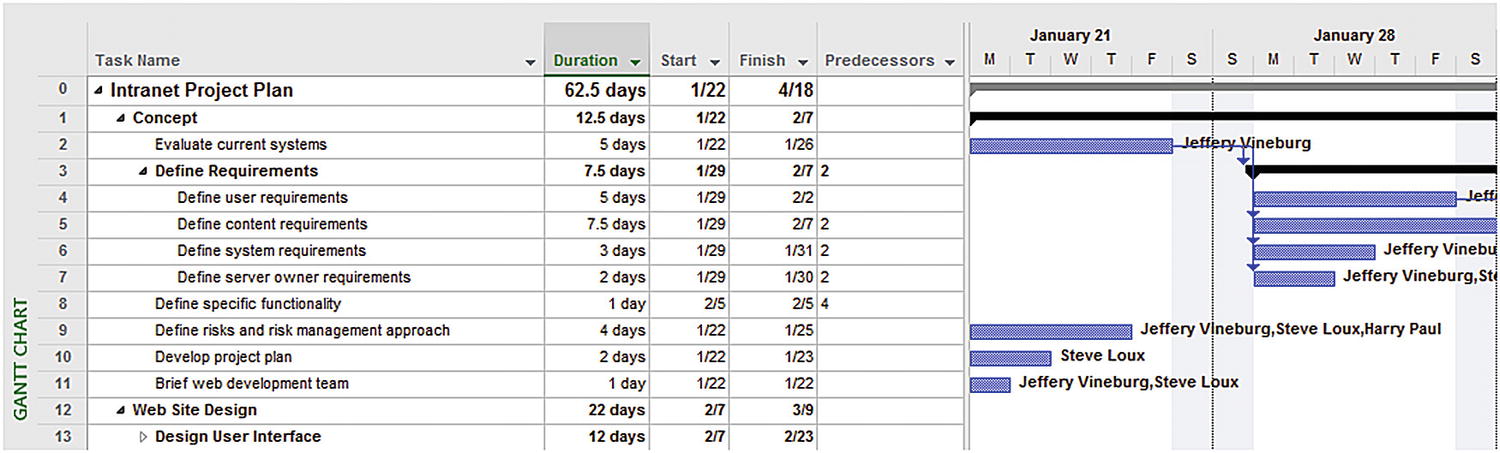
- 5.To display the assignment information for these Gantt Chart tasks, from the Task:Properties group in the ribbon, click the Details button [
 ]. The Task Details Form view is the default view in the lower frame.
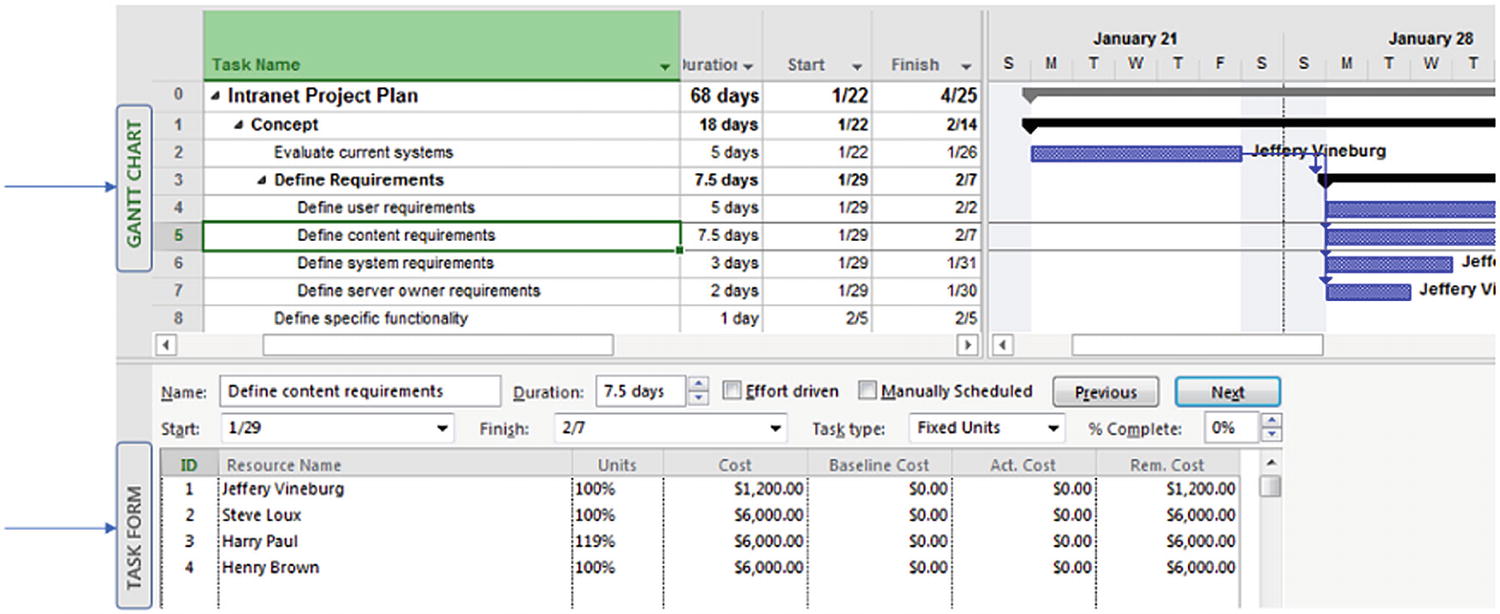 Figure 3-29
Gantt Chart over Task Details Form
The View tab provides many different viewing options. For example, this tab contains the Gantt Chart icon at the left in the Task Views group. In the Split Views group, selecting details includes the Task Form as the default, as well as several additional choices.
Notice that the information in the Task Form window(s) refers to an individual task in the preceding Gantt Chart. This information is summarized over the life of the task.
- 6.
Several different types of summarized information can be shown in the Task Form. To see the options, right-click in the gray area on the right side of the Task Form. A box similar to the following will appear.

Task Form options
- 7.
To view resource-based information without assignment details, go to Task:View and select the Resource Sheet view. Your screen will resemble the following.

Resource Sheet view
- 8.
Double-click a Resource Name to see the Resource Information dialog box with details about that resource.

Resource information for Jeffery Vineburg
- 9.
As covered earlier, to view resource-based information with resource assignments summarized over the project lifetime, the Resource Sheet (with window split) is the most effective view. To get to this view from the Resource Sheet view, from the View tab, select Details in the Split View group.
The Resource Form view should be the default view in the lower frame, as shown in the following figure. Alternatively, you can select the Resource Sheet (with window split) view from the Task and Resource tabs.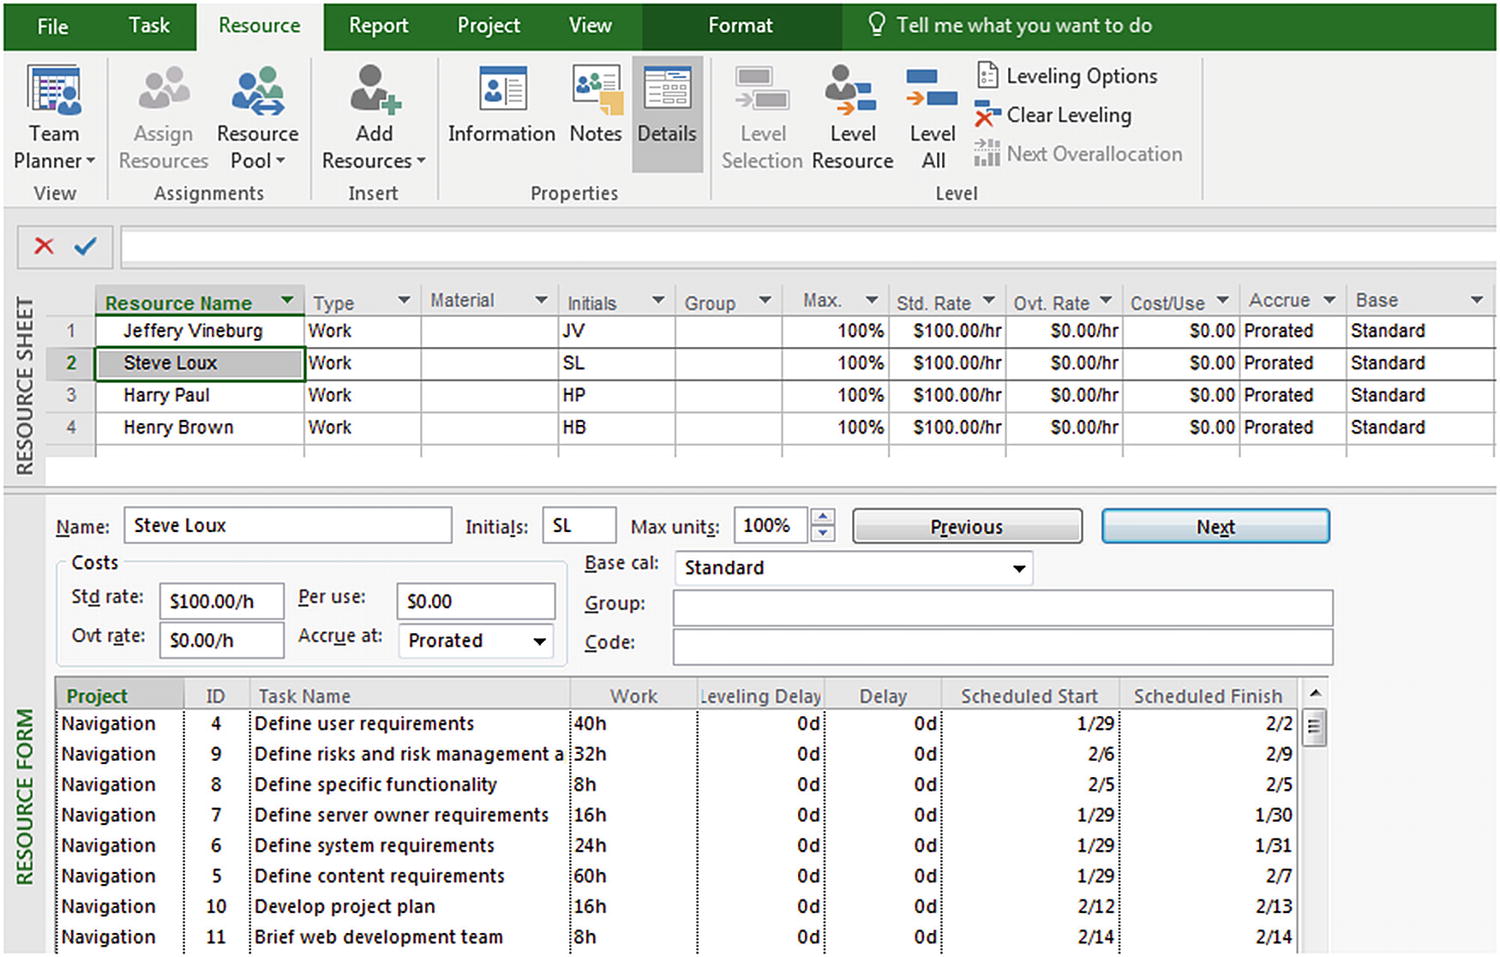 Figure 3-33
Resource Sheet (with details selected, split screen)
The preceding view provides the “big picture” about resources in the upper window (Resource Sheet), with details about their assigned tasks in the lower window (Resource Form).
- 10.
As with the Task Form, various types of information can be presented in the Resource Form. To see the options, right-click in the gray area on the right side of the Resource Form view to see the following list of options.

Resource Form options
- 11.
To view assignment details by task, from Task:View, select Task Usage. Alternatively, you can go to Task Views:Views:Task Usage. Your screen will resemble the following.
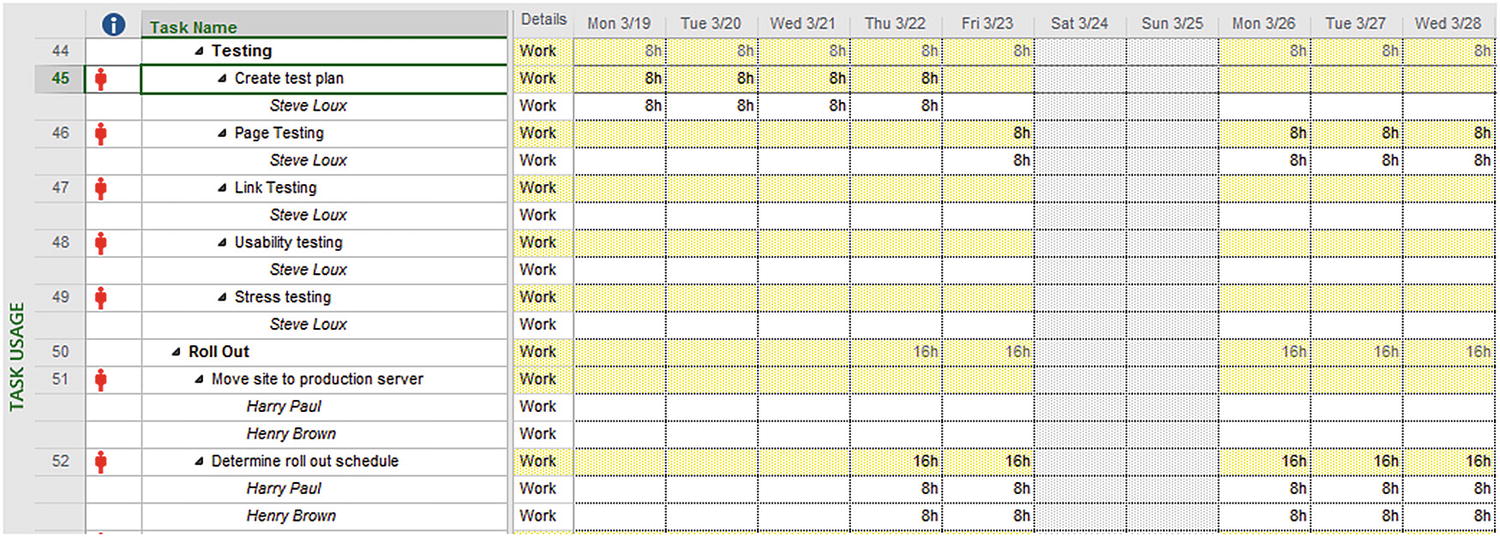
Task Usage view
- 12.
The italicized names below each task represent each person’s assignment to that task. If you double-click a name under a task, you will see an Assignment Information dialog box with details about that person’s assignment to the task.

Assignment information for Jeffery Vineburg for the task Evaluate current systems
- 13.
The grid on the right side of the view contains timephased information—task assignment details broken down on a day-by-day basis (this time phasing can be modified). To see a short list of display options for this grid, right-click anywhere in the grid area. When you do so, you will see the following dialog box.

Timephased details list
- 14.
To see a complete list of fields you can modify, click Detail Styles… in the preceding box. The Detail Styles dialog box will appear.

Detail Styles dialog box
- 15.
You can also view assignment information sorted by resource, rather than by task. For this option, from View:Resource Views, select Resource Usage. You can also access the Resource Usage view via the Task and Resource tabs. Your screen will resemble the following.

Resource Usage view
- 16.
As with the Task Usage view, you can double-click an italicized task name (an assignment) to view the Assignment Information dialog box.
Display the Information You Want
Once you have selected the appropriate view for your purposes, you can adjust the view in various ways to show any specific information you need.
- 1.
From View:Data, click Tables. From the dropdown, select the appropriate table. You can also select More Tables to review other tables to apply to the view or to create new tables, as we’ll describe shortly.
- 2.
You can also insert a new data field into a table by clicking the Add New Column heading (the last column) and selecting a field from the list. A column may also be inserted by navigating to Format:Columns and clicking Insert Column per the following figure.
Select the column and drag to position it as desired.

Inserting an additional column
When you are working in an enterprise environment using Microsoft Project Professional, changes made to tables and views will apply to the modified project only. For modified or new tables to be available to all enterprise projects or to be used in the published version of any project, they must be created as part of the Enterprise Global by a Project Server administrator.
Using the View Bar

Select View Bar

View bar
Timeline View
Microsoft Project 2019 includes a timeline view that by default is displayed above other views, showing a concise overview of the entire schedule. You can add tasks to the timeline and even print it for a clear summary report of the entire project. You can also easily paste the timeline into an e-mail or other document for an instant report.
- 1.
To enable the Timeline view, from View:Split View, select the Timeline checkbox. A timeline bar representing the entire project will display below the ribbon, as in the following figure.

View of timeline with Gantt Chart
- 2.
The Zoom commands found in View:Zoom (for the Gantt Chart) work in conjunction with the timeline as well. To display additional tasks on the timeline, select Evaluate current systems, and then from Task:Properties, click the Add to Timeline icon [
 ]. Alternatively, you can right-click the task and from the resulting list select Add to Timeline.
 - 3.
You can also display milestones on the timeline. Select User interface designed, and from Task:Properties, click Add to Timeline. Your timeline will resemble the following.

Sample timeline
- 4.
By default tasks are displayed as a bar on the timeline, but they may also be displayed as a callout text box. Add the task Evaluate current systems to the timeline, and then right-click this task in the timeline and select Display as Callout (or from Format:Current Selection, click Display as Callout). Your timeline will resemble the following.

Sample timeline with callout
- 5.
Right-click the timeline bar and select Detailed Timeline. This will collapse the bar’s height and shrink the display while leaving the tasks visible on the timeline.
- 6.
Close your project without saving the changes.
Microsoft Project 2019 includes new features for the Timeline that make it easier to communicate project progress. Now, the tasks display their progress right on the bar. Also, you can label timeline bars to more clearly demonstrate status updates for work in progress.
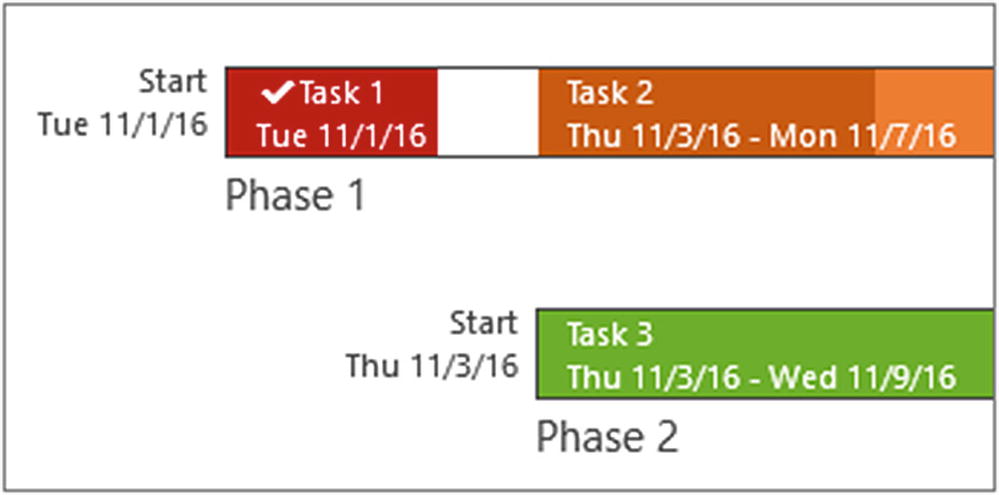
Timeline bars with labels
Calendar View
- 1.
The Calendar view displays tasks in the form of a wall calendar. To access the Calendar view, from View:Task Views, select Calendar. Your screen will resemble the following.

Calendar view
- 2.
By default, the current month appears in the view. Click the Week button at the upper left of the Calendar view to see the current week only.
- 3.
Click Custom and you will see the Zoom dialog box. Change the number of Weeks to “2” and click OK. Your screen will resemble the following figure. You can use the Zoom dialog box to control the number of weeks the Calendar view includes or to specify a date range.

Calendar Zoom dialog box
How Microsoft Project 2019 Uses Data
Entering data in Microsoft Project 2019 is often just the first step. Behind the scenes, Microsoft Project works to use the data to provide meaningful information for the project manager. This exercise explores how this process works for one specific example.
- 1.
By default you should be in the Gantt Chart view with the Task tab selected. Apply the Gantt Chart view if another view is displayed. From the Properties group, click Details to see the Gantt Chart/Task Details Form combination described earlier.
- 2.Right-click anywhere in the Task Details Form and select Cost from the menu that appears. In the upper half of the screen, select Define user requirements (Task ID 4) to view details about that task in the Task Form. Your screen will resemble the following.
 Figure 3-49
Resource Cost details
Note that the cost of each assignment is now displayed in the lower details pane.
- 3.
Click on the upper half of the screen anywhere to activate the Gantt Chart portion. Notice that the view name on the left side of the screen changes from gray to green to indicate the active view. Click the details box in the Split view group to remove the bottom pane.
- 4.
From the View group, select Resource Sheet to change the screen to display the Resource Sheet view to verify the hourly cost rate for each resource. Your screen will resemble the following.

Resource Sheet
- 5.
Click the Gantt Chart icon to return to the original split Gantt view by clicking the Details option in the Split view menu group. Click any task to see the resource cost for that task. Microsoft Project used the Std. Rate value times the number of hours (work) each resource is assigned to calculate these costs.
- 6.To see the total resource cost for the project, from View:Data, click the Tables icon, and from the dropdown list, select the Cost Table. Move the divider bar between the table and the calendar bar chart to the right until you see the Total Cost column heading. Your screen will resemble the following.
 Figure 3-51
Total resource cost for the project
Behind the scenes, Microsoft Project uses data you provide to calculate additional values that a project manager might want. This is a very useful feature, but it can be confusing to users who don’t realize what is happening, as we will see later.
 End of Chapter Quiz Questions
1. Fill in the blanks: A project consists of activities that have a distinct beginning and end (known as ________) and the people, equipment, and supplies used to complete those activities (known as ________).
2. What is an assignment?
______________________________________________________________________________________________________________________
3. True or False: A connection between a resource and a task is known as a dependency.
4. Where can you go customize the ribbon and the Quick Access Toolbar?
______________________________________________________________________________________________________________________
5–8. Match the keyboard shortcut listed in the left column of the following table to the correct description from the right column by entering the letter that the shortcut corresponds to in the blank line.
5. Press Ctrl+End ____ | A. Return to the first row and column of the task list. |
6. Press Ctrl+Home ____ | B. Shift to the start of the project’s Gantt bars. |
7. Press Alt+End ____ | C. Jump to the last column in the task list. |
8. Press Alt+Home ____ | D. Jump to the end of the project’s Gantt bars. |
9. How do you open the Project Options dialog box? ____________________________________________________________________
10. True or False: In Microsoft Project 2019, you can access help without connecting to Project Server.
11. Fill in the blank: Views in Microsoft Project 2019 can be categorized into three view categories: ________ views, _____ and _____ views, and _______ views.
12. Fill in the blank: The default __________ view includes a calendar bar chart on the right side of the screen and a table of data on the left side.
13. What can you do if you are not seeing the columns you want on the left side of the divider on the (Task or Resource) Usage view?

14–18. Match the view listed in the left column of the following table to the correct usage from the right column by entering the letter that the shortcut corresponds to in the blank line.
14. Gantt Chart ___ | A. If the information you require is task-based, with resource assignments spread over time |
15. Task Usage view ___ | B. If the information you require is resource-based, with task assignments not spread over time |
16. Gantt Chart + details in the lower pane (split window) ___ | C. If the information you require is task-based, without resource assignments |
17. Resource Sheet ___ | D. If the information you require is resource-based, without task assignments |
18. Resource Sheet + details in lower pane (split window) ___ | E. If the information you require is resource-based, with task assignments spread over time |
19. Resource Usage ___ | F. If the information you require is task-based, with resource assignments not spread over time |
20. What can you do if you are not seeing the fields you want on the lower pane?

21. What can you do if you are not seeing the information you want on the left side of the divider of the Gantt Chart view?

22. Fill in the blank: To view resource-based information without assignment details, go to Task:View and select the ________ ________ view.
23. How can you view resource-based information with resource assignments summarized over the project lifetime?

24. How do you view assignment information sorted by resource, rather than by task?
______________________________________________________________________________________________________________________
25. How can you insert a new data field to a view?

26. True or False: When you are working in an enterprise environment using Microsoft Project Professional, changes made to tables and views will apply to the modified project only.
27. What are some advantages of the timeline view?
______________________________________________________________________________________________________________________
28. How can you see the total resource cost for a project?
______________________________________________________________________________________________________________________