
Chapter 10
UX Goals, Metrics, and Targets
Objectives
After reading this chapter, you will:
1. Understand the concepts of UX goals, metrics, and targets
2. Appreciate the need for setting UX target values for the envisioned system
3. Understand the influence of user classes, business goals, and UX goals on UX targets
4. Be able to create UX target tables, including identifying measuring instruments and setting target values
10.1 Introduction
10.1.1 You Are Here
We are making splendid progress in moving through the Wheel UX lifecycle template. In this chapter we establish operational targets for user experience to assess the level of success in your designs so that you know when you can move on to the next iteration. UX goals, metrics, and targets help you plan for evaluation that will successfully reveal the user performance and emotional satisfaction bottlenecks. Because UX goals, metrics, and targets are used to guide much of the process from analysis through evaluation, we show it as an arc around the entire lifecycle template, as you can see in Figure 10-1.
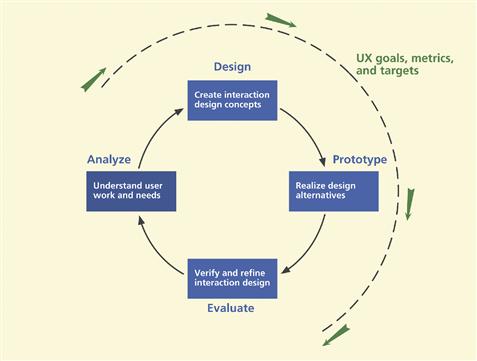
Figure 10-1 You are here; the chapter on UX goals, metrics, and targets in the context of the overall Wheel lifecycle template.
10.1.2 Project Context for UX Metrics and Targets
In early stages, evaluation usually focuses on qualitative data for finding UX problems. In these early evaluations the absence of quantitative data precludes the use of UX metrics and targets. But you may still want to establish them at this point if you intend to use them in later evaluations.
However, there is another need why you might forego UX metrics and targets. In most practical contexts, specifying UX metrics and targets and following up with them may be too expensive. This level of completeness is only possible in a few organizations where there are established UX resources. In most places, one round of evaluation is all one gets. Also, as designers, we can know which parts of the design need further investigation just by looking at the results of the first round of evaluation. In such cases, quantitative UX metrics and targets may not be useful but benchmark tasks are still essential as vehicles for driving evaluation.
Benchmark Task
A benchmark task is a description of a task performed by a participant in formative evaluation so that UX measures such as time-on-task and error rates can be obtained and compared to a baseline value across the performances of multiple participants.
Regardless, the trend in the UX field is moving away from a focus on user performance and more toward user satisfaction and enjoyment. We include the full treatment of UX goals, metrics, and targets here and quantitative data collection and analysis in the later UX evaluation chapters for completeness and because some readers and practitioners still want coverage of the topic.
In any case, we find that this pivotal interaction design process activity of specifying UX goals, metrics, and targets is often overlooked, either because of lack of knowledge or because of lack of time. Sometimes this can be unfortunate because it can diminish the potential of what can be accomplished with the resources you will be putting into user experience evaluation. This chapter will help you avoid that pitfall by showing you techniques for specifying UX goals, metrics, and targets.
Fortunately, creating UX metrics and targets, after a little practice, does not take much time. You will then have specific quantified UX goals against which to test rather than just waiting to see what happens when you put users in front of your interaction design. Because UX metrics and targets provide feasible objectives for formative evaluation efforts, the results can help you pinpoint where to focus on redesign most profitably.
And, finally, UX goals, metrics, and targets offer a way to help manage the lifecycle by defining a quantifiable end to what can otherwise seem like endless iteration. Of course, designers and managers can run out of time, money, and patience before they meet their UX targets—sometimes after just one round of evaluation—but at least then they know where things stand.
10.1.3 Roots for UX Metrics and Targets
The concept of formal UX measurement specifications in tabular form, with various metrics operationally defining success, was originally developed by Gilb (1987). The focus of Gilb’s work was on using measurements in managing software development resources. Bennett (1984) adapted this approach to usability specifications as a technique for setting planned usability levels and managing the process to meet those levels.
These ideas were integrated into usability engineering practice by Good et al. (1986) and further refined by Whiteside, Bennett, and Holtzblatt (1988). Usability engineering, as defined by Good et al. (1986), is a process through which quantitative usability characteristics are specified early and measured throughout the lifecycle process.
Carroll and Rosson (1985) also stressed the need for quantifiable usability specifications, associated with appropriate benchmark tasks, in iterative refinement of user interaction designs. And now we have extended the concept to UX targets. Without measurable targets, it is difficult to determine, at least quantitatively, whether the interaction design for a system or product is meeting your UX goals.
10.2 UX goals
UX goals are high-level objectives for an interaction design, stated in terms of anticipated user experience. UX goals can be driven by business goals and reflect real use of a product and identify what is important to an organization, its customers, and its users. They are expressed as desired effects to be experienced in usage by users of features in the design and they translate into a set of UX measures. A UX measure is a usage attribute to be assessed in evaluating a UX goal.
You will extract your UX goals from user concerns captured in work activity notes, the flow model, social models, and work objectives, some of which will be market driven, reflecting competitive imperatives for the product. User experience goals can be stated for all users in general or in terms of a specific work role or user class or for specific kinds of tasks.
Examples of user experience goals include ease-of-use, power performance for experts, avoiding errors for intermittent users, safety for life-critical systems, high customer satisfaction, walk-up-and-use learnability for new users, and so on.
Example: User Experience Goals for Ticket Kiosk System
We can define the primary high-level UX goals for the ticket buyer to include:
![]() Fast and easy walk-up-and-use user experience, with absolutely no user training
Fast and easy walk-up-and-use user experience, with absolutely no user training
![]() Fast learning so new user performance (after limited experience) is on par with that of an experienced user [from AB-4-8]
Fast learning so new user performance (after limited experience) is on par with that of an experienced user [from AB-4-8]
![]() High customer satisfaction leading to high rate of repeat customers [from BC-6-16]
High customer satisfaction leading to high rate of repeat customers [from BC-6-16]
![]() High learnability for more advanced tasks [from BB-1-5]
High learnability for more advanced tasks [from BB-1-5]
![]() Low error rate for completing transactions correctly, especially in the interaction for payment [from CG-13-17]
Low error rate for completing transactions correctly, especially in the interaction for payment [from CG-13-17]
Exercise
See Exercise 10-1, Identifying User Experience Goals for Your System
10.3 UX target tables
Through years of working with real-world UX practitioners and doing our own user experience evaluations, we have refined the concept of a UX target table, in the form shown in Table 10-1, from the original conception of a usability specification table, as presented by Whiteside, Bennett, and Holtzblatt (1988). A spreadsheet is an obvious way to implement these tables.
Table 10-1 Our UX target table, as evolved from the Whiteside, Bennett, and Holtzblatt (1988) usability specification table

For convenience, one row in the table is called a “UX target.” The first three columns are for the work role and related user class to which this UX target applies, the associated UX goal, and the UX measure. The three go together because each UX measure is aimed at supporting a UX goal and is specified with respect to a work role and user class combination. Next, we will see where you get the information for these three columns.
As a running example to illustrate the use of each column in the UX target table, we will progressively set some UX targets for the Ticket Kiosk System.
10.4 Work roles, user classes, and ux goals
Because UX targets are aimed at specific work roles, we label each UX target by work role. Recall that different work roles in the user models perform different task sets.
So the key task sets for a given work role will have associated usage scenarios, which will inform benchmark task descriptions we create as measuring instruments to go with UX targets. Within a given work role, different user classes will generally be expected to perform to different standards, that is, at different target levels.
Measuring Instrument
A measuring instrument is the means for providing values for a particular UX measure; it is the vehicle through which values are generated and measured. A typical measuring instrument for generating objective UX data is a benchmark task—for example, user performance of a task gives time and error data—while a typical measuring instrument for generating subjective UX data is a questionnaire.
Example: A Work Role, User Class, and UX Goal for the Ticket Kiosk System
In Table 10-1, we see that the first values to enter for a UX target are work role, a corresponding user class, and related UX goal. As we saw earlier, user class definitions can be based on, among other things, level of expertise, disabilities and limitations, and other demographics.
For the Ticket Kiosk System, we are focusing primarily on the ticket buyer. For this work role, user classes include a casual town resident user from Middleburg and a student user from the Middleburg University. In this example, we feature the casual town user.
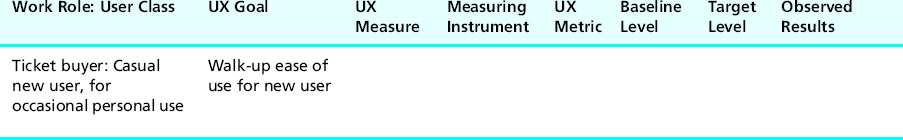
Translating the goal of “fast-and-easy walk-up-and-use user experience” into a UX target table entry is straightforward. This goal refers to the ability of a typical occasional user to do at least the basic tasks on the first try, certainly without training or manuals. Typing them in, we see the beginnings of a UX target in the first row of Table 10-2.
Table 10-2 Choosing a work role, user class, and UX goal for a UX target
10.5 UX measures
Within a UX target, the UX measure is the general user experience characteristic to be measured with respect to usage of your interaction design. The choice of UX measure implies something about which types of measuring instruments and UX metrics are appropriate.
UX targets are based on quantitative data—both objective data, such as observable user performance, and subjective data, such as user opinion and satisfaction.
Some common UX measures that can be paired with quantitative metrics include:
![]() Objective UX measures (directly measurable by evaluators)
Objective UX measures (directly measurable by evaluators)
![]() Long-term performance (longitudinal, experienced, steady state)
Long-term performance (longitudinal, experienced, steady state)
![]() Subjective UX measures (based on user opinions)
Subjective UX measures (based on user opinions)
Initial performance refers to a user’s performance during the very first use (somewhere between the first few minutes and the first few hours, depending on the complexity of the system). Long-term performance typically refers to performance during more constant use over a longer period of time (fairly regular use over several weeks, perhaps). Long-term usage usually implies a steady-state learning plateau by the user; the user has become familiar with the system and is no longer constantly in a learning state.
Initial performance is a key UX measure because any user of a system must, at some point, use it for the first time. Learnability and retainability refer, respectively, to how quickly and easily users can learn to use a system and how well they retain what they have learned over some period of time.
Advanced feature usage is a UX measure that helps determine user experience of more complicated functions of a system. The user’s initial opinion of the system can be captured by a first impression UX measure, whereas long-term user satisfaction refers, as the term implies, to the user’s opinion after using the system for some greater period of time, after some allowance for learning.
Initial performance and first impression are appropriate UX measures for virtually every interaction design. Other UX measures often play support roles to address more specialized UX needs. Conflicts among UX measures are not unheard of. For example, you may need both good learnability and good expert performance. In the design, those requirements can work against each other. This, however, just reflects a normal kind of design trade-off. UX targets based on the two different UX measures imply user performance requirements pulling in two different directions, forcing the designers to stretch the design and face the trade-off honestly.
Example: UX Measures for the Ticket Kiosk System
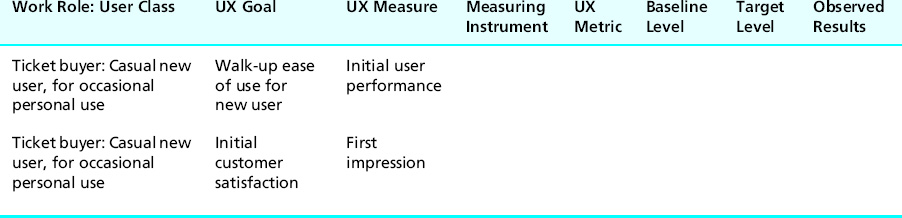
For the walk-up ease-of-use goal of our casual new user, let us start simply with just two UX measures: initial performance and first impression. Each UX measure will appear in a separate UX target in the UX target table, with the user class of the work role and UX goal repeated, as in Table 10-3.
Table 10-3 Choosing initial performance and first impression as UX measures
10.6 Measuring instruments
Within a UX target, the measuring instrument is a description of the method for providing values for the particular UX measure. The measuring instrument is how data are generated; it is the vehicle through which values are measured for the UX measure.
Although you can get creative in choosing your measuring instruments, objective measures are commonly associated with a benchmark task—for example, a time-on-task measure as timed on a stopwatch, or an error rate measure made by counting user errors—and subjective measures are commonly associated with a user questionnaire—for example, the average user rating-scale scores for a specific set of questions.
For example, we will see that the objective “initial user performance” UX measure in the UX target table for the Ticket Kiosk System is associated with a benchmark task and the “first impression” UX measure is associated with a questionnaire. Both subjective and objective measures and data can be important for establishing and evaluating user experience coming from a design.
10.6.1 Benchmark Tasks
According to Reference.com, the term “benchmark” originates in surveying, referring to:
Chiseled horizontal marks that surveyors made in stone structures, into which an angle-iron could be placed to form a “bench” for a leveling rod, thus ensuring that a leveling rod could be accurately repositioned in the same place in future. These marks were usually indicated with a chiseled arrow below the horizontal line.
As a measuring instrument for an objective UX measure, a benchmark task is a representative task that you will have user participants perform in evaluation where you can observe their performance and behavior and take qualitative data (on observations of critical incidents and user experience problems) and quantitative data (user performance data to compare with UX targets). As such, a benchmark task is a “standardized” task that can be used to compare (as an engineering comparison, not a rigorous scientific comparison) performance among different users and across different design versions.
Address designer questions with benchmark tasks and UX targets
As designers work on interaction designs, questions arise constantly. Sometimes the design team simply cannot decide an issue for themselves and they defer it to UX testing (“let the users decide”). Perhaps the team does not agree on a way to treat one design feature, but they have to pick something in order to move forward.
Maybe you do agree on the design for a feature but you are very curious about how it will play out with real users. Perchance you do not believe an input you got in your requirements from contextual analysis but you used it, anyway, and now you want to see if it pans out in the design.
We have suggested that you keep a list of design questions as they came up in design activities. Now they play a role in setting benchmark tasks to get feedback from users regarding these questions. Benchmark tasks based on designer issues are often the only way this kind of issue will get considered in evaluation.
Selecting benchmark tasks
In general, of course, the benchmark tasks you choose as measuring instruments should closely represent tasks real users will perform in a real work context. Pick tasks where you think or know the design has weaknesses. Avoiding such tasks violates the spirit of UX targets and user experience evaluation; it is about finding user experience problems so that you can fix them, not about proving you are the best designer. If you think of UX targets as a measure of how good you are as a designer, you will have a conflict of interest because you are setting your own evaluation criteria. That is not the point of UX targets at all.
Here are some guidelines for creating effective benchmark tasks.
Create benchmark tasks for a representative spectrum of user tasks
Choose realistic tasks intended to be used by each user class of a work role across the system. To get the best coverage for your evaluation investment, your choices should represent the cross section of real tasks with respect to frequency of performance and criticality to goals of the users of the envisioned product. Benchmark tasks are also selected to evaluate new features, “edge cases” (usage at extreme conditions), and business-critical and mission-critical tasks. While some of these tasks may not be performed frequently, getting them wrong could cause serious consequences.
Start with short and easy tasks and then increase difficulty progressively
Because your benchmark tasks will be faced by participant users in a sequence, you should consider their presentation order. In most cases, start with relatively easy ones to get users accustomed to the design and feeling comfortable in their role as evaluators. After building user confidence and engagement, especially with the tasks for the “initial performance” UX measure, you can introduce more features, more breadth, variety, complexity, and higher levels of difficulty.
In some cases, you might have your user participants repeat a benchmark task, only using a different task path, to see how users get around in multiple ways. The more advanced benchmark tasks are also a place to try your creativity by introducing intervening circumstances. For example, you might lead the user down a path and then say “At this point, you change your mind and want to do such and such, departing from where you are now.”
For our ticket kiosk system, maybe start with finding a movie that is currently playing. Then follow with searching for and reserving tickets for a movie that is to be showing 20 days from now and then go to more complex tasks such as purchasing concert tickets with seat and ticket type selection.
Include some navigation where appropriate
In real usage, because users usually have to navigate to get to where they will do the operations specific to performing a task, you want to include the need for this navigation even in your earliest benchmark tasks. It tests their knowledge of the fact that they do need to go elsewhere, where they need to go, and how to get there.
Avoid large amounts of typing (unless typing skill is being evaluated)
Avoid anything in your benchmark task descriptions that causes large user performance variation not related to user experience in the design. For example, large amounts of typing within a benchmark task can cause large variations in user performance, but the variations will be based on differences in typing skills and can obscure performance differences due to user experience or usability issues.
Match the benchmark task to the UX measure
Obviously, if the UX measure is “initial user performance,” the task should be among those a first-time user realistically would face. If the UX measure is about advanced feature usage, then, of course, the task should involve use of that feature to match this requirement. If the UX measure is “long-term usage,” then the benchmark task should be faced by the user after considerable practice with the system. For a UX measure of “learnability,” a set of benchmark tasks of increasing complexity might be appropriate.
Adapt scenarios already developed for design
Design scenarios clearly represent important tasks to evaluate because they have already been selected as key tasks in the design. However, you must remember to remove information about how to perform the tasks, which is usually abundant in a scenario. See guideline “Tell the user what task to do, but not how to do it” in the next section for more discussion.
Use tasks in realistic combinations to evaluate task flow
To measure user performance related to task flow, use combinations of tasks such as those that will occur together frequently. In these cases, you should set UX targets for such combinations because difficulties related to user experience that appear during performance of the combined tasks can be different than for the same tasks performed separately. For example, in the Ticket Kiosk System, you may wish to measure user performance on the task thread of searching for an event and then buying tickets for that event.
As another example, a benchmark task might require users to buy four tickets for a concert under a total of $200 while showing tickets in this price range for the upcoming few days as sold out. This would force users to perform the task of searching through other future concert days, looking for the first available day with tickets in this price range.
Do not forget to evaluate with your power users
Often user experience for power users is addressed inadequately in product testing (Karn, Perry, & Krolczyk, 1997). Do your product business and UX goals include power use by a trained user population? Do they require support for rapid repetition of tasks, complex and possibly very long tasks? Does their need for productivity demand shortcuts and direct commands over interactive hand-holding?
If any of these are true, you must include benchmark tasks that match this kind of skilled and demanding power use. And, of course, these benchmark tasks must be used as the measuring instrument in UX targets that match up with the corresponding user classes and UX goals.
To evaluate error recovery, a benchmark task can begin in an error state
Effective error recovery is a kind of “feature” that designers and evaluators can easily forget to include. Yet no interaction design can guarantee error-free usage, and trying to recover from errors is something most users are familiar with and can relate to. A “forgiving” design will allow users to recover from errors relatively effortlessly. This ability is definitely an aspect of your design that should be evaluated by one or more benchmark tasks.
Consider tasks to evaluate performance in “degraded modes” due to partial equipment failure
In large interconnected, networked systems such as military systems or large commercial banking systems, especially involving multiple kinds of hardware, subsystems can go down. When this happens, will your part of the system give up and die or can it at least continue some of its intended functionality and give partial service in a “degraded mode?” If your application fits this description, you should include benchmark tasks to evaluate the user’s perspective of this ability accordingly.
Do not try to make a benchmark task for everything
Evaluation driven by UX targets is only an engineering sampling process. It will not be possible to establish UX targets for all possible classes of users doing all possible tasks. It is often stated that about 20% of the tasks in an interactive system account for 80% of the usage and vice versa. While these figures are obviously folkloric guesses, they carry a grain of truth to guide in targeting users and tasks in establishing UX targets.
Constructing benchmark task content
Here we list a number of tips and hints to consider when creating benchmark task content.
Remove any ambiguities with clear, precise, specific, and repeatable instructions
Unless resolving ambiguity is what we want users to do as part of the task, we must make the instructions in benchmark task descriptions clear and not confusing. Unambiguous benchmark tasks are necessary for consistent results; we want differences in user performance to be due to differences in users or differences in designs but usually not due to different interpretations of the same benchmark task.
As a subtle example, consider this “add appointment” benchmark task for the “initial performance” UX measure for an interdepartmental event scheduling system. Schedule a meeting with Dr. Ehrich for a month from today at 10 AM in 133 McBryde Hall concerning the HCI research project.
For some users, the phrase “1 month from today” can be ambiguous. Why? It can mean, for example, on the same date next month or it can mean exactly 4 weeks from now, putting it on the same day of the week. If that difference in meaning can make a difference in user task performance, you need to make the wording more specific to the intended meaning.
You also want to make your benchmark tasks specific so that participants do not get sidetracked on irrelevant details during testing. If, for example, a “find event” benchmark task is stated simply as “Find an entertainment event for sometime next week,” some participants might make it a long, elaborate task, searching around for some “best” combination of event type and date, whereas others would do the minimum and take the first event they see on the screen. To mitigate such differences, add specific information about event selection criteria.
Tell the user what task to do, but not how to do it
This guideline is very important; the success of user experience evaluation based on this task will depend on it. Sometimes we find students in early evaluation exercises presenting users with task instructions that spell out a series of steps to perform. They should not be surprised when the evaluation session leads to uninteresting results.
The users are just giving a rote performance of the steps as they read them from the benchmark task description. If you wish to test whether your interaction design helps users discover how to do a given task on their own, you must avoid giving any information about how to do it. Just tell them what task to do and let them figure out how.
Example (to do): “Buy two student tickets for available adjacent seats as close to the stage as possible for the upcoming Ben King concert and pay with a credit card.”
Example (not to do): “Click on the Special Events button on the home screen; then select More at the bottom of the screen. Select the Ben King concert and click on Seating Options….”
Example (not to do): “Starting at the Main Menu, go to the Music Menu and set it as a Bookmark. Then go back to the Main Menu and use the Bookmark feature to jump back to the Music Menu.”
Do not use words in benchmark tasks that appear specifically in the interaction design
In your benchmark task descriptions, you must avoid using any words that appear in menu headings, menu choices, button labels, icon pop-ups, or any place in the interaction design itself. For example, do not say “Find the first event (that has such and such a characteristic)” when there is a button in the interaction design labeled “Find.” Instead, you should use words such as “Look for …” or “Locate …”
Otherwise it is very convenient for your users to use a button labeled “Find” when they are told to “Find” something. It does not require them to think and, therefore, does not evaluate whether the design would have helped them find the right button on their own in the course of real usage.
Use work context and usage-centered wording, not system-oriented wording
Because benchmark task descriptions are, in fact, descriptions of user tasks and not system functionality, you should use usage-centered words from the user’s work context and not system-centered wording. For example, “Find information about xyz” is better than “Submit query about xyz.” The former is task oriented; the latter is more about a system view of the task.
Have clear start and end points for timing
In your own mind, be sure that you have clearly observable and distinguishable start and end points for each benchmark task and make sure you word the benchmark task description to use these end points effectively. These will ensure your ability to measure the time on task accurately, for example.
At evaluation time, not only must the evaluators know for sure when the task is completed, but the participant must know when the task is completed. For purposes of evaluation, the task cannot be considered completed until the user experiences closure.
The evaluator must also know when the user knows that the task has been completed. Do not depend on the user to say when the task is done, even if you explicitly ask for that in the benchmark task description or user instructions. Therefore, rather than ending task performance with a mental or sensory state (i.e., the user knowing or seeing something), it is better to incorporate a user action confirming the end of the task, as in the (to do) examples that follow.
Example (not to do): “Find out how to set the orientation of the printer paper to “landscape.” Completion of this task depends on the user knowing something and that is not a directly observable state. Instead, you could have the user actually set the paper orientation; this is something you can observe directly.
Example (not to do): “View next week’s events.” Completion of this task depends on the user seeing something, an action that you may not be able to confirm. Perhaps you could have the user view and read aloud the contents of the first music event next week. Then you know whether and when the user has seen the correct event.
Example (to do): “Find next week’s music event featuring Rachel Snow and add it to the shopping cart.”
Example (to do): Or, to include knowing or learning how to select seats, “Find the closest available seat to the stage and add to shopping cart.”
Example (to do): “Find the local weather forecast for tomorrow and read it aloud.”
Keep some mystery in it for the user
Do not always be too specific about what the users will see or the parameters they will encounter. Remember that real first-time users will approach your application without necessarily knowing how it works. Sometimes try to use benchmark tasks that give approximate values for some parameters to look for, letting the rest be up to the user. You can still create a prototype in such a way that there is only one possible “solution” to this task if you want to avoid different users in the evaluation ending in a different state in the system.
Annotate situations where evaluators must ensure pre-conditions for running benchmark tasks
Suppose you write this benchmark task: “Your dog, Mutt, has just eaten your favorite book and you have decided that he is not worth spending money on. Delete your appointment with the vet for Mutt’s annual checkup from your calendar.”
Every time a user performs this task during evaluation, the evaluator must be sure to have an existing appointment already in your prototype calendar so that each user can find it and delete it. You must attach a note in the form of rubrics (next point later) to this benchmark task to that effect—a note that will be read and followed much later, in the evaluation activity.
Use “rubrics” for special instructions to evaluators
When necessary or useful, add a “rubrics” section to your benchmark task descriptions as special instructions to evaluators, not to be given to participants in evaluation sessions. Use these rubrics to communicate a heads-up about anything that needs to be done or set up in advance to establish task preconditions, such as an existing event in the kiosk system, work context for ecological validity, or a particular starting state for a task.
Ecological Validity
Ecological validity refers to the realism with which a design of evaluation setup matches the user’s real work context. It is about how accurately the design or evaluation reflects the relevant characteristics of the ecology of interaction, i.e., its context in the world or its environment.
Benchmark tasks for addressing designer questions are especially good candidates for rubrics. In a note accompanying your benchmark task you can alert evaluators to watch for user performance or behavior that might shed light on these specific designer questions.
Put each benchmark task on a separate sheet of paper
Yes, we want to save trees but, in this case, it is necessary to present the benchmark tasks to the participant only one at a time. Otherwise, the participant will surely read ahead, if only out of curiosity, and can become distracted from the task at hand.
If a task has a surprise step, such as a midtask change of intention, that step should be on a separate piece of paper, not shown to the participant initially. To save trees you can cut (with scissors) a list of benchmark tasks so that only one task appears on one piece of paper.
Write a “task script” for each benchmark task
You should write a “task script” describing the steps of a representative or typical way to do the task and include it in the benchmark task document “package.” This is just for use by the evaluator and is definitely not given to the participant. The evaluator may not have been a member of the design team and initially may not be too familiar with how to perform the benchmark tasks, and it helps the evaluator to be able to anticipate a possible task performance path. This is especially useful in cases where the participant cannot determine a way to do the task; then, the evaluation facilitator knows at least one way.
Example: Benchmark Tasks as Measuring Instruments for the Ticket Kiosk System
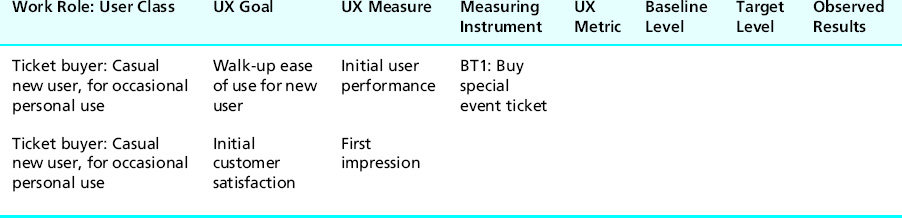
For the Ticket Kiosk System, the first UX target in Table 10-3 contains an objective UX measure for “Initial user performance.” An obvious choice for the corresponding measuring instrument is a benchmark task. Here we need a simple and frequently used task that can be done in a short time by a casual new user in a walk-up ease-of-use situation. An appropriate benchmark task would involve buying tickets to an event. Here is a possible description to give the user participant:
“BT1: Go to the Ticket Kiosk System and buy three tickets for the Monster Truck Pull on February 28 at 7:00 PM. Get three seats together as close to the front as possible. Pay with a major credit card.”
In Table 10-4 we add this to the table as the measuring instrument for the first UX target.
Table 10-4 Choosing “buy special event ticket” benchmark task as measuring instrument for “initial performance” UX measure in first UX target
Let us say we want to add another UX target for the “initial performance” UX measure, but this time we want to add some variety and use a different benchmark task as the measuring instrument—namely, the task of buying a movie ticket. In Table 10-5 we have entered this benchmark task in the second UX target, pushing the “first impression” UX target down by one.
Table 10-5 Choosing “buy movie ticket” benchmark task as measuring instrument for second initial performance UX measure

How many benchmark tasks and UX targets do you need?
As in most things regarding human–computer interaction, it depends. The size and complexity of the system should be reflected in the quantity and complexity of the benchmark tasks and UX targets. We cannot even give you an estimate of a typical number of benchmark tasks.
You have to use your engineering judgment and make enough benchmark tasks for reasonable, representative coverage without overburdening the evaluation process. If you are new to this, we can say that we have often seen a dozen UX targets, but 50 would probably be too much—not worth the cost to pursue in evaluation.
How long should your benchmark tasks be (in terms of time to perform)? The typical benchmark task takes a range of a couple of minutes to 10 or 15 minutes. Some short and some long are good. Longer sequences of related tasks are needed to evaluate transitions among tasks. Try to avoid really long benchmark tasks because they may be tiring to participants and evaluators during testing.
Ensure ecological validity
The extent to which your evaluation setup matches the user’s real work context is called ecological validity (Thomas & Kellogg, 1989). One of the valid criticisms of lab-based user experience testing is that a UX lab can be kind of a sterile environment, not a realistic setting for the user and the tasks. But you can take steps to add ecological validity by asking yourself, as you write your benchmark task descriptions, how can the setting be made more realistic?
![]() What are constraints in user or work context?
What are constraints in user or work context?
![]() Does the task involve more than one person or role?
Does the task involve more than one person or role?
![]() Does the task require a telephone or other physical props?
Does the task require a telephone or other physical props?
![]() Does the task involve background noise?
Does the task involve background noise?
![]() Does the task involve interference or interruption?
Does the task involve interference or interruption?
![]() Does the user have to deal with multiple simultaneous inputs, for example, multiple audio feeds through headsets?
Does the user have to deal with multiple simultaneous inputs, for example, multiple audio feeds through headsets?
As an example for a task that might be triggered by a telephone call, instead of writing your benchmark task description on a piece of paper, try calling the participant on a telephone with a request that will trigger the desired task. Rarely do task triggers arrive written on a piece of paper someone hands you. Of course, you will have to translate the usual boring imperative statements of the benchmark task description to a more lively and realistic dialogue: “Hi, I am Fred Ferbergen and I have an appointment with Dr. Strangeglove for a physical exam tomorrow, but I have to be out of town. Can you change my appointment to next week?”
Telephones can be used in other ways, too, to add realism to work context. A second telephone ringing incessantly at the desk next door or someone talking loudly on the phone next door can add realistic task distraction that you would not get from a “pure” lab-based evaluation.
Example: Ecological Validity in Benchmark Tasks for the Ticket Kiosk System
To evaluate use of the Ticket Kiosk System to manage the work activity of ticket buying, you can make good use of physical prototypes and representative locations. By this we mean building a touchscreen display into a cardboard or wooden kiosk structure and place it in the hallway of a relatively busy work area. Users will be subject to the gawking and questions of curiosity seekers. Having co-workers join the kiosk queue will add extra realism.
10.6.2 User Satisfaction Questionnaires
As a measuring instrument for a subjective UX measure, a questionnaire related to various user interaction design features can be used to determine a user’s satisfaction with the interaction design. Measuring a user’s satisfaction provides a subjective, but still quantitative, UX metric for the related UX measure. As an aside, we should point out that objective and subjective measures are not always orthogonal.
As an example of a way they can intertwine, user satisfaction can actually affect user performance over a long period of time. The better users like the system, the more likely they are to experience good performance with it over the long term. In the following examples we use the QUIS questionnaire (description in Chapter 12), but there are other excellent choices, including the System Usability Scale or SUS (description in Chapter 12).
Example: Questionnaire as Measuring Instrument for the Ticket Kiosk System
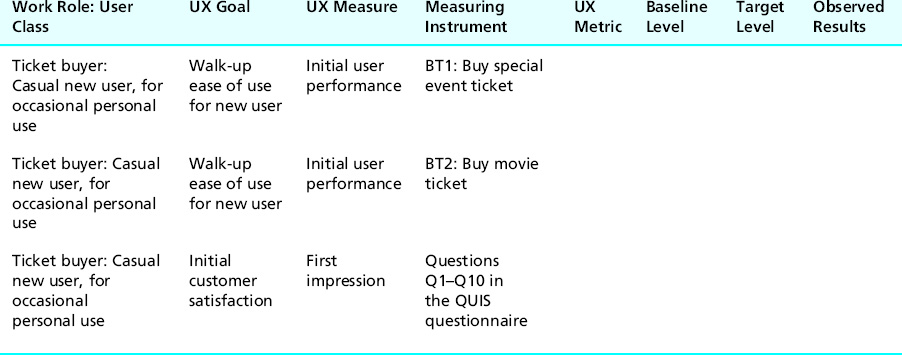
If you think the first two benchmark tasks (buying tickets) make a good foundation for assessing the “first-impression” UX measure, then you can specify that a particular user satisfaction questionnaire or a specific subset thereof be administered following those two initial tasks, stipulating it as the measuring instrument in the third UX target of the growing UX target table, as we have done in Table 10-6.
Table 10-6 Choosing questionnaire as measuring instrument for first-impression UX measure
Example: Goals, Measures, and Measuring Instruments
Before moving on to UX metrics, in Table 10-7 we show some examples of the close connections among UX goals, UX measures, and measuring instruments.
Table 10-7 Close connections among UX goals, UX measures, and measuring instruments
| UX Goal | UX Measure | Potential Metrics |
| Ease of first-time use | Initial performance | Time on task |
| Ease of learning | Learnability | Time on task or error rate, after given amount of use and compared with initial performance |
| High performance for experienced users | Long-term performance | Time and error rates |
| Low error rates | Error-related performance | Error rates |
| Error avoidance in safety critical tasks | Task-specific error performance | Error count, with strict target levels (much more important than time on task) |
| Error recovery performance | Task-specific time performance | Time on recovery portion of the task |
| Overall user satisfaction | User satisfaction | Average score on questionnaire |
| User attraction to product | User opinion of attractiveness | Average score on questionnaire, with questions focused on the effectiveness of the “draw” factor |
| Quality of user experience | User opinion of overall experience | Average score on questionnaire, with questions focused on quality of the overall user experience, including specific points about your product that might be associated most closely with emotional impact factors |
| Overall user satisfaction | User satisfaction | Average score on questionnaire, with questions focusing on willingness to be a repeat customer and to recommend product to others |
| Continuing ability of users to perform without relearning | Retainability | Time on task and error rates re-evaluated after a period of time off (e.g., a week) |
| Avoid having user walk away in dissatisfaction | User satisfaction, especially initial satisfaction | Average score on questionnaire, with questions focusing on initial impressions and satisfaction |
10.7 UX metrics
A UX metric describes the kind of value to be obtained for a UX measure. It states what is being measured. There can be more than one metric for a given measure. As an example from the software engineering world, software complexity is a measure; one metric for the software complexity measure (one way to obtain values for the measure) is “counting lines of code.”
Most commonly, UX metrics are objective, performance-oriented, and taken while the participant is doing a benchmark task. Other UX metrics can be subjective, based on a rating or score computed from questionnaire results. Typical objective UX metrics include time to complete task1 and number of errors made by the user. Others include frequency of help or documentation use; time spent in errors and recovery; number of repetitions of failed commands (what are users trying to tell us by repeating an action that did not work before?); and the number of commands, mouse-clicks, or other user actions to perform task(s).
If you are feeling adventurous you can use a count of the number of times the user expresses frustration or satisfaction (the “aha and cuss count”) during his or her first session as an indicator of his or her initial impression of the interaction design. Of course, because the number of remarks is directly related to the length of the session, plan your levels accordingly or you can set your levels as a count per unit time, such as comments per minute, to factor out the time differences. Admittedly, this measuring instrument is rather participant dependent, depending on how demonstrative a participant feels during a session, whether a participant is generally a complainer, and so on, but this metric can produce some interesting results.
Typically, subjective UX metrics will represent the kind of numeric outcome you want from a questionnaire, usually based on simple arithmetic statistical measures such as the numeric average. Remember that you are going only for an engineering indicator of user experience, not for statistical significance.
Interestingly, user perceptions of elapsed time, captured via a questionnaire or post-session interview, can sometimes be an important UX measure. We know of such a case that occurred during evaluation of a new software installation procedure. The old installation procedure required the user to perform repeated disk (CD-ROM) swaps during installation, while the new installation procedure required only one swap. Although the new procedure took less time, users thought it took them longer because they were not kept busy swapping disks.
And do not overlook a combination of measures for situations where you have performance trade-offs. If you specify your UX metric as some function, such as a sum or an average, of two other performance-related metrics, for example, time on task and error rate, you are saying that you are willing to give up some performance in one area if you get more in the other.
We hope you will explore many other possibilities for UX metrics, extending beyond what we have mentioned here, including:
![]() percentage of task completed in a given time
percentage of task completed in a given time
![]() ratio of successes to failures
ratio of successes to failures
![]() time spent moving cursor (would have to be measured using software instrumentation, but would give information about the efficiency of such physical actions, necessary for some specialized applications)
time spent moving cursor (would have to be measured using software instrumentation, but would give information about the efficiency of such physical actions, necessary for some specialized applications)
![]() for visibility and other issues, fixations on the screen, cognitive load as indicated by correlation to pupil diameter, and so on using eye-tracking
for visibility and other issues, fixations on the screen, cognitive load as indicated by correlation to pupil diameter, and so on using eye-tracking
Finally, be sure you match up your UX measures, measuring instruments, and metrics to make sense in a UX target. For example, if you plan to use a questionnaire in a UX target, do not call the UX measure “initial performance.” A questionnaire does not measure performance; it measures user satisfaction or opinion.
Example: UX Metrics for the Ticket Kiosk System
For the initial performance UX measure in the first UX target of Table 10-6, as already discussed in the previous section, the length of time to buy a special event ticket is an appropriate value to measure. We specify this by adding “time on task” as the metric in the first UX target of Table 10-8.
Table 10-8 Choosing UX metrics for UX measures
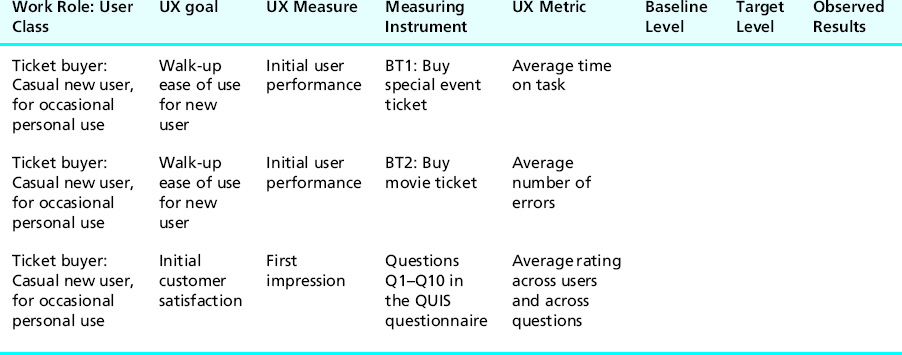
As a different objective performance measure, you might measure the number of errors a user makes while buying a movie ticket. This was chosen as the value to measure in the second UX target of Table 10-8. You will often want to measure both of these metrics during a participant’s single performance of the same single task. A participant does not, for example, need to perform one “buy ticket” task while you time performance and then do a different (or repeat the same) “buy ticket” task while you count errors.
Finally, for the UX metric in the third UX target of Table 10-8, the subjective UX target for the first impression UX measure, let us use the simple average of the numeric ratings given across all users and across all the questions for which ratings were given (i.e., Q1 to Q10).
10.8 Baseline level
The baseline level is the benchmark level of the UX metric; it is the “talking point” level against which other levels are compared. It is often the level that has been measured for the current version of the system (automated or manual). For example, the Ticket Kiosk System might be replacing the ticket counter in the ticket office.
The baseline level for time on task can be an average of measured times to do the task in person over the ticket counter. That might be quite different from what you expect users will be able to achieve using our new system, but it is a stake in the sand, something for comparison. Measuring a baseline level helps ensure that the UX metric is, in fact, measurable.
10.9 Target level
A UX target is a quantitative statement of an aimed-at or hoped-for value for a UX metric. Thus, a UX target is an operationally defined criterion for success of user experience stemming from an interaction design, an engineering judgment about the quality of user experience expected from an interactive system.
The target level for a UX metric is the value indicating attainment of user experience success. It is a quantification of the UX goal for each specific UX measure and UX metric. UX metrics for which you have not yet achieved the target levels in evaluation serve as focal points for improvement by designers.
Just barely meeting a target level is the minimum performance acceptable for any UX measure; it technically meets the UX goals—but only barely. In theory, you hope to achieve better than the target level on most UX measures; in reality, you are usually happy to pass regardless of by how much.
Because “passing” the user experience test means meeting all your target levels simultaneously, you have to ensure that the target levels for all UX measures in the entire table must be, in fact, simultaneously attainable. That is, do not build in trade-offs of the kind where meeting one target level goal might make it much more difficult to meet another related target level.
So how do you come up with reasonable values for your target levels? As a general rule of thumb, a target level is usually set to be an improvement over the corresponding baseline level. Why build a new system if it is not going to be better? Of course, improved user performance is not the only motivation for building a new system; increased functionality or just meeting user needs at a higher level in the design can also be motivating factors. However, the focus here is on improving user experience, which often means improved user performance and satisfaction.
For initial performance measures, you should set target levels that allow enough time, for example, for unfamiliar users to read menus and labels, think a bit, and look around each screen to get their bearings. So do not use levels for initial performance measures that assume users are familiar with the design.
10.10 Setting levels
The baseline level and target level in the UX target table are key to quantifying user experience metrics. But sometimes setting baseline and target levels can be a challenge. The answer requires determining what level of user performance and user experience the system is to support.
Obviously, level values are often “best guesses” but with practice UX people become quite skilled at establishing reasonable and credible target levels and setting reasonable values. This is not an exact science; it is an engineering endeavor and you get better at it with experience.
Among the yardsticks you can use to set both baseline and target levels are:
![]() an existing system or previous version of the new system being designed
an existing system or previous version of the new system being designed
![]() competing systems, such as those with a large market share or with a widely acclaimed user experience
competing systems, such as those with a large market share or with a widely acclaimed user experience
What if there are no existing or competing systems? Be creative and use your problem-solving skills. Look at manual ways of doing things and adjust for automation. For example, if there were no calendar systems, use a paper calendar. Start with some good educated engineering estimates and improve with experience from there.
Although it may not always be explicitly indicated in a UX target table, the baseline and target levels shown are the mean over all participants of the corresponding measure. That is, the levels shown do not have to be achieved by every participant in the formative evaluation sessions. So, for example, if we specify a target level of four errors for benchmark task BT 2 in the second UX target of Table 10-8 as a worst acceptable level of performance, there must be no more than an average of four errors, as averaged across all participants who perform the “buy movie ticket” task.
Example: Baseline Level Values for the Ticket Kiosk System
To determine the values for the first two UX target baseline levels for the Ticket Kiosk System, we can have someone perform the benchmark tasks for buying a ticket for a special event and a movie using MUTTS. Suppose that buying a ticket for a special event takes about 3 minutes. If so, this value, 3 minutes, makes a plausible baseline level for the first UX target in Table 10-9. Because most people are already experienced with ticket offices, this value is not really for initial performance, but it gives some idea for that value.
Table 10-9 Setting baseline levels for UX measures
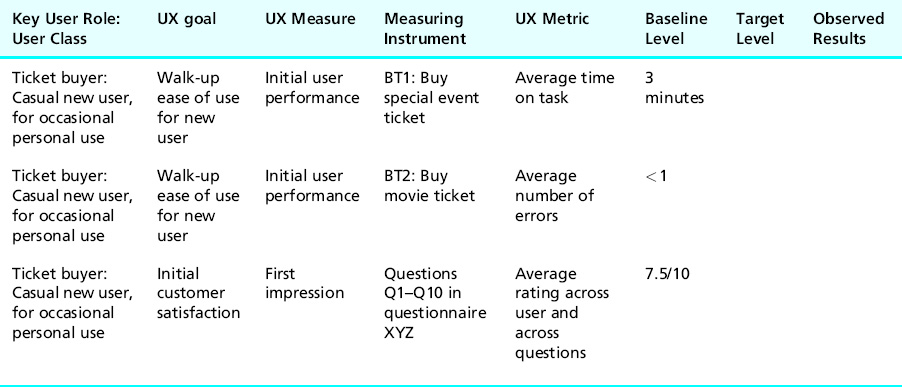
To set a baseline value for the second UX target, for buying a movie ticket, it can be assumed that almost no one should make any errors doing this at a ticket counter, so let us set the baseline level as less than 1, as in Table 10-9.
To establish a baseline value for the first impression UX measure in the third UX target, we could administer the questionnaire to some users of MUTTS. Let us say we have done that and got an average score of a 7.5 out of 10 for the first impression UX measure (a value we put in Table 10-9).
Example: Target Level Values for the Ticket Kiosk System
In Table 10-10, for the first initial performance UX measure, let us set the target level to 2.5 minutes. In the absence of anything else to go on, this is a reasonable choice with respect to our baseline level of 3 minutes. We enter this value into the “Target level” column for the first UX target of the UX target table in Table 10-10.
Table 10-10 Setting target levels for UX metrics
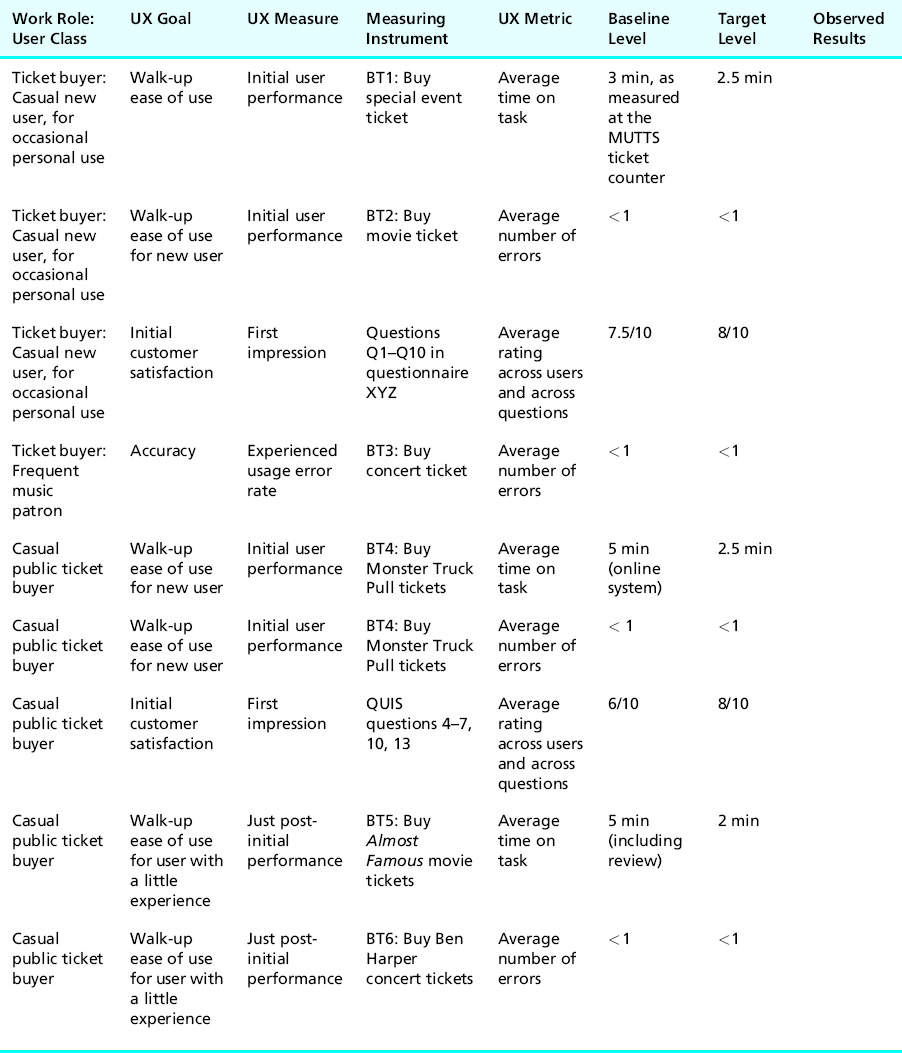
With a baseline level of less than one error for the “Buy movie ticket” task, it would again be tempting to set the target level at zero, but that does not allow for anyone ever to commit an error. So let us retain the existing level, < 1, as the target level for error rates, as entered into the second UX target of Table 10-10.
For the first impression UX measure, let us be somewhat conservative and set a target level of a mean score of 8 out of 10 on the questionnaire. Surely 80% is passing in most anyone’s book or course. This goes in the third UX target of Table 10-10.
Just for illustration purposes, we have added a few additional UX targets to Table 10-10. The UX target in the fourth row is for a regular music patron’s task of buying a concert ticket using a frequent-customer discount coupon. The UX measure for this one is to measure experienced usage error rates using the “Buy concert ticket” benchmark task, with a target level of 0.5 (average).
Additional benchmark tasks used in the last two UX targets of the table are:
BT5: You want to buy a ticket for the movie Almost Famous for between 7:00 and 8:00 PM tonight at a theater within a 10-minute walk from the Metro station. First check to be sure this movie is rated PG-13 because you will be with your 15-year-old son. Then go to the reviews for this movie (to show us you can find the reviews, but you do not have to spend time reading them now) and then buy two general admission tickets.
BT6: Buy three tickets to the Ben Harper concert on any of the nights on the weekend of September 29th–October 1st. Get the best seats you can for up to $50 per ticket. Print out the directions for taking the Metro to the concert.
10.11 Observed results
The final column in Table 10-10 is for observed results, a space reserved for recording values measured while observing users performing the prescribed tasks during formative evaluation sessions. As part of the UX target table, this column affords direct comparisons between specified levels and actual results of testing.
Because you typically will have more than one user from which observed results are obtained, you can either record multiple values in a single observed results column or, if desired, add more columns for observed results and use this column for the average of the observed values. If you maintain your UX target tables in spreadsheets, as we recommend, it is easier to manage observed data and results (Chapter 16).
Exercise
See Exercise 10-2, Creating Benchmark Tasks and UX Targets for Your System
10.12 Practical tips and cautions for creating ux targets
Here we present some hints about filling out your UX target table, some of which were adapted from Whiteside, Bennett, and Holtzblatt (1988). These suggestions are not intended to be requirements, but rather to show the range of possibilities.
Are user classes for each work role specified clearly enough?
User class definitions are important in identifying representative users who will serve as participants in evaluation sessions (Chapter 15). As already mentioned, the characteristics of users playing a work role may affect the setting of UX targets, resulting in different measuring instruments and UX metrics for different user classes while performing the same task. If there are several user classes for which different UX targets are appropriate, you will address them with separate and different UX targets in the table.
Have you taken into account potential trade-offs among user groups?
For example, you must consider the trade-offs between learnability for new users and the possibility that “help” for these new users might get in the way of power performance by experienced users.
Are the values for the various levels reasonable?
This may be one of the hardest questions to answer. In fact, the first few times you create UX targets, you will probably be making a lot of guesses. You do get better at it with practice.
Be prepared to adjust your target level values, based on initial observed results
Sometimes in evaluation you observe that users perform dramatically differently than you had expected when you set the levels. These cases can help you refine the target levels in UX targets, too. While it is possible to set the levels too leniently, it is also possible that you make your initial UX targets too demanding, especially in early cycles of iteration.
When your observed results are much worse than specified levels, there typically are two possibilities. In the first (and preferable) case, the process of evaluation and refinement is working just as it should; the UX targets are reasonable, and evaluation has shown that there are serious UX problems with the design. When these problems are solved, the design will meet the specified UX goals.
In the second case, the UX targets have been set for an unrealistically high level of expectation, and no matter how much you improve the design and its user experience, the UX goals might never be met. Sometimes, for example, a task simply takes longer than its designers first anticipated, even with a good design.
If you are not meeting your levels, especially after a few rounds of iteration, you will need to assess them to see whether they are simply too difficult to attain or whether the design just needs a great deal of work. Determining which of these cases you have is, of course, not always easy. You will have to rely on your knowledge of interaction design, experience, intuition, and ultimately your best judgment to decide where the problem lies—with the UX target levels or with the design.
Remember that the target level values are averages
So do not set impossible average goals such as zero errors.
How well do the UX measures capture the UX goals for the design?
Again, this can be elusive. It is entirely possible to establish UX targets that have little or nothing to do with assessing the real user experience of a design. For example, a benchmark task might be very non-representative, leading to design improvements in parts of the application that will rarely be used.
It is equally easy to omit inadvertently UX targets that are critical to assessing user experience. Again, with experience, you will gain a better understanding of when you have established UX measures and levels that capture the user experience of the design.
What if the design is in its early stages and you know the design will change significantly in the next version, anyway?
Will it be a waste of time to create benchmark tasks and UX targets if the system is expected to undergo major changes in the near future? A UX representative of one project team we worked with sent email saying “We spent 2 days evaluating the XXX tool (first version) only to discover that the more recent version was significantly different and many of the issues we identified were no longer valid.”
Our answer: As long as the tasks have not changed significantly, as long as users would still do those same tasks with the new design (even if they are now done in a different way), your work in creating benchmark tasks and UX targets should not have been wasted. Benchmark tasks and level settings are supposed to be independent of the design details.
What about UX goals, metrics, and targets for usefulness and emotional impact?
Quantitative measures and metrics for UX goals about usefulness and emotional impact, including phenomenological aspects and social or cultural impact, and value-sensitive design are more limited. The principal measuring instrument for these measures is the questionnaire and, possibly, post-session interviews.
And, of course, there are experimental data collection techniques for detecting and/or measuring emotional responses (Chapter 12). You can use the number of smiles per interaction as a UX metric if you can detect, and therefore, count, smiles. Phenomenological aspects require longer term measures (also in Chapter 12).
Questionnaires and interviews can also be used to assess branding issues. For example, you can ask if the user thinks this product is “on-brand” or you can show two variations and ask which is better associated with the brand and why. Although this kind of data collection leans more toward qualitative, you can find ways to quantify it, if desired.
10.13 How UX targets help manage the user experience engineering process
First of all, the end of evaluation activity in each iteration of the lifecycle is a good time to evaluate your benchmark task descriptions and UX targets. How well did they work for you? If you think they should be improved, do it now.
Also, after each iteration of evaluation, we have to decide whether to continue iterating. But we cannot keep iterating forever. So how do we know when to stop? We tell how the project manager can use the evaluation results in conjunction with UX targets to decide when to stop iterating in Chapter 16.
10.14 An abridged approach to UX goals, metrics, and targets
As in most of the other process chapters, the process here can be abridged, trading completeness for speed and lower cost. Possible steps of increasing abridgement include:
![]() Eliminate objective UX measures and metrics, but retain UX goals and quantitative subjective measures. Metrics obtained with questionnaires are easier and far less costly than metrics requiring empirical testing, lab based or in the field.
Eliminate objective UX measures and metrics, but retain UX goals and quantitative subjective measures. Metrics obtained with questionnaires are easier and far less costly than metrics requiring empirical testing, lab based or in the field.
![]() Eliminate all UX measures and metrics and UX target tables. Retain benchmark tasks as a basis for user task performance and behavior to observe in limited empirical testing for gathering qualitative data (UX problem data).
Eliminate all UX measures and metrics and UX target tables. Retain benchmark tasks as a basis for user task performance and behavior to observe in limited empirical testing for gathering qualitative data (UX problem data).
![]() Ignore UX goals, metrics, and targets altogether and use only rapid evaluation methods later, producing only qualitative data.
Ignore UX goals, metrics, and targets altogether and use only rapid evaluation methods later, producing only qualitative data.
1 Although the time on task often makes a useful UX metric, it clearly is not appropriate in some cases. For example, if the task performance time is affected by factors beyond the user’s control, then time on task is not a good measure of user performance. This exception includes cases of long and/or unpredictable communication and response-time delays, such as might be experienced in some Website usage.