Cost of Quality
Abstract
The cost of quality is a direct result of doing things wrong and by nonconformance and this is an indication of the level of quality achieved by an organization. This chapter details several categories and concepts involved in quality costs, and their computations by presenting cost models. The role of management in sustaining quality levels by controlling quality costs is emphasized. The significant relationship between safety and quality is illustrated by a case study.
Keywords
Cost of quality (COQ); “Life behind the dykes”; PAF (Prevention, Appraisal, and Failure) costs; External and internal failure costs; Hidden quality costs; Cost of lost opportunities; Service costs; Tangible and intangible costs; Visible costs and invisible costs; Iceberg illustration; Quality cost data; Quality cost analysis; Research in area of quality costing; Quality costing model; BS 6143 Part II; Pareto Principle; Vital few and trivial many; 80-20 rule; Principle of factor sparsity; Quality conformance level; Top management role; Quality and safety; Case study on quality cost; FORD’S Pinto cars
8.1 Introduction
Cost of Quality is the Cost of NonQuality
As Philip Crosby said, quality is measured by the cost of quality (COQ) which is a direct result of doing things wrong and by nonconformance. He emphasized that quality costs are those incurred in excess of those that would have been incurred if the product were built or the service performed exactly right the first time.
The traditional perception of the COQ was that higher quality requires higher costs, either by buying better materials, machines, or by hiring more labor.
When faced with mounting numbers of defects, organizations typically react by throwing more and more people into inspection roles. But inspection is never completely effective and appraisal costs stay high as long as the failure costs are significant.
It was during the late 1950s, that the concept of COQ emerged, with the realization that quality can be improved, not by increasing appraisal costs, but by striving to achieve defect-free production. Costs include not only those that are direct, but those resulting from lost customers, lost market share, and the many hidden costs and foregone opportunities not identified by modern cost accounting systems. This concept of quality has become increasingly relevant in the debates over quality. This has encouraged companies to identify, evaluate, and quantify the several costs associated with the quality function in order to improve quality at optimal costs.
8.2 Forces Leading to the Concept
Juran lists the following four forces that led to the above concept.
1. Growth of quality costs due to growth in the volume of complex products, which demanded higher precision, greater reliability, etc.
2. The influence of the great growth in long-life products, resulting in higher costs due to field failures, maintenance labor, spare parts, etc. The costs of keeping such products often exceeded the original purchase/manufacturing costs.
3. The need for quality specialists to express their findings and recommendations in the language of upper management, which is the language of money.
4. The fourth force is the phenomenon of “life behind the dykes,” a phrase coined by Juran to compare the dependence on quality to the Dutch way of life, where over a third of the country lies below sea level and is protected from the sea by building dykes. The land surely confers great benefits to the people, but the cost of the massive dykes is high, similar to the effective quality controls in a manufacturing situation.
8.3 The Categories of Quality Costs
Quality costs are defined as the costs associated with falling short of product or service quality as defined by the requirements established the organization, customers, and society.
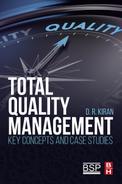
Juran in his book, Quality Planning and Analysis, and subsequently, several authors have classified these quality costs associated with making, finding, repairing, or preventing defects. The summary of these costs is represented in Fig. 8.1. As elaborated in later sections, these three costs are known as Prevention, Appraisal, and Failure (PAF) costs.
Internal failure costs are those that would exist before sorting out and removal of the defects prior to shipment. These are the costs of coping with errors discovered during development and testing and would be comprised of:
1. Scrap: The net loss in labor and materials resulting from defective products which cannot economically be repaired or used.
2. Rework: The cost of correcting defects to make them fit for use. Sometimes this category is broadened to include extra operations done to rectify them.
3. Retest: The cost of reinsertion and retest of products which have undergone reworking.
4. Downtime: The cost of idle facilities resulting from defects, like a rejected heavy casting being unloaded from the machine and carried to a test rig, as well as the discussions that take place. In some industries, this downtime is large and is quantified. But in most cases, this is ignored, adding to the total quality cost.
5. Yield losses: The cost of elemental time added due to ineffective controls of operation. For example, the overfilling of containers such as soft drinks due to variability in the filling and measuring equipment.
6. Disposition: The effort required to determine whether the nonconforming products can be used or not. This includes the individuals’ time and material review boards.
External failure costs are those that arise from defects that are noticed after the products leave the factory premises. They are distinguished from internal failure costs by the fact they are found after shipment to the customers. These could be comprised of:
1. Complaints: All investigations made after receipt of complaints from the customer.
2. Warrantee costs: This forms a major cost in the case of defective goods reaching the customer and includes testing and replacement of defective parts.
3. Recall costs: In case of recall of the products, the handling and other costs play a major role. Recently Maruti Udyog, Ltd. had recalled a certain lot of cars due to several complaints received about the petrol tanks.
4. Concessions: Some concessions such as discounts may have to be made to the customer in view of the substandard products being accepted by the customer.
5. Loss of sales: Poor quality supply would affect customer satisfaction and result in loss of reputation and loss of sales.
6. Litigation: If the customer is still not satisfied with the after-sales service or the above cited replacement, it may lead to his suing the company. This would entail substantial losses due to litigation expenditure incurred by the company.
Appraisal costs include the cost of determining the degree of conformance to the required quality levels. They are incurred to measure, inspect, test, and audit products and performance to determine conformance with acceptable quality levels, standards of performance, and specifications. The four elements of appraisal costs are
1. Manufacturing appraisal costs including product design, qualification, and conformance test costs, which are the costs incurred in checking the conformance of the product during the design stage, as well as throughout its progression in the factory, including the final acceptance and check of packing and shipping.
2. Purchase appraisal costs including supplier product inspection cost, incoming inspection, testing costs, etc.
3. External appraisal costs when there is a need for field trials of new products and services, including the field setup and checkout before official approval.
4. Miscellaneous quality evaluation costs that include the cost of all supports to enable continual customer satisfaction, such as the quality of packing, shipping process, promotions, and audits.
Preventions costs are those that are involved to rectify the processes that lead to the above losses. They include:
2. Design for quality
3. New product review
4. Process control
5. Equipment calibration
6. Database maintenance
7. Improvement projects
8. Staff training
9. Employee awareness
10. System development
11. System management
12. Requirement analysis
13. Reliability of development tools
14. Vendor evaluation
8.4 Hidden Quality Costs
Among the above, the hidden quality costs and costs of lost opportunities are listed below:
2. Cost of redesign
3. Cost due to change in the manufacturing processes
4. Extra manufacturing costs due to defects
5. Cost of software changes
6. Unaccounted scrap
8.5 Cost of Lost Opportunities
Among the above, the cost of lost opportunities is generally ignored by nonprofessional management. They include:
1. Revenue loss due to order cancelation
2. Losing to the competitors by not conforming to the customers’ needs
3. Loss of customer loyalty
4. Reduced repeat orders
8.6 Service Costs
In manufacturing, quality costs are basically product-oriented and have a definite relationship to the quantity of output, rejection percentage, etc.—tangible factors. However, in service functions, they are basically labor-oriented and can be as high as 70%, according to Evans and Lindsay.
8.7 Tangible and Intangible Costs
The costs can also be classified into tangible and intangible costs as shown below:
Intangible costs
● Delays and stoppages caused by defectives
● Customer goodwill
● Loss in morale due to friction between departments
Tangible costs—originated at the factory
● Materials scrapped or junked
● Labor and the burden on product scrapped or junked
● Labor, materials, and the burden necessary to effect repairs on salvageable components
● Extra operations added because of the presence of defective products
● Burdens arising from excess production capacity necessitated by defectives
● Excess inspection costs
● Investigation of causes of defects
Tangible costs—originated at the sales
● Customer complaints
● Charges to quality guarantee account
8.8 Visible Costs and Invisible Costs
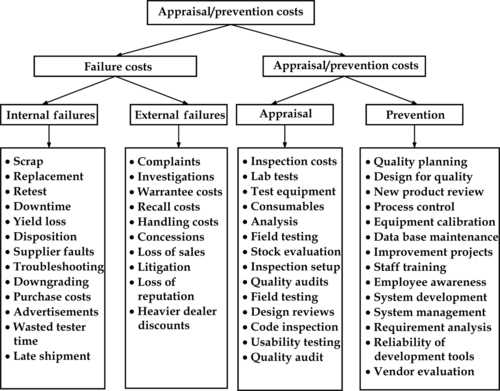
A majority of the quality costs are hidden and not manifested outside. They can be equated to huge icebergs floating in the ocean. A major portion of it lies under the surface and only a small tip is seen above. The ships which can see the visible portion on the surface can steer clear of the same. However, the invisible portion poses a major threat to their safety unless they become conscious of it. Similarly, the hidden costs form the bulk of the quality costs and we should concentrate more in identifying and reducing them. There is no point in concentrating our efforts to reduce only the visible costs, such as rework and rejection. This is illustrated by Fig. 8.2.
8.9 Quality Cost Data
Organizations need data on quality with respect to origination and information on quality costs because they lead the organization in a particular direction to drive strategies and organizational changes.
Some of the leading practices to collect reliable and appropriate data for driving quality excellence are:
1. To manage resources needed to achieve this road map by evaluating the effectiveness of these action plans
2. To operate the processes that make the organization work and continuously improve
3. To develop a comprehensive set of performance indicators that reflect internal and external customer requirements and the key factors that drive the organization
4. To use comparative information and data to improve the overall performance and competitive position
5. To continually refine information resources and their uses within the organization
6. To use sound analytical methods to when using the results to support strategic planning and daily decision-making
7. To involve everyone in measurement activities and ensure that the performance information is widely visible throughout the organization
8. To ensure the data and information secured is accurate, reliable, timely, and confidential
9. To ensure that the hardware and software systems are reliable, user-friendly and the data is accessible to all related personnel
10. To systematically manage organizational knowledge and to identify and share the best practices.
8.10 Case Studies on Research Done in the Area of Quality Costing
● In 1997, Schemahl et al. investigated the two areas of internal failure costs and measured their magnitudes. A simulation analysis disclosed the impact of rework inventory level and cycle times on the COQ.
● In 1998, Guruswamy observed that the COQ is considered by management as one of the important techniques of TQM, especially when the organization changes its approach from detection to prevention as a part of its exercises.
● In 1999, Campanella suggested that quality costs allow identifying the soft targets to which we can apply our improvement efforts.
● In 1999, Yasin et al. asserted that one potential critical facet of an organization’s TQM is its ability to measure costs related to quality.
● In 2000, Wali reported that to maintain or sustain a competitive edge achieving a low COQ by streamlining of processes, cutting down costs, ability to reduce wastes, and ability to meet customer needs are the most important in their quality improvement journey.
● In 2004, Jaju and Lakhe discussed the relationship of quality costs with several measures of the organization’s performance, such as market share, sales, profit, and return on investment.
8.11 Suggested Model for Quality Costing
This is also called the PAF approach and is illustrated in Fig. 8.3.

8.12 Sources for Collecting Quality Cost Data
The main sources for data collection on quality costs can be:
1. Data from normal accounting ledgers
2. Enlarged accounts by obtaining clarifications where needed
3. Company operating systems and procedures
4. Company standards and specifications
5. Data calculated or estimated from specific cases
6. Information from reports
7. Development of data formats to be filled in by concerned personnel to your requirement.
BS 6143 Part II suggests the following source documents for collecting the needed information for calculating the quality costs
2. Payroll analysis
3. Manufacturing expense reports
4. Scrap reports
5. Rework or rectifications reports
6. Inspection and test reports
7. Travel expenses claims
8. Field repair, replacement, and warranty cost reports
9. Nonconformance reports
8.13 Uses of Quality Cost Analysis
The quality cost analysis techniques are used in number of ways as shown below:
1. To identify profit opportunities
2. To make capital budgeting and other investment decisions
3. To improve purchasing and supplier related costs
4. To identify waste in overhead caused by activities not required by the customer
5. To identify a redundant system
6. To determine whether quality costs are properly distributed
7. To establish goals for budgets and profit planning
8. To identify quality problems
9. To act as a management tool for comparative measures of input-output relationships
10. To distinguish between the “vital few” and the “trivial many,” using the Pareto analysis
11. To allocate resources for strategic formulation and implementation
12. To act as a performance appraisal measure
8.14 Pareto Principle
The Pareto principle (also known as (i) the 80-20 rule, (ii) the law of the vital few, and (iii) the principle of factor sparsity, states that, for many events, roughly 80% of the effect comes from 20% of the causes. In other words, in any population, 20% of the people contribute to 80% of a parameter says the GDP. This is similar to the Principle of ABC analysis which states that in an engineering industry, 10% of the production items contribute to 70% of the total annual consumption. When applied to the maintenance situation, we can say that as per the Pareto principle, 20% of the machines cause 80% of the total machine down time. It is also illustrated in Chapter 3 on Quality Gurus.
This principle would help in identifying which of these quality costs the management should pay more attention to in reducing the total cost. Illustrated below are some of the quality costs that are generally found to be critical.
2. Rejection
3. Returned goods
4. Rework
5. Waste and scrap
6. Inspection and test equipment
7. Traveling outside endorsement
8. Calibration cost
9. Lost sales
10. Poor quality administration
11. Lack of quality training
12. Ineffective inspection and testing process
13. Poor quality planning
14. Internal quality audit
15. Extra operations
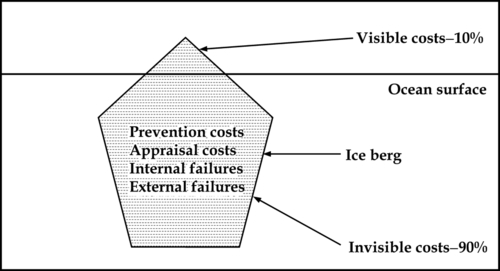
8.15 Quality Conformance Level
The top management always wishes to have tangible proof in terms of profit improvement, for continuing all efforts, and providing the resources to continue quality improvement programs. Evans and Lindsay observe that the quality cost approach, also called the COQ approach, has numerous objectives, but perhaps the most important one is to translate quality problems into the language of top management—the language of money and profits (Fig. 8.4).
8.16 Top Management Role in Containing Quality Costs
Crosby emphasizes a program for measuring and publicizing the cost of poor quality to bring them to the attention of management and provide opportunities for corrective action. Such data provide visible proof improvement and recognition of the achievement. Even Juran supported this approach.
This statement obviously accepts quality as a strong business driver and enables understanding the comparison between the quality and cost. We can call this cost-benefit analysis of TQM, in line with such an analysis in providing a safe environment.
In general, all organizations measure and report quality costs as suggested above. Of course, cost accounting has been a traditional tool for reporting rejection-related costs, but has been limited to inspection and testing results. All other costs, such as rework, have been accounted and clubbed as indirect costs or overhead and hence, not analyzed in depth nor could a serious attempt be made to isolate and improve them. Feigenbaum observed that quality and cost are a sum and not a difference; the objectives are complementary and not conflicting.
As managers began to define and isolate the costs as propounded in the first paragraph of this chapter, then the following facts were revealed:
1. The quantity-related costs are much higher than previously conceived, generally to 20–30% of the total sales.
2. The quality-related costs are not only limited to manufacturing operations, but also to ancillary activities like purchasing, inventory management, and customer service.
3. Most of these costs due to poor quality are avoidable, though superficially, they appear unavoidable.
4. Most of these avoidable costs are due to management shortcomings by not defining the clear responsibility or formulating the structural approach for the actions to reduce costs.
5. Another mistaken notion that better quality required higher costs has been exposed. This mistaken notion or myth has prompted several companies to invest heavily on quality-related projects, without realizing that any such investment logically and effectively planned and executed after a good analysis and homework, yields effective results at optimal costs.
8.17 Quality and Safety
Until the early 20th century, most consumer products were repetitions or modifications of products made for centuries. Consumers could use their commonsense in identifying the safety of using these products. Consequently, in case of any accidents or injuries caused by the defective product, the manufacturer generally related it to the customer’s carelessness in using the product, asserting that “goods once sold cannot be taken back.”
But during the last century, new products were introduced, with new designs and processes of manufacture, and together with the faulty manufacturing operations, these presented potential sources of injuries to the user. This increased occurrence of accidents and injuries attracted government and other agencies to protect the customer, not only against products causing injuries, but also against defective products that do not perform the required function. This has given rise to several legal problems with liabilities to the manufacturer. Consumer product safety has hence become a mandatory part of the design (we may call it DFS-Design for safety) and manufacturing process. Besterfield et al. say that in 1977, in a case involving defective latches in minivans, Chrysler Motor Corporation was asked to pay $262.5 million (equal to Rs. 262 crores those days, which is six times as much at today’s exchange rates).
8.18 Responsibility of Top Management for Product Safety
Juran and Gryna emphasize that the top management has the responsibility to define a corporate policy with respect to product safety, considering the following elements:
1. A commitment to make and sell only safe products, and to adhere to the published regulations, industry standards, etc.
2. Mandated formal design reviews and product reviews for safety.
3. Requirement that all company functions prepare formal plans defining their roles in carrying out the corporate policy.
4. Broad guidelines for documentation, product identification, and traceability to assure product integrity and to assist in defense against law suits.
5. Guidelines for defense against claims, whether rigid or flexible.
6. Guidelines for evaluation of safety performance and publication of corporate reports on results obtained.
7. Provision of audit to adhere to the policy.
8.19 Case Study on Quality Cost
Does minimizing the risk and designing for safety always result in more expensive alternatives?
Spending a long time in design and spending extra rupees for meticulously providing safety features in the design may appear to be a very expensive proposition, especially early in the design cycle of developing the prototype. This is a short-term viewpoint. Unsafe products in the market ultimately result in costly replacements or repair processes, or even expensive lawsuits. Hence, it is absolutely ethical to let the engineer spend as much time as required to achieve a safe design to minimize the future risk of injury or losses.
The United States is known for large-sized cars, including limousines, unlike small and compact foreign cars, especially from Japan and the United Kingdom. In late 1960s, the Ford Motor Company designed a compact car called the Pinto, weighing less than 2000 pounds and costing around US$ 2000, with estimated annual sales of about 11 million cars. Anxious to be in competition, Ford Motors provided a very short time for the design process, due to which styling preceded engineering design. One of the compact features resulted in positioning the fuel tank between the differential and the rear bumper. The possibility of the differential bolts puncturing the gas tank during rear impacts was not given due consideration. After the car had been put on the market, reports poured in about the seriousness of this puncturing and the high number of accidents it caused, and the law suits/claims that were filed. On a review of the design, the cost of providing a safe feature for the car was calculated as US$ 11 per unit for almost 11 million cars.
Comparing the social costs of US$ 200,000 per death, as the claims cost, the management had surprisingly decided that the annual cost of improving the design was more than the social cost and decided to continue the design. However, apart from the death claims, what they had not considered was the loss of reputation. The Pinto had poor sales subsequently, and the company paid a much higher price.
8.20 Conclusion
As illustrated in Fig. 8.2, most costs are hidden and not seen or realized during the course of work. More than just causing production losses and delays, poor quality products result in lost business opportunities. Consciousness of product safety, too, is of prime significance in the design and manufacture. Economizing in design features at the cost of safety is not true value engineering, and would lead a company to a steep downfall.
