Quality Loss Function
Abstract
“It is better to be precise and inaccurate than being accurate and imprecise.”
“Quality should be designed into the product and not inspected.”
“Quality is achieved by minimizing the deviation from the target.”
“The cost of quality should be measured as function of the deviation from the target.”
These are the philosophies highlighted by Genichi Taguchi and which form the principal concept behind the quality loss function put forward by him. This chapter explains these philosophies and details the principles and methodologies to achieve them.
Keywords
Quality loss function; Precision vs. accuracy; Taguchi philosophy; Off-line quality control rule; System design; Parameter design; Tolerance design; Design of experiments; ANOVA; Outer arrays; Robustification; Robust parameter design
31.1 What is Quality Loss?
The quality loss function as defined by Taguchi is the loss imparted to the society by the product from the time the product is designed to the time it is shipped to the customer. In fact, he defined quality as the conformity around a target value with a lower standard deviation in the outputs. It is a graphical representation of a variety of non-perfect parts that can each lead to losses, and these losses can be measured in rupee value. These losses basically originate from:
● Failure to function,
● Maintenance and repair cost,
● Loss of brand name leading to customer dissatisfaction,
● Cost of redesign and rework.
Wikipedia defines Taguchi loss function as the graphical depiction of loss to describe a phenomenon affecting the value of products produced by a company. It emphasizes the need for incorporating quality and reliability at the design stage, prior to production. It is particularly significant in products not involving close tolerances, but with wider than usual tolerances, or in other words, where the design specifies larger variations between the upper and lower control limits to suit the manufacturing facilities, rather than as required for the matching between two mating components in an assembly components.
The pre-1950 concept cost of quality as discussed in Chapter 8 is based on general non-statistical aspects of the quality costs to provide the basic understanding of how product costs are built up from the materials and labor costs point of view. On the other hand, the cost due to poor quality as emphasized by Taguchi’s loss function (post-1950) and discussed in this chapter has a different approach and treatment involving statistical analysis and graphical depiction. It emphasizes precision more than accuracy within the production standards.
31.2 Precision vs. Accuracy
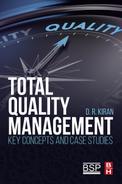
The two terms precision and accuracy are more or less synonymous in general sense, but in scientific measurement especially related to quality management, they are significantly different. Accuracy of a measurement or a system is the degree of closeness of measurements of a quantity to that quantity's true value. On the other hand, precision is the degree to which repeated measurements under unchanged conditions show the same results. These are illustrated in Fig. 31.1. Interestingly, measurements can be accurate but not precise as in Fig. 31.1A, or can be precise but not accurate as in Fig. 31.1C. The ideal situation is when the measurements are both accurate and precise as in Fig. 31.1E, and as emphasized by Taguchi. If the measurements vary too much and also far away from the actual values, the measurements are neither accurate nor precise.
31.3 History of the Development of the Concept of the Loss Function
During his work at the Japanese Electrical telecommunications lab in the 1950s and 1960s, Dr. Genichi Taguchi observed that for developing new products, a great deal of the engineers’ time and energy was spent in experimentation and testing. This, in fact, affected the final quality output to a large extent.
Taguchi argued that the performance requirements of the system are generally underspecified, that is, given too loose tolerances to allow for the process variations resulting in the quality loss function as described earlier.
He also deduced that 85% of the poor quality can be attributed to manufacturing process defects and only 15% to the operative. This led him to believe in the philosophy that instead of attributing the poor quality to the operative, the process and the product should be designed perfectly by building the quality into the design. It should start from the very beginning, that is, the product conception stage and continue during the design stage, the process development stage, and also the production stage, when care should be taken to eliminate variation.
The traditional method of calculating the losses are based on the number of parts rejected and reworked in a production facility. This method does not distinguish between two samples, both being within the specifications, but with different nominal values within those limits, as explained in the Fig. 31.1. It is thus to be understood that any item manufactured away from nominal would result in some loss to the customer, or the wider community through early wear-out; difficulties in interfacing with other parts, etc., even though they may be within the acceptable limits. These losses may be minimal, as Edwards Deming put them—unknown and unknowable. But Taguchi argued that such losses would inevitably find their way back to the originating corporation, like the saying, “Little drops of water make a mighty ocean.”
Taguchi, in his series of lectures emphasized the two related ideas.
l By statistical methods that are concerned with the analysis of variance. Experiments can be designed to enable identification of the important design factors responsible for degrading product performance.
l By meticulously and effectively judging the effectiveness of designs, the degree of degradation or loss as a function of the deviation of any design parameter from its target value can be assessed.
31.4 Taguchi Philosophy
Taguchi’s philosophy basically consists of three components which are described in the following paragraphs.
● The philosophy of off-line quality control; and
● Innovations in the design of experiments.
31.5 Quality Loss Function
Taguchi loss function or quality loss function is a graphical depiction of the losses accrued by the phenomenon that affects the value of products produced by a company, by variations within the production standards, even though the products themselves are within tolerance limits and hence, with acceptable quality standards.
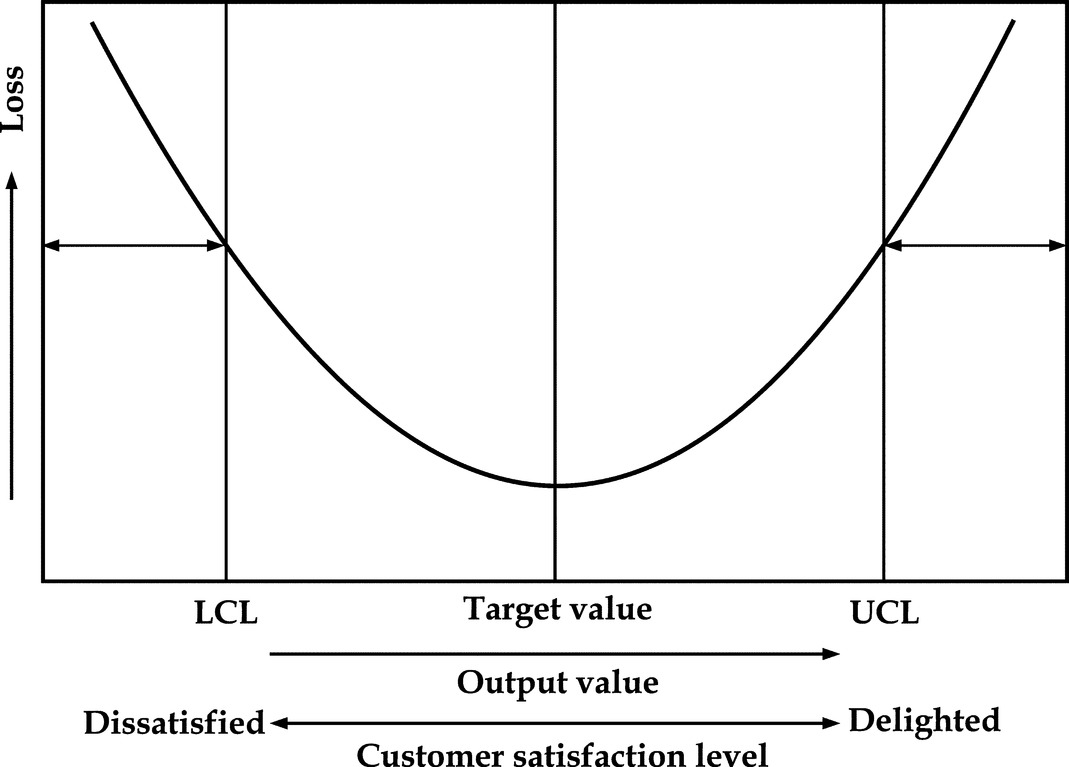
Deming, the quality guru and Taguchi’s contemporary, stated in his book, Out of the Crisis, that Taguchi Loss Function shows “a minimal loss at the nominal value, and an ever-increasing loss with departure either way from the nominal value.”
Taguchi loss function is largely credited for the increased focus on continuous improvement throughout the business world. It has also been instrumental to the Six Sigma movement and the concept of variation management.
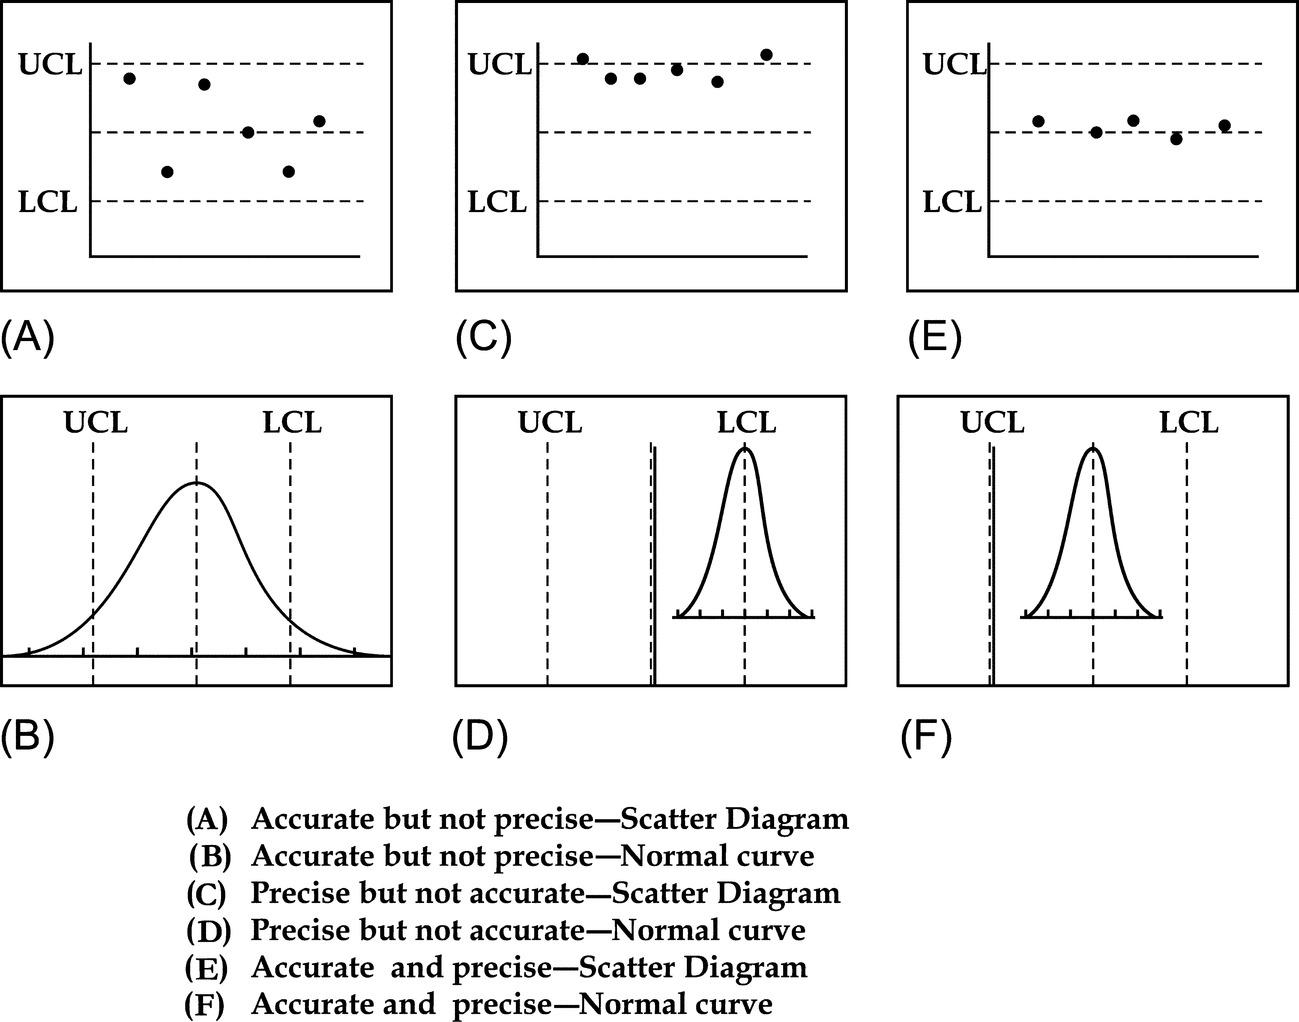
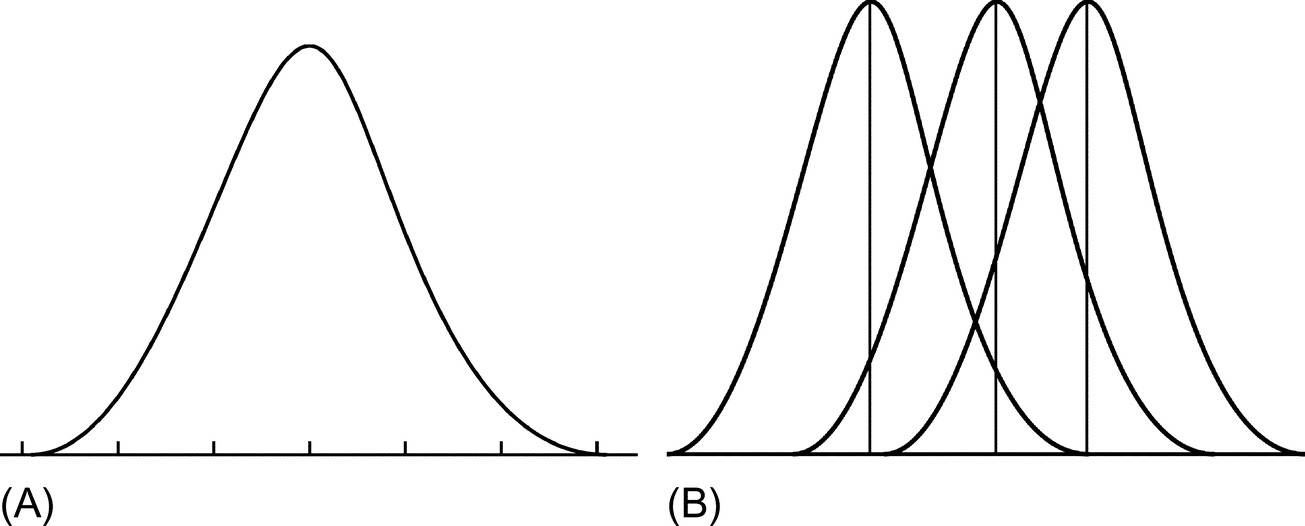
This significance can be understood from Figs. 31.2 and 31.3.
31.6 Off-Line Quality Control Rule for Manufacturing
According to Taguchi, more than in the manufacturing stages, it is during the design stage that the variation originates. This is called Taguchi philosophy, which later evolved into Design for Quality and Design for Six Sigma, which are described in detail in Chapter 32.
His strategy for quality engineering that can be used has three stages of design, viz:
● Parameter design
● Tolerance design
System design is the conceptual and non-statistical stage for engineering, marketing, and gathering customer knowledge and involves creativity and innovation with the adaptation of value engineering, as illustrated in Chapter 33.
Parameter design is concerned with the detail design phase of conventional engineering, the nominal values of the various dimensions, and design parameters need to be set. It involves analysis of how the product should perform against defined parameters and an optimal solution of cost-effective manufacturing, irrespective of the operating parameters.
Tolerance design—with a successfully completed parameter design, and an understanding of the effect that the various parameters have on performance, resources can be focused on reducing and controlling variation in the critical few dimensions.
31.7 Design of Experiments
While R. A. Fisher is credited for developing the concept of design of experiments as early as 1954, Taguchi developed a number of innovations in designing these experiments.
31.7.1 Outer Arrays
Because the conventional sampling method is inadequate here, as there is no way of obtaining a random sample of future conditions, Taguchi proposed judgmental sampling, extending each experiment with an outer array that simulates the random environment in which the product would function.
31.7.2 Management of Interactions
The impact of the uncontrolled variations, as explained below, plays a significant role in creating noise and affects the assessment of the end result of an experiment. Hence, Taguchi emphasized on robustification and noise variables as explained below.
31.8 Robustification
Robustification, as per Wiktionary, is to make designs more robust, that is, more tolerant of unexpected events. Robustification, also called robust parameter design, is the process of determining the settings of the control factors that minimize response variation from uncontrollable factors. This can be done by understanding and controlling the interaction between these variables. While these variables may easily be controlled in an experimental setting, outside of the experimental world, they are very hard and are called noise variables.
31.9 Noise Variables
Noise variables are those which are difficult or impossible to control at the design and production level, but can be controlled at the analysis or experimental stages, as in the variation in the loading pattern, or material variation.
While the controlled variables in electronic signal transmission perform perfectly, the uncontrolled variables cause audible noise, which is bothersome to the signal receivers. In a similar manner, in TQM, also such unwanted and uncontrolled variables are called “noise,” even though they are not audible.
31.10 Case Study
The following illustration explains how specifications of loose tolerances would create a loss to a company in the long run.
A company that manufactures parts that require a large amount of machining grew tired of the high costs of tooling. To avoid premature replacement of these expensive tools, the manager suggested that operators set the machine to run at the high-end of the specification limits. As the tool would wear down, the products would end up measuring on the low-end of the specification limits. So, the machine would start by producing parts on the high-end and after a period of time, the machine would produce parts that fell just inside of the specs. The variation of parts produced on this machine was much greater than it should be, since the strategy was to use the entire spec width allowed rather than produce the highest quality part possible. Products may fall within spec, but will not produce close to the nominal. Several of these “good parts” may not assemble well, may require recall, or may come back under warranty. The Taguchi loss would be very high.
This case study makes us consider if the savings of tool life was worth the cost of poor product?
31.11 Conclusion
For those who have been thinking that by specifying loose tolerances at the design stage, the rejection losses of the manufactured goods would be lower, Taguchi philosophy and the explanation is an eye-opener and made them realize that in the long run, the total losses, especially the losses due to the customer dissatisfaction, would be higher. Hence, precision plays a significant role in reducing the total losses, as explained in this chapter.
