Six Sigma
Abstract
The last decade of the 20th century saw quantum leap in the quality management by creating an appreciation and application of six sigma concept. However, the name “six sigma” which also exists in statistics as 6σ had initially created a misconception that the higher the sigma value in a distribution, the larger the range and hence, the lesser the quality which is far from the truth. Hence, this chapter makes an effort in explaining with illustrations, how “six sigma” is a philosophy, and that the sigma value used in statistics is different from the sigma level used in TQM. Several principles and methodologies of applying this technique are explained.
Keywords
Defects per million opportunities; Six sigma concept; Lean six sigma; Zero defects; Process capability; Five nines; Sigma value vs. sigma level; Kurtosis; Bombay Dabbawallas; Bank note counting machines; PDCA cycle; DMAIC; DMADV; Design for six sigma; Organizing for six sigma; Executive leader; Champion; Master belt; Black belt; Green belt; Yellow belt; Karate belts
24.1 Introduction
Six sigma is a business management strategy that allows companies to drastically improve their bottom line by designing and monitoring everyday business activities in ways that minimize waste and resources, while increasing customer satisfaction. The usual quality control programs focus on detecting and correcting commercial, industrial, and design defects. Six sigma encompasses something more. It provides specific methods to recreate the process so that defects and errors never arise in the first place. It should be noted that six sigma does not bring an overnight change. It is a long-term forward-thinking initiative. It is a philosophy.
This approach seeks to improve the quality of process outputs by identifying and removing the causes of defects (errors) as soon as they occur and minimizing variability in manufacturing and business processes. Once it gets established and consolidated, it results in almost zero defects by incorporating defect prevention right from the design stage.
Six sigma was heavily inspired by six preceding decades of quality improvement methodologies, such as quality control, TQM, and zero defects, based on the work of pioneers and quality gurus, as detailed in Chapter 3.
It may be noted that in recent times, the concept of Zero-Effect-Zero-Defect has become popular, as cited in Section 2.4, emphasizing industrial production without any effect on environment apart from defect-free production.
24.2 Definitions of Six Sigma
Six sigma can be defined as:
1. A statistical measure of the performance of a process or a product that establishes a measurable status on yield, as defects per million opportunities (ppmo).
2. A goal that reaches near perfection for performance improvement and reduces the variation to achieve a small standard deviation, so that almost all products and services meet or exceed customer expectations.
3. A management system to achieve lasting business leadership and world-class performance, with a management philosophy focused on elimination of mistakes, rework, scrap, and other wastes.
4. Six sigma is a business management strategy that seeks to improve the quality of process outputs by identifying and removing the causes of defects (errors) and minimizing variability in manufacturing and business processes.
–Wikipedia
5. Six sigma is a rigorous and disciplined methodology that uses data and statistical analysis to measure and improve a company’s operational performance by identifying and eliminating “defects” in manufacturing and service-related processes.
–iSix Sigma Orgn
6. Six sigma is a data-driven method for achieving near perfect quality. Six sigma analysis can focus on any element of production or service, and has a strong emphasis on statistical analysis in design, manufacturing, and customer-oriented activities.
–UK Department for Trade and Industry
24.3 History of Six Sigma
● Since the 1920s, the word “sigma” has been used by mathematicians and engineers as a symbol for a unit of measurement in product quality variation.
● The latter half of the 20th century has seen significant advances in quality improvement methodologies, such as quality control, TQM, and zero defects, based on the work of pioneers such as Shewhart, Deming, Juran, Ishikawa, Taguchi, and others.
● Inspired by these works, the engineers of Motorola developed the principle of Six Sigma in 1981. They used “Six Sigma” as an informal name for an in-house initiative for reducing defects in production processes.
● By the late-1980s, following the success of the above initiative, Six sigma was extended to other critical business processes. Six sigma became a formalized branded name for a performance improvement methodology in any field of business process.
● Motorola started the system of grading their six-sigma experts by colored belts like black belt, in line with the popular practice of the karate experts being graded by the color of their belts, such as blue belt, green belt, and black belt. In 1991, the company certified its first “Black Belt” six sigma experts, which indicates the beginnings of the formalization of the accredited training of six sigma methods.
● According to Wikipedia, Motorola held the trademark for six sigma and reported to have saved over US$ 17 billion until 2006.
● In 1995, General Electric implemented Six Sigma and by 1998, it reported savings of over US$750 million.
● Almost simultaneously, the Japanese industries like Toyota have successfully implemented this technique and some of them have achieved the six sigma level.
● During the late 1990s, Indian industries, too, began taking this seriously and some of them succeeded in achieving six sigma level by the middle of the last decade.
● Nowadays, some organizations have integrated six sigma with the concept of lean manufacturing and called the methodology Lean Six Sigma.
24.4 Required Skills for Black Belted Experts in Six Sigma
A black belt expert is the team leader and is expected to be most skillful in planning and implementing six sigma projects. He is responsible for:
● identifying and understanding these processes in detail, and also
● understanding the levels of quality (especially tolerance of variation) that customers (internal and external) expect, and then
● measuring the effectiveness and efficiency of each process performance—notably the “sigma” performance—ie, is the number of defects per million operations (ppm).
24.5 The Concept of Six Sigma in the Context of TQM
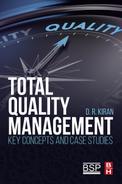
Since the 1920s, the word “sigma or σ” has been used by mathematicians and engineers as a symbol for standard deviation, which is a unit of measurement in product quality variation that is how far a given process deviates from perfection. The higher the sigma is, the higher the variation.
Let us see the normal curve used in statistics. For a definite value of σ, the shape of the curve or the Kurtosis is the same. When we say 6σ here, we mean spread within six times the σ value arithmetically. The % number of items included between μ + 6σ and μ – 6σ is 99.99966% as illustrated in Fig. 24.1 and detailed in Table 24.1. Prior to the evolution of the term six sigma, people used the term Five Nines or 99.999% which almost represents today’s six sigma level.
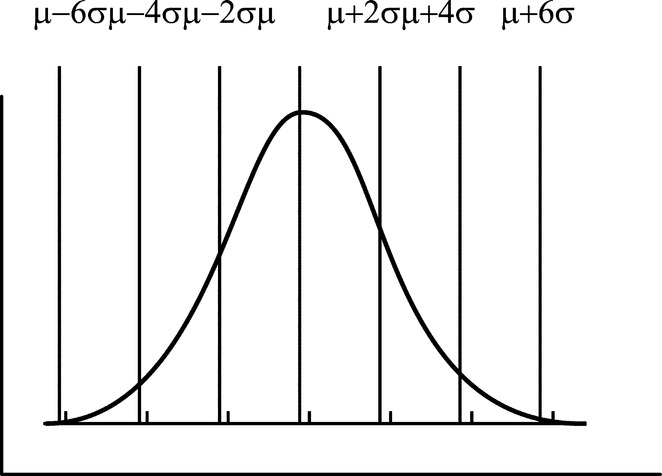
Table 24.1
The Values of the Defect Percentages Under Various Sigma Levels
| Sigma Level (Note the Word “Sigma” is Used Instead of the Symbol σ | Defects per Million Opportunities (DPMO) | Percent Defective (%) | Percentage Yield (%) |
| 1 Sigma | 691,462 | 69 | 31 |
| 2 Sigma | 308,538 | 31 | 69 |
| 3 Sigma | 66,807 | 6.7 | 93.3 |
| 4 Sigma | 6210 | 0.62 | 99.38 |
| 5 Sigma | 233 | 0.023 | 99.977 |
| 6 Sigma | 3.4 | 0.0034 | 99.99966 |
| 7 Sigma | 0.019 | 0.000019 | 99.9999981 |

However, in quality control, the concept of the term six sigma is different from the above. Here the upper and lower control limits for a process are fixed and are very significant. Thus, when we say three sigma level quality, we mean that the 99.73% of the items equal to those that are included within μ + 3σ and μ − 3σ values in a normal curve lie within the control limits, with a lower kurtosis curve. When we say six sigma quality, we mean that 99.9999966% of the items, equal to those that are included within μ + 6σ and μ − 6σ values in a normal curve, lie within the control limits, so that the curve is steeper with a higher kurtosis value.
To make it clear, we can say that in TQM, the six sigma is referred to a situation when the % number of items that are contained within the specified control limits are equal to those contained within the μ + 6σ and μ − 6σ limits in a normal curve of statistics. Figs. 24.1 and 24.2 clearly explain the difference between the two concepts.
In TQM, the central idea behind Six Sigma is that if you can measure the number of defects in a process, you can eliminate them and get as close to “zero defects” as possible. To achieve Six Sigma Quality, a process must produce no more than 3.4 defects per million opportunities. An “opportunity” is defined as a chance for nonconformance, or not meeting the required specifications. This means we need to be nearly flawless in executing our key processes. Six Sigma basically involves the following factors.
1 Customer perception of quality
2 Defects that prevent delivery of what the customer wants
3 Process capability
4 Variation as seen and felt by the customer
5 Consistent and predictable processes for improvement
6 Designing to meet customer needs and process capability.
24.6 Origin of This Confusion Between Statistical 6σ and TQM Six Sigma
The illustration below shows how the use of the word 6σ in the concept of six sigma has created a general confusion.
In a guest lecture on six-sigma in one of the technical meetings of a professional association, the speaker gave a very good case study from an industry. He illustrated how the quality, thereby the profitability, has tremendously improved by increasing the sigma level from the 4-sigma to 6-sigma. Really, it was a good and interesting case study. However, to illustrate the higher sigma levels, he was progressively increasing the horizontal space between his hands. One of the listeners pointed out that the wider difference in higher sigma level should only indicate higher variation, in which case, how could it mean higher quality. The speaker had no answer.
The concept with which we use the term σ (sigma) in statistics is different from that it is used in TQM, as can be clearly understood by Figs. 24.1 and 24.2. The figure on the left explains the statistical meaning of 6σ without reference to the upper and lower control limits. It indicates the percentage of the values that lie within the certain σ values. On the other hand, from the TQM point of view, the upper and lower control limits are very important and it is the kurtosis of the control curve that decides the percentage of the values that lie within the two limits. The higher the kurtosis value, the higher the sigma level per TQM concept as explained above. Hence, it is very important to distinguish between σ of statistics and sigma of TQM. In statistics σ is represented by “value,” while in TQM, sigma is represented by “level.”
The engineers of Motorola in the United States used the term “Six Sigma” for the first time in 1981 as an informal name for an in-house initiative for reducing defects in production processes. Whereas in statistics σ is a measure of the deviation from the normal, Motorola engineers meant to imply the values contained within that sigma limits for the same normal curve, without perhaps realizing the confusion that would be created by the word “sigma.”
Nevertheless, this concept was extensively applied first in Toyota Motor Corporation to achieve higher quality levels, and has come to stay as the most important tool world over to achieve higher quality standards. This term Six Sigma has now become a hallmark that many organizations have used, and continue to use, to improve quality, and to provide quality and performance improvement services and training. Several Indian industries have achieved this level.
Motorola itself puts it,
We think about Six Sigma at three different levels:
● As a methodology
● As a management system
Essentially, Six Sigma is all the three at the same time.
In a nutshell, Six Sigma is a vertical (top-down) method, initiated at CEO-level for executing business strategy by using and optimizing these process elements:
● Aligning critical improvement efforts to business strategy.
● Mobilizing teams to attack high-impact projects.
● Accelerating the improvement of business results.
● Governing efforts of the teams to achieve and sustain improvements.
It is widely believed that introducing Six Sigma is likely to produce far greater returns in organizations that need to achieve these things, compared to organizations that are already doing them.
Remember while using sigma in TQM:
1. Call it six sigma (at the most 6-sigma) and do not use the symbol 6σ.
2. To refer to the extent of its application, use the term “level” and not “value.” That is to say “I achieved six sigma level quality,” and not “I achieved a quality of six sigma value.”
24.7 Six Sigma According to General Electric
According to General Electric, “Six Sigma is a highly disciplined process that helps us focus on developing and delivering near-perfect products and services. The word sigma is a statistical term that measures how far a given process deviates from perfection. The central idea behind Six Sigma is that if you can measure how many “defects” you have in a process, you can systematically figure out how to eliminate them and get as close to “zero defects” as possible. To achieve Six Sigma Quality, a process must produce no more than 3.4 defects per million opportunities. As explained earlier, an “opportunity” is defined as a chance for nonconformance, or not meeting the required specifications. This means we need to be nearly flawless in executing our key processes.”
In a nutshell, Six Sigma revolves around a few key concepts.
● Critical to quality: Attributes most important to the customer
● Defect: Failing to deliver what the customer wants
● Process capability: What your process can deliver
● Variation: What the customer sees and feels
● Stable operations: Ensuring consistent, predictable processes to improve what the customer sees and feels
● Design for Six Sigma: Designing to meet customer needs and process capability…”
24.8 The Values of the Defect Percentages
In Table 24.1 below, the last column indicates the percentage of values that lie within the control limits. The more popular measure, the number of defects per million opportunities (1-acceptable specifications per million opportunities), is indicated in the second column. Most of the popular Japanese companies, as well as several Indian industries like the TVS group, have achieved 6σ level and are striving to achieve the 7σ level.
When practiced as a management system, Six Sigma is a high performance system for executing business strategy. Six Sigma is a top-down solution to help organizations to
● Align their business strategy to critical improvement efforts
● Mobilize teams to attack high impact projects
● Train its people to focus on key performance areas
● Accelerate improved business results
● Govern so the efforts to ensure improvements are sustained
● Understand where the organization wants to go (its strategy, related to its market-place)
● Understand the services that the organization’s customers need most
● Understand and better organize main business processes that deliver these customer requirements
● Measure (in considerable detail) and improve the effectiveness of these processes.
It may be noted that the Bombay Dabbawalas have provided a classic example of achieving 6σ level in their lunch box distribution. The case study in Section 24.14 is a striking example. The other striking illustration is the note-counting machines used in banks, and other cash handling offices in achieving the 7σ level. Several banks have reported that during their use for the past over 5 years, there has not been a single case of wrong counting.
24.9 Methodologies for Six Sigma
Deming’s PDCA cycle, one of the earliest principle of total quality management, forms a classic illustration of how the design stage forms the first step in the journey towards achieving six sigma at the final product stage.
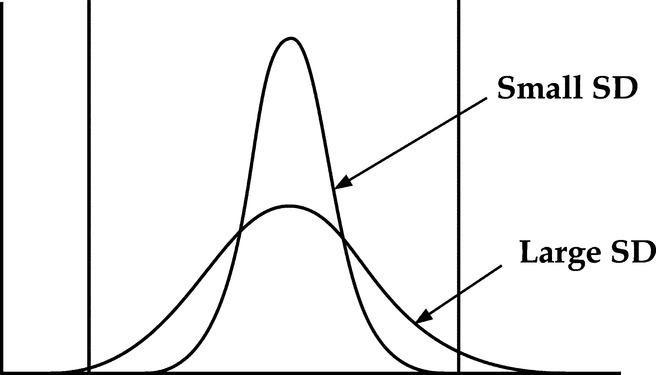
24.10 DMAIC Methodology for Six Sigma
Deming’s popular TQM methodology of Plan-Do-Check-Act Cycle as described more in detail in Chapter 1, can be effectively adapted in an attempt to achieve six sigma levels. This is generally used for improving an existing product or process and is further developed into DMAIC (Define, Measure, Analyze, Improve, and Control) the methodology described in Section 24.12 and shown in Fig. 24.3.
24.11 DMADV
While DMAIC emphasizes on the improvement of the existing processes, the improvement should start from the design of the product/process itself for developing the process in order to achieve six sigma. In this case, PDCA methodology is further modified as DMADV (Define, Measure, Analyze, Design, Verify). DMADV as adapted for Design for quality is explained in Chapter 32 more in detail.
The other acronyms related to DMAIC/DMADV are
● IDOV (Identify, Design, Optimize, and Validate)
● DCCDI (Define, Customer Concept, Design, and Implement)
● DMEDI (Define, Measure, Explore, Develop, and Implement)
Whatever may be the acronym we adapt, all of these methodologies cited above use techniques similar to Quality Function Deployment, Failure Modes and Effects Analysis, Design of Experiments, methods improvement, value engineering, simulation, statistical optimization, error proofing, Robust Design, etc. The only distinguishing feature is whether they are used for existing product/process improvement (like DMAIC, methods improvement, etc.) or for new products or processes (like DMADV, value engineering, etc.). The term D in other acronyms may mean Design for new products or re-design for existing products.
24.12 Detailed Methodology of DMAIC
Wikipedia details each of these DMAIC steps as below. It may be noted here that though we have numbered them serially, the steps are interrelated and flexible. We may analyze them even during the improvement. We may still be finding scope for new metrics before measuring them. We may be collecting data even after analysis. We may start guessing even while preparing, as emphasized in Chapter 22 on Kaizen.
24.12.1 Define
This step articulates clearly the business problem, goal, potential resources, project scope, and a timeline for the progress of the project. This includes:
● Identify and define the problems.
● Identify the customers and their requirements as explained more in detail in Chapter 30 on Quality Function Deployment, to chart out the Voice of the customer and their needs that are Critical to Quality.
● Define data types (discrete and continuous) and data collection methods.
● Project targets or goals as well as the project boundaries that define our scope.
● A project charter, which is often created and agreed upon during this step.
24.12.2 Measure
This step establishes the present process performance baselines in an objective manner as the basis for improvement and collects all relevant data. This will not only provide a goal for the project, but also enables us to compare with those after the project, so as to determine objectively whether significant improvement has been made or not and if so, by how much. It is essential to plan well ahead and decide the metrics, their suitability and the methods of measuring them. A relevant and substantial data is the heart of the DMAIC process:
● Identify the gap between current and required performance.
● Collect data to create a process performance capability baseline for the project metric, that is, the process output or outputs.
● Draw a SIPOC (suppliers, inputs, process, outputs, and customers) chart that summarizes the inputs and outputs in table form.
● Assess the measurement system (for example, a gauge study) for adequate accuracy and precision.
● Establish the following
○ Concepts of variation
○ QC tools
○ Management tools
○ MSA and measuring process capability
● Calculation of process sigma level
● Calculation of baseline performance
● Establish a high-level process flow baseline. Additional details can be filled in later.
24.12.3 Analyze
The purpose of this step is to identify the root cause of the problem, validate and select the method of its elimination. A large number of potential root causes of the project problem are identified by root cause analysis techniques, such as fish bone diagram, value analysis, and method improvement studies that involve elemental breakdown. The top 3–4 potential root causes are selected using team consensus tools like multi-voting for further validation. Data is collected and analyzed to establish the relative contribution of each root cause affecting the project output metric. This process is repeated until “valid” root causes can be identified. After validating root causes, the following shall be done.
● Listing and prioritizing potential causes of the problem.
● Prioritizing the root causes (key process inputs) to pursue in the Improve step.
● Identifying how the process inputs affect the process outputs. Data is analyzed to understand the magnitude of contribution of each root cause, to the project metric. Cause and Effect Analysis and other Statistical tests using p-values accompanied by Histograms, Pareto charts, and line plots are often used to do this.
● Validating causes and arriving at the root cause.
● Creating detailed process maps to help pinpoint where in the process the root causes reside, and what might be contributing to the occurrence.
24.12.4 Improve
After analyzing as above, the next step is to develop solutions and improve. The purpose of this step is to identify solutions to the problems in part or in whole. This is the step that largely incorporates the concept of creativity explained in Chapter 22 on Kaizen. Special mention can be made here are:
1. Creative methodology (Section 22.9)
2. Brain storming (Section 22.10.5).
3. Value analysis (Chapter 33).
4. Design of experiments with specific reference to the work of Taguchi (Chapter 31).
5. Test solutions using Plan-Do-Check-Act (PDCA) cycle.
6. FMEA which anticipate any avoidable risks associated with the improvement conceived in the above techniques (Chapter 26).
7. After the above indicated validations, create a detailed implementation plan and deploy improvements.
24.12.5 Control
The purpose of this step is to sustain the gains. Monitor the improvements to ensure continued and sustainable success. Create a control plan. Update documents, business processes, and training records as required.
A Control chart is useful during the Control stage to assess the stability of the improvements over time by serving as a guide to continue monitoring the process and to provide a response plan for each of the measures being monitored in case the process becomes unstable. Other steps for control are:
● Assessing the results of process improvement
● Developing process control plan
● Standardization
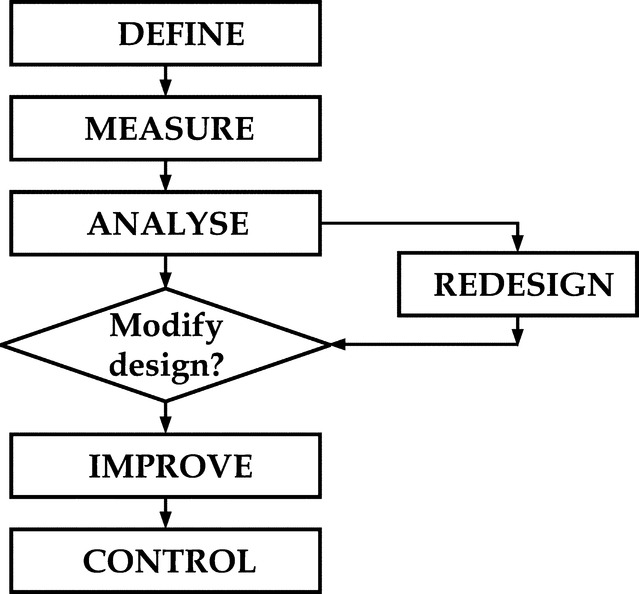
The flow chart for DMAIC methodology can be represented by Fig. 24.4
24.13 Organizing for Six Sigma
Several companies abroad and in India have adopted six sigma as their prime tool for maintaining high quality standards. For professionalizing six sigma activities, it is essential to specify the members of the team performing this exercise. Wikipedia details the following classifications.
1 Executive leader, including the CEO and other top members of the organization. They are ultimately responsible for the whole project and empower the other role holders with the freedom and resources.
2 Champions, take responsibility for Six Sigma implementation across the organization in an integrated manner. The Executive Leader draws them from upper management. Champions also act as mentors to black belts.
3 Master black belts, identified by champions, act as in-house coaches on Six Sigma. They devote 100% of their time to Six Sigma. They assist champions and guide black belts and green belts. Apart from statistical tasks, they spend their time on ensuring consistent application of Six Sigma across various functions and departments.
4 Black belts, operate under Master black belts to apply Six Sigma methodology to specific projects. They devote 100% of their time to Six Sigma. They primarily focus on Six Sigma project execution, whereas Champions and Master black belts focus on identifying projects/functions for Six Sigma.
5 Green belts, the employees who take up Six Sigma implementation along with their other job responsibilities, operate under the guidance of black belts.
6 Yellow belts, trained in the basic application of Six Sigma management tools, work with the black belt throughout the project stages and are often the closest to the work.
Unlike the Karate field where the members actually wear the respective cotton belts suiting their respective expertise, the team members of six sigma projects do not wear such belts but their designations are only symbolic with a sole purpose of creating an interest of belonging among the members.
24.14 Software Used for Six Sigma
The following are some of the software popularly used to manage and track a company’s six-sigma program. Since the details discussion and explanation of these software is beyond the scope of this book, the readers are advised to refer to their respective websites.
● IBM Web Sphere Business Modeler
● iGrafx
● JMP
● Mentor soft PRO
● Microsoft Visio
● Minitab
● Stat graphics
● STATISTICA
● Telelogic system architect
24.15 The Case Study of Mumbai Dabbawalas
During the early 1970s, when this author was working at L&T, Powai, Bombay, he was utilizing the services of Mumbai Dabbawalas who were bringing his lunch box from Chembur to Powai. Though much thought was not given to it then, he was pleasantly surprised 40 years later to learn that they have been recognized by international quality gurus, as the best illustration of a supply chain management system in the world, having earned six sigma rating by the Forbes Business magazine in 1998 and found a place in the Guinness Book of World Records. In 2010, the National Institution for Quality and Reliability, a premier quality professionals’ institution of India had awarded them the Best Service Organization award (Fig. 24.5).

True, during the 4 years of their day-to-day service, this author did not miss his lunch even for a single day. On a nostalgic chat with the recipient of the award in 2010, the following statistics have been recapitulated (Fig. 24.6).

They were supplying one lakh lunch boxes from homes of different parts of Mumbai to offices/factories located at different places. Today the figure must have reached 2 lakh lunch boxes. Around 9 am, 30 boxes would be collected from the houses by each person and carried to the nearest Railway station like Kurla, where all such groups would be re-sorted destination wise and exchanged among the delivery boys. There would be another regrouping and re-sorting at the destination Railway station and carried to the particular work spot by a third delivery boy. This process would be repeated between 2 pm and 5 pm when the empty boxes would be returned to the houses.
Though they do not have formal education, they use a unique coding system indicating the pickup point, regrouping points, and the destination point. They employ 500 persons, including 300 delivery boys and 200 supervisors to ensure accuracy at every re-sorting point. This shows the importance given to this system of having so many supervisors (one for every 2 pickup/delivery boys) which is a rare case in the industrial scenario.
The Wikipedia site en.wikipedia.org/wiki/Dabbawala gives a detailed report on this unique organization.
24.16 Conclusion
As detailed in Section 24.6, even though this concept has been named six sigma in a casual manner causing confusion with the statistical parameter of 6s, it has become the most significant tool in the quality movement, having achieved wonders in industries all around the world, and has come to stay as the backbone of total quality management.
