
17
Vibro‐acoustography and its Medical Applications
Azra Alizad1 and Mostafa Fatemi2
1 Department of Radiology, Mayo Clinic, Rochester, MN, USA
2 Department of Physiology and Biomedical Engineering, Mayo Clinic, Rochester, MN, USA
17.1 Introduction
Vibro‐acoustography (VA), a new ultrasound‐based imaging modality, has gained much interest in the medical field in recent years. This acoustic imaging modality uses the radiation force of ultrasound to induce low‐frequency vibrations in the tissue and creates images of the acoustic response. This chapter focuses on potential biomedical applications of VA. The purpose is to bring together the results of various studies, ex vivo and in vivo, on breast, thyroid, human arteries, and prostate. Here, after a brief discussion about the general principle of VA, we describe the applications. Future developments and potential impact of VA in breast and thyroid imaging are also discussed.
17.2 Background
New imaging modalities based on radiation force of ultrasound have been developed for characterizing mechanical properties of soft tissues. All of these methods aim to differentiate normal tissue from diseased tissue by exploiting the elasticity as a contrast mechanism. Ultrasound radiation force vibrates and deforms soft tissues noninvasively, and the resulting mechanical response of tissues provides elasticity information useful in detection and differentiation.
17.2.1 General Principles of VA and Method
VA is a noninvasive imaging technique that produces palpation‐like information by measuring the acoustic response of a tissue or object to a vibration induced by the radiation force of ultrasound [1, 2]. The VA technique can be summarized in three steps:
- applying a localized oscillating force on or inside the tissue to induce vibration,
- recording the resulting sound arising from the vibrating tissue, and
- creating an image from the recorded acoustic signal [3].
The basic concept of the VA technique is using the force of ultrasound. Numerous investigators have studied the theory of acoustic radiation force [4–7], and the biomedical applications of acoustic radiation force has been described by Sarvazyan et al. [8].
VA uses two ultrasound beams at slightly different frequencies, f 1 and f 2, and these beams focus at a common location to produce a modulated ultrasound radiation force at Δf and creates an acoustic field. The focused US beam is scanned across the tissue. A hydrophone placed nearby obtains acoustic emissions to form an image. The resulting VA images are speckle free. Figure 17.1 shows a simplified VA system [3, 9].

Figure 17.1 Generation of localized oscillatory radiation force using two ultrasound beams.
17.2.2 Features of a Vibro‐acoustography Image
A VA image illustrates information about ultrasonic properties such as the scattering and power absorption characteristics, which are also seen in conventional ultrasonography. Most importantly, VA depicts the dynamic characteristics of the tissue at frequency Δf that represents how the tissue responds to a vibrating force, which are related to mechanical properties and tissue stiffness. Such information is not available from conventional ultrasonography [1, 2].
Furthermore, VA produces images free of speckle, the snowy pattern seen in conventional US images. Speckle reduces the contrast of ultrasound images and small structures such as microcalcifications. In addition, low‐contrast lesions in tissue cannot be easily seen. The acoustic emission signal in VA, which is at a low frequency, creates speckle‐free images with high contrast [3]. VA is still in the research stage. A number of experiments have been conducted to evaluate its effectiveness in various applications.
17.3 Application of Vibro‐acoustography for Detection of Calcifications
Ex vivo VA has been used to characterize and image biological tissues [10–14]. VA is capable of detecting macro‐ and micro‐calcifications and delineates these calcifications with high contrast. Microcalcifications are common findings in a wide spectrum of breast lesions, ranging from benign to malignant [15]. The clinical application of VA in detection of microcalcifications in radiologically dense breasts found in younger, pregnant, or lactating women has great potential. The ability of VA to detect calcification has been studied in vitro in a variety of human tissues including breast [16–20], prostate [21, 22], heart valve leaflets [23], and human arteries [24].
We present an example of breast tissue microcalcification detected by VA. A bright spot at the center of X‐ray represents the microcalcification. VA of this tissue clearly shows the microcalcification also as a bright spot. The shape and position of the microcalcification match well with the corresponding spot in the X‐ray. VA also shows the structure of the soft tissue (Figure 17.2).

Figure 17.2 Single microcalcification: (a) X‐ray image of the breast tissue showing a microcalcification at the center of the sample; (b) VA of the same tissue shows the calcification as bright spot.
Source: © 2004 IEEE, reprinted, with permission, from [17].
Figure 17.3 shows VA images of two carotid arteries. The left artery is from a young person and has no calcification. The right artery is from an older person. The arteries were immersed in a water tank for scanning. The Δf in this experiment is 7 kHz. The VA image shows no calcification on the left artery, while some calcium deposit near the bifurcation on the right artery is seen as a bright region.
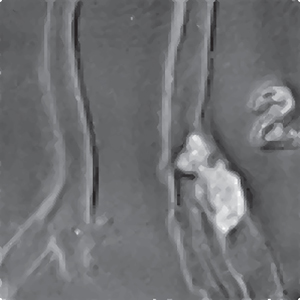
Figure 17.3 VA of excised human carotid arteries: vibro‐acoustography of the normal and calcified arteries The calcification is seen as a bright region in vibro‐acoustography images.
Source: © Institute of Physics and Engineering in Medicine; reproduced by permission of IOP Publishing, all rights reserved [11].
Figure 17.4 shows VA images of an aortic valve and the corresponding radiography. The VA image resembles the radiography of this heart valve. The arrow in both images points to a small piece of calcification, about 1 mm in diameter, that is visible in both the radiograph and the vibro‐acoustic scans. This image demonstrates that VA may be used to identify early calcification buildup on heart valves.

Figure 17.4 (a) Photograph of calcified aortic valve; (b) X‐ray of aortic valve mounted on scanning bracket; and (c) VA image of calcified tissue valve. VA scan image resembles the corresponding radiography of heart valve tissue. Arrow points to small piece of calcification (1 mm in diameter), seen in both X‐ray and VA scan images.
Source: reprinted from [23], copyright 2002, with permission from Elsevier.

Figure 17.5 (a) X‐ray of a prostate tissue (calcification is seen in the center); (b) US of the tissue; and (c) VA image of this prostate tissue shows calcification plus anatomical zones, peripheral zone (PZ) and central zone (CZ).
VA scanning has been conducted on a series of prostate tissues. Imaging results of ex vivo prostate tissues reveals the potency of VA as a promising tool to detect abnormalities, delineate tissue structures and anatomical zones, and locate calcifications. We present the X‐ray, US, and VA images of a prostate tissue in Figure 17.5. Tissue X‐ray shows a cluster of micro and macro‐calcification, but the US image is not informative. The VA image of this prostate tissue clearly demonstrates a group of large calcifications as well as the anatomical zones, peripheral zone (PZ) and central zone (CZ).
17.4 In Vivo Breast Vibro‐acoustography
17.4.1 Background on Breast Imaging
Breast cancer is the most common non‐skin cancer among women in the USA and the second leading cause of cancer death in US women, after lung cancer [25]. Depending on their application, many of the current imaging modalities have low specificity rates. The diagnostic performance of mammography is greatly reduced, especially in dense breasts. This is particularly important in the case of high‐ and moderate‐risk women who need to be screened at younger age when they have dense breasts, obscured masses, or lesions with microcalcifications (MCs) and small lesions. Ultrasound imaging is not sensitive to MCs. Even as studies report high sensitivity with MRI, one of the major limitations of breast MRI is that false‐positive enhancement can occur in benign breast lesions, resulting in relatively low specificity. The poor specificity results in unnecessary follow‐ups and biopsies, extra cost, and great emotional distress. Breast MRI also relies on other tissue parameters that do not contrast mass lesions based on tissue stiffness [26, 27].
Tissue stiffness is known to be associated with pathology [28, 29]. Except for the emerging elastography methods, none of the current imaging modalities used in clinics today, such as conventional breast US, mammography, and MRI, is sensitive to stiffness. Manual detection of breast lumps (palpation) is the simplest, yet is effective for identifying and differentiation of breast masses. However, the diagnostic performance is poor in deep lesions and depends on the expertise of examiner.
Part of these problems, if not all, could be resolved with VA (as an imaging tool). VA is sensitive to stiffness and provides palpation‐like information that is sensitive to tissue stiffness – thus it may be used to improve the diagnosis of breast cancer. VA, a low‐cost and noninvasive imaging modality, is sensitive to mechanical properties of breast and can provide information not available in other imaging modalities. In particular, VA is sensitive to microcalcifications (MCs) [17], which are markers of some breast cancers. In addition, the performance of VA is not reduced in dense breast. MRI is not sensitive to MCs and it is hard to detect MCs with ultrasound. Breast imaging by VA has been reported before [3, 18, 19, 30, 31], where the images were mainly evaluated against X‐ray mammography. The purpose of this section is to present the results of various studies on in vivo breast VA to demonstrate the potentials of this technology and the role it may play in the future as a breast‐imaging tool.
17.4.2 Method of In Vivo VA and Results
A VA system was integrated into a stereotactic mammography machine (Fischer Imaging Inc., MammotestTM system) and has been tested for in vivo breast imaging [18]. This combined system enables the operator to obtain matching VA and mammography images of the human breast. The patient lies down in a prone position while her breast is passed through a hole in the bed. The breast is placed between the back panel, which includes the X‐ray detector, and a sliding compression panel. The compression panel consists of a window covered with a thin latex membrane transparent to US beam. An annular confocal US transducer is located behind the window. VA images were acquired in the cranial‐caudal view at different depths from the skin. The VA image area was 5 × 5 cm. A hydrophone is placed on the side of the breast to receive the acoustic emission generated by the radiation force of US. The simplified diagram of the VA system is shown in Figure 17.6.
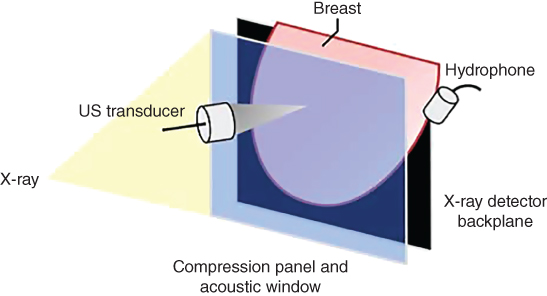
Figure 17.6 Diagram of the combined mammography and vibro‐acoustic system. Breast positioning between panels is shown.
Source: adapted from [31].
In vivo breast VA using the integrated system has been studied on 60 female patients with breast lesions [31]. Benign and malignant breast cases will be discussed as follows.
A female patient in her 40s with a palpable mass in her right breast has been examined. Targeted US examination on palpable site revealed a 29 × 19 ×13 mm lobulated well‐defined, mildly hypoechoic mass. Diagnostic mammography showed heterogeneous, dense parenchyma in both breasts, but did not show the palpable mass. A marker was placed on the skin to identify the location of the palpable mass (Figure 17.7). The result of pathology has proved the mass to be a fibroadenoma. The importance of this case is that VA can identify masses not seen on mammograms.
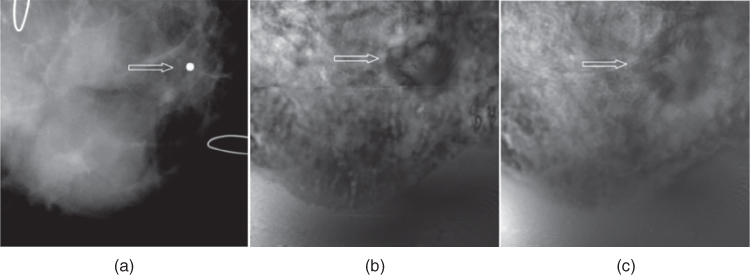
Figure 17.7 Fibroadenoma: (a) mammography shows the marker placed on the location of palpable mass; (b) and (c) VA images of the same breast at 2.0 cm depth (b) and 2.5 cm depth (c) show a lobulated well‐defined mass (arrows).
Source: adapted from [31].
A case of fibroadenoma is shown in Figure 17.8. The patient is in her 70s. Scattered fibroglandular densities and two masses were identified on both breasts in mammography screening. The diagnostic mammography showed a 2 cm sharply marginated mass with coarse lobulation on the right breast (Figure 17.8a). The VA image of the right breast clearly showed the margins and mass with the gentle coarse lobulation that are classic findings in fibroadenoma. The calcification seen in mammogram is at a different depth and is not visible at the depth of this VA image.
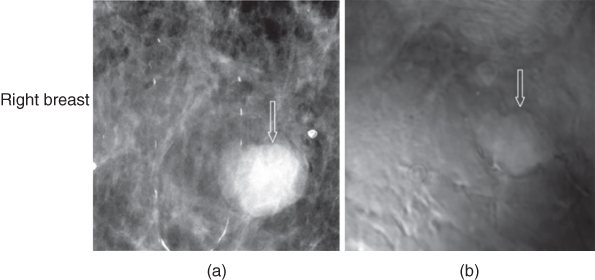
Figure 17.8 Fibroadenoma: (a) mammography of the right breast shows a round well defined mass (arrow); (b) VA at 2.5 cm depth shows a well‐defined mass (arrow). Patient moved after mammography and during the examination, thus the mass slightly shifted upward.
Source: reprinted from [31].
Figure 17.9 shows another case, a woman in her 60s, whose screening and diagnostic mammography identified a small group of suspicious microcalcifications of different sizes and shapes along with minimal architectural distortion and increased soft‐tissue density. Targeted US confirmed a 5 × 7 cm hypoechoic lesion with an irregular border and posterior shadowing. The biopsy revealed an invasive ductal carcinoma, Nottingham grade II/III, in her right breast. The VA image was able to identify the lesion as a small irregular mass with fine spiculation that is characteristic of this type of malignant mass. The characteristic spiculation was difficult to see in the mammogram.

Figure 17.9 Invasive ductal carcinoma: (a) Mammography demonstrations increased soft‐tissue density (arrow); (b) US image shows a hypoechoic lesion with shadowing; and (c) VA shows an irregular mass with spiculation (arrow).
Source: reprinted from [31].
A patient in her 60s with mammographically dense breasts was examined. During mammography, a spiculated mass with no calcification was noted in her left breast (Figure 17.10a). Breast MRI identified a large, enhancing, irregular, spiculated mass measuring 8.5 × 3.3 × 5.4 cm in the left breast (Figure 17.10b). This was associated with left breast shrinkage and nipple inversion. VA of this breast also identified the lesion, which extended beyond the 5 × 5 cm of the imaging window, with remarkable spiculation that is suggestive of malignancy (Figure 17.10c). The pathology revealed the mass as grade I infiltrating lobular carcinoma. This case demonstrates that VA can detect breast cancer.

Figure 17.10 Infiltrating lobular carcinoma. (a) Mammogram identifies a large distorted area with spiculation. The U‐shaped wires are used to present image orientation. (b) US images shows a large irregular hypoechoic mass with shadowing. (c) Magnetic resonance image shows a large, irregular region. (d) VA shows a large spiculated mass that almost covers the imaging window.
Source: adapted and modified from [31].
VA studies using a confocal VA system demonstrate the ability of VA in identifying various breast abnormalities, including microcalcifications as well as benign and malignant masses with relatively high specificity [3, 31]. This system was equipped with a water tank to accommodate acoustic coupling to tissue during scanning. A drawback of this system is limited access to parts of the breast near the chest wall and slower image acquisition.
To overcome the limitations of the annular confocal VA system, to shorten the scanning time, and to provide optimum coverage of the breast for imaging, we have advanced our imaging system by implementing VA on a clinical ultrasound scanner equipped with a “quasi‐2D” array transducer. We call this technique “quasi‐2D vibro‐acoustography” (Q2‐DVA). A clinical ultrasound scanner (GE Vivid 7, GE Healthcare Ultrasound Cardiology, Horten, Norway) was modified to perform both ultrasound imaging and VA. The Q2‐D transducer array is in the form of a matrix with multiple rows and columns of ultrasound elements. This transducer is electronically constructed to generate an ultrasound beam resembling that of the confocal transducer. The newly designed VA system was tested on patients with breast lesions [32]. Our results indicate that our newly modified VA system can identify benign and malignant solid breast lesions and can easily detect microcalcification. Our results suggest that with further development, Q2‐DVA can provide high‐resolution images and has the potential to provide diagnostic information in the clinical setting and may be used as a complementary tool in support of other clinical imaging modalities. Here, we present the preliminary in vivo results of breast VA obtained by the new VA system equipped with the array Q2‐D transducer [33].
First we present a case of invasive ductal carcinoma. The patient is a woman in her 50s with a palpable lump in her right breast. Her mammography demonstrated a heterogeneous dense breast with a central focal asymmetry (dashed yellow contour) and small microcalcifications (red arrows). Targeted clinical US showed a 21 mm × 14 mm irregular hypoechoic mass with an indistinct margin and posterior acoustic shadowing. VA images obtained with the handheld 1.75D probe show the mass and dimensions of the lesions are larger than those of the clinical US image (Figure 17.11). Similar findings have been seen and confirmed in our previous VA study [31] where malignant breast masses appeared lager in VA than in B‐mode US. The pathology of this mass revealed it to be invasive ductal carcinoma, Nottingham grade II.

Figure 17.11 Invasive ductal carcinoma. (a) Mammogram of the right breast demonstrates a central focal asymmetry. Microcalcifications are marked with arrows. (b) B‐mode US shows an irregular 23 mm hypoechoeic mass. (c, d) VA images obtained by array probe at depths of 25 mm and 27.5 mm, respectively. The lesion is marked with cross markers on panel (c). The presence of calcifications is also noted in the VA image at 25 mm (marked with red arrows).
Source: reprinted from [33]; copyright 2014, with permission from Elsevier.
VA imaging of a benign fibroadenoma is presented here. A woman in her 40s with a palpable lump in her left breast was examined. Diagnostic mammography showed a heterogeneous dense breast with a 15 mm well‐circumscribed solid mass at the anterior depth (yellow arrow), shown in Figure 17.12. Her targeted US demonstrated a corresponding solid round mass with circumscribed margins. VA images were obtained at a depth of 20 mm and revealed a well‐defined mass (yellow arrows). US guided biopsy revealed a benign fibroadenoma.

Figure 17.12 (a) Magnified mammography of the left breast shows a round mass with circumscribed margin. (b) US image demonstrates the round mass with mixed internal echogenicity and circumscribed margins. (c) 1.75D VA image of the breast outlines the corresponding mass (arrows).
Source: reprinted from [33], copyright 2014, with permission from Elsevier.
A diagnostic mammogram in a patient discovered a partially obscured oval mass (yellow arrow in Figure 17.13a). A targeted transverse US image demonstrated an oval hypoechoic mass with posterior shadowing measuring 19 × 10 × 10 mm (Figure 17.13b). The VA image obtained at a depth of 30 mm showed an elongated mass with a well‐defined border, suggesting a benign lesion. The biopsy result revealed the lesion as sclerosing fibroadenoma with densely hyalinized stroma. The sclerosing accounts for the shadowing posterior to the lesion. The mass is well‐visualized (dark) in the VA image. The lesion shown to be at deeper depths by VA than shown in B‐mode imaging, due to more compression applied during the clinical US imaging procedure.
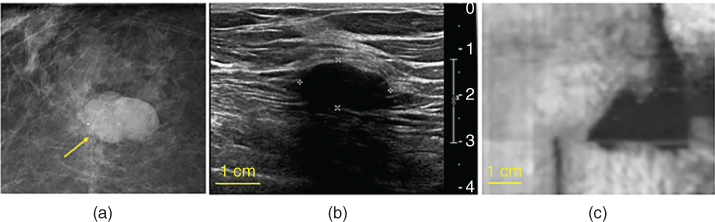
Figure 17.13 Sclerosing fibroadenoma: (a) magnified mammogram shows an oval mass in the posterior depth of the right breast; (b) clinical B‐mode ultrasound documents the corresponding mass; (c) quasi‐2D vibro‐acoustography image of breast tissue with a sclerosing fibroadenoma at a depth of 30 mm.
Source: reprinted from [33], copyright 2014, with permission from Elsevier.
The results of the study using VA implemented on a clinical ultrasound scanner equipped with a Q2‐D US transducer indicate that this new VA has the potential to identify and differentiate breast lesions. The Q2‐DVA system can also overcome the difficulties associated with using confocal VA, such as the inability to image lesions close to the chest wall or the discomfort associated with patient positioning and compression. Our results provide a foundation for further development of clinical VA systems and further investigation in a larger group of patients.
17.5 In Vivo Thyroid Vibro‐acoustography
Ultrasonography of thyroid does not always lead to conclusive results. Furthermore, current ultrasound imaging technology has a poor performance in detecting important microcalcifications and its role in diagnosis of malignant nodules is limited and carries poor specificity [34]. Uncertainties in ultrasound and other thyroid imaging methods lead to a large number of unnecessary biopsies. Fine needle aspiration biopsy (FNAB) is associated with false‐negative rate of up to 11%, a false‐positive rate of up to 8%, with a sensitivity of about 80%, and a specificity of 73% [35–38]. Vibro‐acoustography is sensitive not only to the ultrasound properties of the tissue but also to the dynamic behavior at low frequencies; thus VA offers information that is not available with conventional ultrasound.
We have investigated the feasibility of using VA with a handheld array US transducer for detection and localization of thyroid nodules [39]. The results demonstrate that VA implemented on a clinical ultrasound scanner equipped with a handheld array US transducer can identify and has potential to differentiate thyroid nodules.
A 48‐year‐old female patient with a benign thyroid nodule was examined. B‐mode ultrasound identifies large hypoechoic nodule with small cystic appearance measuring about 47 × 27 mm (x‐z dimensions). The nodule appears on C‐mode US, taken at 2 cm depth, measuring about 44.2 × 30.5 mm (x‐z dimensions). The VA at 2.0 cm depth reveals the large nodule with distinct margin measuring about 30.5 mm in the y direction and more than 47 mm in the x direction, with its side margins extending out of VA image window. Its shape and location corresponds to the C‐scan US at 2 cm depth (Figure 17.14).

Figure 17.14 Benign nodule: (a) B‐mode US of a patients thyroid shows a large solid nodule with small cystic component; (b) ultrasound C‐scan at 2.0 cm depth measuring about 44.2 × 30.5 mm in the x‐y dimensions; and (c) in vivo VA image of thyroid (with 7 L array probe) at 2.0 cm depth which corresponds to the C‐scan plane, measuring more than 47 mm. The VA image is 47 × 50 mm.
Source: reprinted from [39].
US and VA images of the right side thyroid of a 37‐year‐old male with papillary thyroid carcinoma are shown in Figure 17.15. Targeted US shows a cystic nodule measuring about 1.0 × 1.3 × 1.4 cm with peripheral calcifications, one of the characteristics of papillary carcinoma. The VA scan at 2.5 cm depth identifies the nodule with a cystic appearance in slightly larger dimensions as well as some peripheral calcifications with greater clarity than shown in the US image, denoted by arrows.

Figure 17.15 Papillary thyroid cancer: (a) B‐mode US shows a cystic nodule measuring 1.0 × 1.3 × 1.4 cm with peripheral calcifications, as denoted by arrows; (b) VA scan at 2.5 cm depth shows the nodule with cystic appearance slightly in larger size with coarse peripheral calcifications.
Source: reprinted from [39].
These results suggest that VA may have a potential as a clinical tool in thyroid imaging; however, VA is not intended to replace B‐mode US or FNAB. Larger studies are needed to determine sensitivity and specificity of this imaging tool in thyroid cancer detection and differentiation.
17.6 Limitations and Further Future Plans
This VA system can overcome the difficulties associated with using confocal VA, such as inability to image the lesions close to the chest wall, and the discomfort associated with patient positioning, breast compression, and longer scanning duration. There were a few problems that were encountered in the in vivo study. First, a system artifact that is associated with steering the VA beams across the aperture, which created streaks in the VA image. We have developed an algorithm to correct for these streaks [40], but this algorithm can diminish image details. Effort is continued to find alternatives to correct this artifact. In addition, motion artifacts are associated with patient breathing occurring during in vivo VA scanning and manifested as jagged image detail. Our results should provide a foundation for further development of clinical VA systems and further investigation in a larger group of patients.
One step in further development of a VA system is using a reconfigurable array (RCA) transducer that would provide another route for clinical implementation of VA imaging. VA using a RCA transducer has important advantages. Using a 2D RCA transducer eliminates the need for mechanical translation as is needed with a confocal transducer [2] or a linear array transducer [40]. The RCA electronic scanning is expected to take about 2 ms per pixel, which is 6‐fold improvement over the confocal transducer [41]. The simulation study performed by our group provides a strong framework for optimization of VA imaging with RCA transducers for different medical applications. Further development and implantation with RCA transducer is in progress to achieve the optimum VA imaging.
Acknowledgments
The work described in this chapter was supported by grants from grant BCTR0504550 from the Susan G. Komen for the cure and National Institutes of Health (NIH) grants R21 CA121579, R01CA127235, R21 EB00535, R33 EB00535, R01EB017213, R01CA148994, R01CA148994‐S1, R01CA168575, and R01CA174723 from the NIH‐National Cancer Institute. The content of this chapter is solely the responsibility of the author and does not necessarily represent the official views of NIH. The authors are very grateful to Dr. James Greenleaf and Dr. Matthew Urban for their collaboration during the study and Ms. Adriana Gregory for providing a VA scheme figure for this chapter.
Disclosure: MF and AA disclose that MF and Mayo Clinic hold patents on VA technology (discussed in this chapter) as a potential financial conflict of interest. MF has received royalties from a company that has licensed the VA technology from Mayo Clinic.
References
- 1 Fatemi, M. and Greenleaf, J.F. (1998). Ultrasound‐stimulated vibro‐acoustic spectrography. Science 280 (5360): 82–85.
- 2 Fatemi, M. and Greenleaf, J.F. (1999). Vibro‐acoustography: An imaging modality based on ultrasound‐stimulated acoustic emission. Proc. Natl. Acad. Sci. 96 (12): 6603–6608.
- 3 Alizad, A. and Fatemi, M. (2005). Breast vibro‐acoustography. In: Emerging Technologies in Breast Imaging and Mamography (ed. R.R. Suri and J.S. Laximinaryan), 1st edn., vol. 1, 9. Stevenson Ranch, CA: American Scientific Publishers.
- 4 Westervelt, P.J. (1951). The theory of steady forces caused by sound waves. J. Acoust. Soc. Am. 23 (3): 312–315.
- 5 Westervelt, P.J. (1957). Acoustic radiation pressure. J. Acoust. Soc. Am. 29 (1): 26–29.
- 6 Torr, G. (1984). The acoustic radiation force. Am. J. Phys. 52 (5): 402–408.
- 7 Jiang, Z.Y. and Greenleaf, J.F. (1996). Acoustic radiation pressure in a three‐dimensional lossy medium. J. Acoust. Soc. Am. 100 (2): 741–747.
- 8 Sarvazyan, A.P., Rudenko, O.V., and Nyborg, W.L. (2010). Biomedical applications of radiation force of ultrasound: historical roots and physical basis. Ultrasound Med. Biol. 36 (9): 1379–1394.
- 9 Urban, M.W., Alizad, A., Aquino, W., et al. (2011). A review of vibro‐acoustography and its applications in medicine. Curr. Med. Imaging Rev. 7 (4): 350–359.
- 0 Greenleaf, J., Ehman, R.L., Fatemi, M., et al. (1998). Imaging elastic properties of tissue. In: Ultrasound in Medicine (ed. F. A. Duck, A. C. Baker, and H. Z. Starritt), 263–277. Bristol, England: Institute of Physics Publishing.
- 1 Fatemi, M. and Greenleaf, J.F. (2000). Probing the dynamics tissue at low frequencies with the radiation force of ultrasound. Phys. Med. Biol. 45 (6): 1449.
- 2 Fatemi, M., Manduca, A., and Greenleaf, J.F. (2003). Imaging elastic properties of biological tissues by low‐frequency harmonic vibration. Proc. IEEE 91 (10): 1503–1519.
- 3 Fatemi, M. and Greenleaf, J.F. (2002). Imaging the viscoelastic properties of tissue. In: Imaging of Complex Media with Acoustic and Seismic Waves, 257–276. Springer.
- 4 Fatemi, M. and Greenleaf, J. (2000). Imaging and evaluating the elastic properties of biological tissues. Ultrasound 8 (4): 16–18.
- 5 Lester, S.C. and Cortan, R.S. (1999). The breast. In: Robins Pathologic Basis of Diseases, 6th edn. (ed. C.T. Kumar and T. Collins). Philadelphia: Saunders.
- 6 Fatemi, M., et al. (2002). Vibro‐acoustic tissue mammography. IEEE Trans. Med. Imaging 21 (1): 1–8.
- 7 Alizad, A., et al. (2004). Performance of vibro‐acoustography in detecting microcalcifications in excised human breast tissue: A study of 74 tissue samples. IEEE Trans. Med. Imaging 23 (3): 307–312.
- 8 Alizad, A., et al. (2005). Potential applications of vibro‐acoustography in breast imaging. Technol. Cancer Res. Treat. 4 (2): 151–157.
- 9 Alizad, A., et al. (2006). Critical issues in breast imaging by vibro‐acoustography. Ultrasonics 44: e217–e220.
- 0 Alizad, A., et al. (2004). Application of vibro‐acoustography for detection of calcified arteries in breast tissue. J. Ultrasound Med. 23 (2): 267–273.
- 1 Mitri, F., et al. (2009). Vibro‐acoustography imaging of permanent prostate brachytherapy seeds in an excised human prostate – preliminary results and technical feasibility. Ultrasonics 49 (3): 389–394.
- 2 Alizad, A., et al. (2013). Application of vibro‐acoustography in prostate tissue imaging. Med. Phys. 40 (2): 022902.
- 3 Alizad, A., et al. (2002). Detection of calcium deposits on heart valve leaflets by vibro‐acoustography: An in vitro study. J. Am. Soc. Echocardiogr. 15 (11): 1391–1395.
- 4 Pislaru, C., et al. (2008). In vivo vibroacoustography of large peripheral arteries. Invest. Radiol. 43 (4): 243.
- 5 Ferlay, J., et al. (2015). Cancer incidence and mortality worldwide: sources, methods and major patterns in GLOBOCAN 2012. Int. J. Cancer 136 (5): E359–E386.
- 6 Friedrich, M. (1998). MRI of the breast: state of the art. Eur. Radiol. 8 (5): 707–725.
- 7 Esserman, L., Wolverton, D., and Hylton, N. (2002). Magnetic resonance imaging for primary breast cancer management: current role and new applications. Endocrine Rel. Cancer 9 (2): 141–153.
- 8 Levy, M., Bass, H., and Stern, R. (2002). Handbook of Elastic Properties of Solids, Liquids, and Gases. Academic Press.
- 9 Krouskop, T.A., et al. (1998). Elastic moduli of breast and prostate tissues under compression. Ultrason. Imaging 20 (4): 260–274.
- 0 Alizad, A., et al. (2008). Image features in medical vibro‐acoustography: In vitro and in vivo results. Ultrasonics 48 (6): 559–562.
- 1 Alizad, A., et al. (2012). Breast vibro‐acoustography: initial results show promise. Breast Cancer Res. 14 (5): R128.
- 2 Urban, M., et al. (2013). A beamforming study for implementation of vibro‐acoustography with a 1.75‐D array transducer. IEEE Trans. Ultrason., Ferroelect., Freq. Control 60 (3): 535–551.
- 3 Mehrmohammadi, M., et al. (2014). Preliminary in vivo breast vibro‐acoustography results with a quasi‐2‐D array transducer: a step forward toward clinical applications. Ultrasound Med. Biol. 40 (12): 2819–2829.
- 4 Papini, E., et al. (2002). Risk of malignancy in nonpalpable thyroid nodules: predictive value of ultrasound and color‐Doppler features. J. Clin. Endocrinol. Metabol. 87 (5): 1941–1946.
- 5 Gharib, H. and Goellner, J.R. (1993). Fine‐needle aspiration biopsy of the thyroid: an appraisal. Ann. Intern. Med. 118 (4): 282–289.
- 6 Burch, H.B., et al. (1996). Fine needle aspiration of thyroid nodules. Acta Cytolog. 40 (6): 1176–1183.
- 7 Alexander, E.K. (2008). Approach to the patient with a cytologically indeterminate thyroid nodule. J. Clin. Endocrinol. Metabol. 93 (11): 4175–4182.
- 8 Raab, S.S., et al. (2006). Errors in thyroid gland fine‐needle aspiration. Am. J. Clin. Pathol. 125 (6): 873–882.
- 9 Alizad, A., et al. (2013). In vivo thyroid vibro‐acoustography: a pilot study. BMC Med. Imaging 13 (1): 12.
- 0 Urban, M.W., et al. (2011). Implementation of vibro‐acoustography on a clinical ultrasound system. IEEE Trans. Ultrason., Ferroelect., Freq. Control 58 (6): 1169–1181.
- 1 Kamimura, H.A., et al. (2012). Vibro‐acoustography beam formation with reconfigurable arrays. IEEE Trans. Ultrason., Ferroelect., Freq. Control 59 (7): 1421–1431.