37
Historical Growth of Ultrasound Elastography and Directions for the Future
Armen Sarvazyan1 and Matthew W. Urban2
1 Artann Laboratories, West Trenton, NJ, USA
2 Department of Radiology, Mayo Clinic, Rochester, MN, USA
37.1 Introduction
The field of elastography or elasticity imaging has grown from in its infancy more than two decades ago to become an emerging medical imaging modality. It has found utility among physicians for many different applications. The field and the level of clinical applications are projected to grow.
The purpose of this chapter is to examine how the field of ultrasound elastography has grown over time. To measure this impact we analyzed the publication record using PubMed for the field and looked at different distinctions and trends. Additionally, we offer a perspective on future investigations that could be pursued for the use of acoustic radiation force (ARF) for ultrasound elastographic applications.
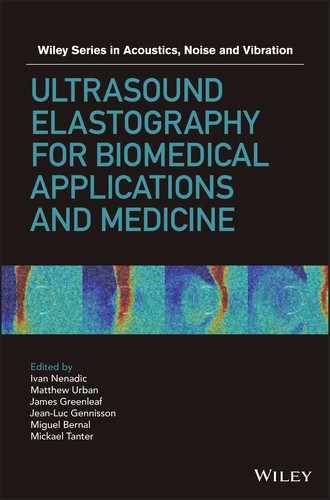
There are numerous methods that fall under the umbrella of the field of “ultrasound elastography” that have been detailed in previous chapters of this book. Figure 37.1 demonstrates the various techniques employed in the field of elastography and elasticity imaging as a whole [1–22]. This figure lists the various means of excitation. The methods use mechanical, endogenous, or acoustic radiation force as the deformation source.
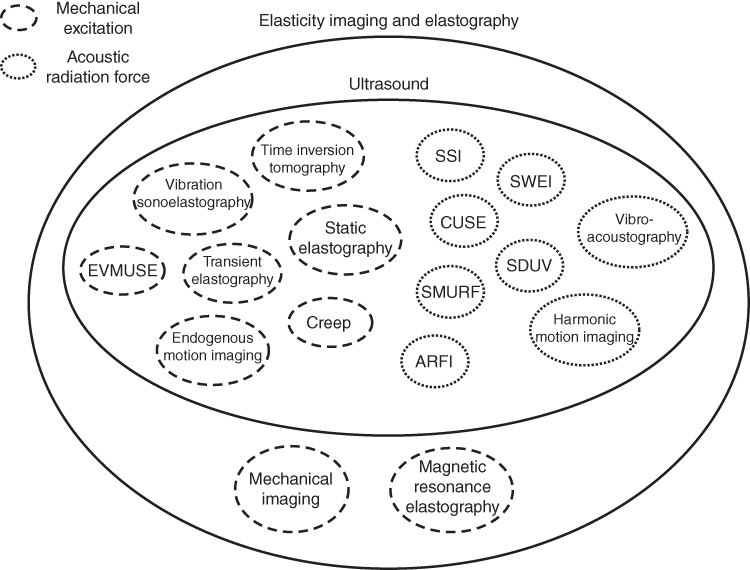
Figure 37.1 Diagram of elastography and elasticity imaging methods with excitation mode depicted by different line types. Mechanical excitation is denoted with dashed lines and acoustic radiation force is denoted with dotted lines.
37.2 Elastography Publication Analysis
In order to evaluate the development of this field we will provide an overview of the growth of this field using the metric of published reports in the biomedical literature. We used PubMed to perform targeted searches in the biomedical literature and looked at the number of publications from 1995 to 2015. The histograms that follow provide insight into the publication dynamics which can be an efficient tool for exploring history and milestones of a branch of science or technology and for making projections on future applications in particular areas.
To make these analyses a limited set of keywords were used that would encompass the main aspects of the subject at hand, which is the measurement of tissue elasticity with ultrasound. The list consisted of the terms: ultrasound elastography, elastography, elasticity imaging, shear wave, and acoustic radiation force. The first search that was performed was on “ultrasound elastography” and is shown in Figure 37.2.

Figure 37.2 Dynamics of publications on “ultrasound elastography” according to the PubMed database from 1995 to 2015.
In the 1990s, few research groups (less than a dozen) in the United States, Europe, Japan, and Russia started working in this field and basic principles and various modalities of the technology were developed. The great surge in the publications in 2007/2008 seen in the histogram of Figure 37.2 shows the start of wide clinical use of ultrasound elastography. After that steep rise in the number of publications in 2008, we see a steady increase of activities in the field, demonstrating successful application of the technology in various areas of medical diagnostics and treatment monitoring. This shift coincided with the implementation of elastography methods in clinical ultrasound machines so that methods could be used in many different patient populations throughout the world.
It should be noted that ultrasound elastography is part of a larger field of elastography that encompasses other imaging techniques, including magnetic resonance imaging and mechanical or tactile imaging [21, 22]. However, because ultrasound is a relatively inexpensive and widely available modality, methods developed using ultrasound can be disseminated widely for access to patients. Figure 37.3 shows the proportion of ultrasound elastography reports with respect to all “elastography” reports. This figure clearly shows a significant increase in the number of the contributions in the last 2 or 3 years from elastography modalities other than ultrasound elastography, mainly owing to increased activities in the fields of MR elastography and tactile imaging.

Figure 37.3 Comparison of histograms for “elastography” and “ultrasound elastography” from 1995 to 2015.
Terminology and choice of key words are an important issue in science. In the literature related to the subject of this review two synonyms are commonly used: “elasticity imaging” or “elastography”. Each of these terms has certain advantages. The term “elasticity imaging” marks the technology alongside the other diagnostic medical imaging tools such as MR imaging, X‐ray imaging, acoustic imaging, tactile imaging, optoacoustic imaging, etc. At the same time, “elastography” is shorter and at the present, after elasticity imaging became a proven and widely accepted modality in the last couple of years, “elastography” is used more and more often, as illustrated in Figure 37.4. For example, “shear wave elasticity imaging” (SWEI), the first ultrasonic elastography technology using shear acoustic waves, is currently more often called “shear wave elastography” (SWE), not SWEI, which appears to rename the original technology. There is a disadvantage with splintering of terms, particularly in the case of literature searches, because relevant references may be missed. Also, as these methods have become commercialized, general names have been replaced by the names of marketed products.

Figure 37.4 Comparison of trends for usage for “elasticity imaging” versus “elastography”. The curves suggest a transition from using “elasticity imaging” to using “elastography”.
Analysis of the underlying fine structure of the “ultrasound elastography” histogram allows one to see the dynamics of relative contributions of various modalities. For example, we found a steady decline of the publications on “static elastography”. We found out that the area of the fastest growth of ultrasonic elastography is related to the modalities based on the use of shear waves, as see in Figures 37.5 and 37.6. Before 2010, shear wave techniques contributed less than a quarter of ultrasound elastography publications; in 2015 they contribute more than 70%.
Figure 37.5 Comparison of publications on “ultrasound elastography” and “shear waves”. The shear wave‐based modalities have the steepest rise among other modalities of ultrasound elastography.

Figure 37.6 Comparison of publications on shear waves and ARF. Strong correlation between dynamics of publications on shear waves and on ARF.
There are several advantages of using shear waves as opposed to compression‐based strain elastography. First, the shear wave speed can be evaluated locally and can be used for calculating the absolute values of the shear modulus. Also, to obtain these quantitative values of the shear modulus it is not necessary to know the stress distribution as it is in strain elastography. Acoustic radiation force excitations typically generate shear waves with a broad frequency range which can be exploited for viscoelastic material characterization through analyzing shear wave velocity dispersion [13, 23–25]. The shear wave frequency can be modulated based on the application to obtain proper levels of propagation in order to estimate the shear wave speed with confidence. Amplitude modulation can also be used to generate ARF with specific frequency content [4, 5, 26–28]. Lastly, shear waves can be used not only to evaluate the isotropic, elastic material properties, but also the anisotropic and viscoelastic properties of tissues.
Most shear wave‐based modalities use the acoustic radiation force of focused ultrasound and the fraction of the ARF‐related modes of ultrasound elasticity imaging is constantly increasing. Therefore there is a strong correlation between the histograms of the “shear wave” and “acoustic radiation force”, as illustrated in Figure 37.6. Although the biomedical applications of ARF are very diverse (they include targeted drug and gene delivery, manipulating of cells in suspension, acoustical tweezers, etc.), the widest new area of its applications is elasticity imaging and ARF‐based methods are the largest part of the ultrasound elastography techniques. ARF currently demonstrates the steepest increase the publications histograms (see Figure 37.6).
ARF is one of the most important physical phenomena in ultrasound elastography and there are several more unexplored aspects of ARF which might further increase its role in ultrasound elastography. Among those three will be considered here:
- the presence of a push‐pull ARF
- nonlinear enhancement of ARF
- design of radiation force beams for shear wave elastography.
37.3 Future Investigations of Acoustic Radiation Force for Elastography
37.3.1 Nondissipative Acoustic Radiation Force
In most of the ARF‐based imaging modalities, the ARF is dependent on an absorbing or attenuating tissue. The simplified equation for the ARF, F, is given as
where α is the ultrasound attenuation coefficient, I is the ultrasound intensity, and c is the longitudinal wave speed in the medium. However, ARF can be generated in media without attenuation or acoustic wave reflection. Gradients of acoustic properties of a medium, such as variations of sound velocity, cause gradients of the energy density in the propagating acoustic wave. As a result, radiation force is generated [29, 30]. Displacement produced by non‐dissipative radiation force in inhomogeneous media can be in both directions (outward and inward toward the transducer).
Non‐dissipative radiation force can be used to generate a differential force or pressure on an object. Figure 37.7 schematically illustrates the difference in the ARF effect on an inclusion in the tissue with the upper drawing corresponding to a solid tumor and in the bottom drawing corresponding to a liquid‐filled cyst. We assume that the arrows represent an acoustic beam traveling through the inclusion, the solid lines represent the unperturbed shape, and the dashed lines represent the shape of the inclusion after the ARF stimulation.

Figure 37.7 Comparison of deformation on a solid tumor (top) and cyst (bottom) due to an ARF beam applied to the inclusion. The arrow represents an acoustic beam traveling through the inclusion, the solid lines represent the unperturbed shape, and the dashed lines represent the shape of the inclusion after the ARF stimulation.
Beyer showed the net pressure at the interface of two media is related to the difference in longitudinal wave speeds in a medium and the corresponding gradient of the energy density of an acoustic beam [30]

where E is the energy density of the acoustic beam, c 1 and c 2 are the longitudinal wave speeds in mediums 1 and 2, respectively, and m is the reflection coefficient defined as
and ρ 1 and ρ 2 are the mass densities in mediums 1 and 2. So in the case that the surrounding tissue has ρ 1 = 1000 kg/m3 and c 1 = 1540 m/s and the tumor has ρ 2 = 1035 kg/m3 and c 2 = 1573 m/s then P net = +0.0225E and then on the other side going from tumor to normal tissue, the subscripts 1 and 2 are exchanged and P net = –0.0199E [31]. In the second case, the surrounding tissue is used as defined above and the cyst has ρ 2 = 1000 kg/m3 and c 2 = 1500 m/s, then P net = −0.0263E and then on the other side P net = +0.0263E. The change in the signs of the force at the edges generates a squeezing or stretching of the inclusion. Investigations would have to be performed to evaluate the magnitude of these deformations to be used as metrics for diagnosis. It should be noted that non‐dissipative force, in contrast to the dissipative radiation force, can be generated in tissue at low sub‐megahertz frequencies despite the low attenuation coefficient of the media.
37.3.2 Nonlinear Enhancement of Acoustic Radiation Force
To improve the induced motion using ARF for various applications, it is desired to use any method to enhance the intensity of an acoustic beam to generate more ARF. Properly accounting for the ultrasonic properties of tissue, the nonlinear effects can enhance the amplitude and localization of the radiation force in the focal region. Focusing a transducer generates a harmonic wave which steepens due to nonlinearity and then, due to diffraction, transforms into a short impulse. Along the acoustic path, the content of higher frequencies in the emitted harmonic wave gradually increases, which results in an increased attenuation of the acoustic wave and a corresponding increase of the radiation force. This effect is most pronounced close to the focal area of the beam.
Figure 37.8 shows the relative power and radiation force for a focused beam from the linear case and nonlinear cases where N is the ratio of the focal length of the transducer and the nonlinear shock length.
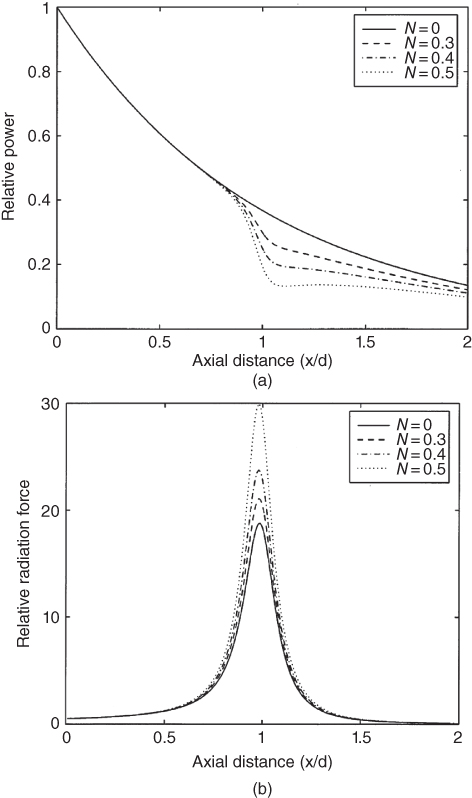
Figure 37.8 Nonlinear enhancements of the radiation force contrasted with a linear consideration. The ultrasound field characteristics (a) power and (b) radiation force are plotted as functions of axial distance for linear (N = 0) and nonlinear (N = 0.3, 0.4, and 0.5) regimes. Source: reprinted from [11], copyright 1998, with permission from Elsevier.
If the shock length is constant, then the focal length could be adjusted to use the nonlinear enhancement advantageously to increase the radiation force. The amplitude and phase shift for each harmonic can be chosen so that the nonlinearity, diffraction, and dissipation will transform the initial wave into a shock wave near the focal region, as depicted in Figure 37.9. In addition, only linear and therefore not significant, losses will take place along the pre‐focal distance, and the maximum transfer of ultrasonic energy into radiation force will occur at the focus.
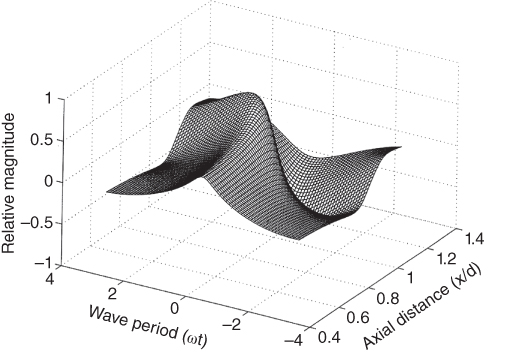
Figure 37.9 Transformation of the waveform for a focused ultrasonic field. Source: reprinted from [11], copyright 1998, with permission from Elsevier.
37.3.3 Spatial Modulation of Acoustic Radiation Force Push Beams
For ARF‐based elastography applications it is necessary to produce a strong shear wave because the shear waves attenuate in very short distances. As a result there has been significant work to use different focusing or beamforming strategies to optimize the force delivered. Conventional electronic focusing techniques have been used for many methods [3, 11]. Bercoff et al. proposed focusing at several different depths in a fast, successive fashion to create a strong shear wave through constructive interference in the supersonic shear imaging method [12]. Vibro‐acoustography used linear array transducers with different sub‐apertures to focus beams at different ultrasound frequencies to generate an oscillatory force [32, 33].
McAleavey et al. used unique apodization schemes to generate ARF push beams to generate shear waves with known spatial frequencies for estimation of the shear wave velocity in a medium [16]. Unfocused push beams were introduced by Zhao et al. to create shear waves near to the transducer [34]. Another advantageous aspect of this approach was to generate a shear wave with a large depth‐of‐field (DOF). Radiation force‐based crawling waves were generated with traditional focusing and axicon focusing [35]. Additional work was performed to combine traditional and axicon focusing in a hybrid fashion to make beams with a large DOF [36].
Unfocused beams and focused beams were used in subsequent implementations of a method called comb‐push ultrasound shear elastography (CUSE), which uses the simultaneous production of many shear waves and then uses directional filtering and correlation‐based techniques to measure shear wave velocity [14, 37]. Steered unfocused beams were also used to generate a collection of high density ARF push beams [38].
The spatial distribution of ARF push beams can be optimized based on the application. There are numerous ways to generate strong displacements with these methods for the purposes of perturbing soft tissues.
37.4 Conclusions
This chapter provides a unique analysis of the publication history in the field of elastography. It paints a picture that shows an incredible impact due to clinical acceptance. Shear wave‐based applications are growing and a majority of those applications are using methods based on acoustic radiation force. We provide a few ideas for investigation to optimize and use acoustic radiation force for future elastographic applications. The field of elastography has grown from a few research laboratories into a very useful imaging modality that is making clinical impact in a number of different areas of study.
Acknowledgments
This work was supported by grant R01DK092255 from the National Institute of Diabetes and Digestive and Kidney Diseases (NIDDK) and grant R21AR065024 from the National Institute of Arthritis and Musculoskeletal and Skin Diseases (NIAMS) and National Institutes of Health (NIH). The content is solely the responsibility of the authors and does not necessarily represent the official views of the NIDDK, NIAMS, and NIH.
References
- 1 Sarvazyan, A., Hall, T.J., Urban, M.W., et al. (2011). Elasticity imaging – an emerging branch of medical imaging. An overview. Curr. Med. Imaging Rev. 7: 255–282.
- 2 Ophir, J., Cespedes, I., Ponnekanti, H., et al. (1991). Elastography: a quantitative method for imaging the elasticity of biological tissues. Ultrason. Imaging 13: 111–134.
- 3 Nightingale, K.R., Palmeri, M.L., Nightingale, R.W., and Trahey, G.E. (2001). On the feasibility of remote palpation using acoustic radiation force. J. Acoust. Soc. Am. 110: 625–634.
- 4 Konofagou, E.E. and Hynynen, K. (2003). Localized harmonic motion imaging: theory, simulations and experiments. Ultrasound Med. Biol. 29: 1405–1413.
- 5 Fatemi, M. and Greenleaf, J.F. (1998). Ultrasound‐stimulated vibro‐acoustic spectrography. Science 280: 82–85.
- 6 Pernot, M., Fujikura, K., Fung‐Kee‐Fung, S.D., and Konofagou, E.E. (2007). ECG‐gated, mechanical and electromechanical wave imaging of cardiovascular tissues in vivo. Ultrasound Med. Biol. 33: 1075–1085.
- 7 Kanai, H. (2005). Propagation of spontaneously actuated pulsive vibration in human heart wall and in vivo viscoelasticity estimation. IEEE Trans. Ultrason., Ferroelectr., Freq . Control 52: 1931–1942.
- 8 Sandrin, L., Fourquet, B., Hasquenoph, J.M., et al. (2003). Transient elastography: a new noninvasive method for assessment of hepatic fibrosis. Ultrasound Med. Biol. 29: 1705–1713.
- 9 Lerner, R.M., Parker, K.J., Holen, J., et al. (1988). Sono‐elasticity: Medical elasticity images derived from ultrasound signals in mechanically vibrated targets. In: Acoustical Imaging, vol. 16, 317–327. New York: Plenum Press.
- 10 Hoyt, K., Parker, K.J., and Rubens, D.J. (2007). Real‐time shear velocity imaging using sonoelastographic techniques. Ultrasound Med. Biol. 33: 1086–1097.
- 11 Sarvazyan, A.P., Rudenko, O.V., Swanson, S.D., et al. (1998). Shear wave elasticity imaging: a new ultrasonic technology of medical diagnostics. Ultrasound Med. Biol. 24: 1419–1435.
- 12 Bercoff, J., Tanter, M., and Fink, M. (2004). Supersonic shear imaging: a new technique for soft tissue elasticity mapping. IEEE Trans. Ultrason., Ferroelectr., Freq . Control 51: 396–409.
- 13 Chen, S., Urban, M.W., Pislaru, C., et al. (2009). Shearwave dispersion ultrasound vibrometry (SDUV) for measuring tissue elasticity and viscosity. IEEE Trans. Ultrason., Ferroelectr., Freq . Control 56: 55–62.
- 14 Song, P., Zhao, H., Manduca, A., et al. (2012). Comb‐push ultrasound shear elastography (CUSE): a novel method for two‐dimensional shear elasticity imaging of soft tissues. IEEE Trans. Med. Imaging 31: 1821–1832.
- 15 Zhao, H., Song, P., Meixner, D.D., et al. (2014). External vibration multi‐directional ultrasound shearwave elastography (EVMUSE): application in liver fibrosis staging. IEEE Trans. Med. Imaging 33: 2140–2148.
- 16 McAleavey, S.A., Menon, M., and Orszulak, J. (2007). Shear‐modulus estimation by application of spatially‐modulated impulsive acoustic radiation force. Ultrason. Imaging 29: 87–104.
- 17 Catheline, S., Souchon, R., Rupin, M., et al. (2013). Tomography from diffuse waves: Passive shear wave imaging using low frame rate scanners. Appl. Phys. Lett. 103: 014101–014105.
- 18 Sridhar, M. and Insana, M.F. (2007). Ultrasonic measurements of breast viscoelasticity. Med. Phys. 34: 4757–4767.
- 19 Amador, C., Urban, M.W., Chen, S., and Greenleaf, J.F. (2012). Loss tangent and complex modulus estimated by acoustic radiation force creep and shear wave dispersion. Phys. Med. Biol. 57: 1263–1282.
- 20 Mauldin, F.W., Haider. M.A., Loboa, E.G., et al. (2008). Monitored steady‐state excitation and recovery (MSSER) radiation force imaging using viscoelastic models. IEEE Trans. Ultrason., Ferroelectr., Freq . Control 55: 1597–1610.
- 21 Muthupillai, R., Lomas, D.J., Rossman, P.J., et al. (1995). Magnetic resonance elastography by direct visualization of propagating acoustic strain waves. Science 269: 1854–1857.
- 22 Sarvazyan, A. and Egorov, V. (2011). Mechanical imaging – a technology for 3‐D visualization and characterization of soft tissue abnormalities. A review.. Curr. Med. Imaging Rev . 8: 64–73.
- 23 Urban, M.W., Chen, S., and Fatemi, M. (2012). A review of shearwave dispersion ultrasound vibrometry (SDUV) and its applications. Curr. Med. Imaging Rev. 8: 27–36.
- 24 Deffieux, T., Montaldo, G., Tanter, M., and Fink, M. (2009). Shear wave spectroscopy for in vivo quantification of human soft tissues visco‐elasticity. IEEE Trans. Med. Imaging 28: 313–322.
- 25 Nightingale, K.R., Rouze, N.C., Rosenzweig, S.J., et al. (2015). Derivation and analysis of viscoelastic properties in human liver: impact of frequency on fibrosis and steatosis staging. IEEE Trans. Ultrason., Ferroelectr., Freq . Control 62: 165–175.
- 26 Urban, M.W., Silva, G.T., Fatemi, M., and Greenleaf, J.F. (2006). Multifrequency vibro‐acoustography. IEEE Trans. Med. Imaging 25: 1284–1295.
- 27 Urban, M.W., Fatemi, M., and Greenleaf, J.F. (2010). Modulation of ultrasound to produce multifrequency radiation force. J. Acoust. Soc. Am. 127: 1228–1238.
- 28 Zheng, Y., Yao, A., Chen, S., et al. (2013). Ultrasound vibrometry using orthogonal‐frequency‐based vibration pulses. IEEE Trans. Ultrason., Ferroelectr., Freq . Control 60: 2359–2370.
- 29 Ostrovsky, L., Sutin, A., Il'inskii, Y., et al. (2007). Radiation force and shear motions in inhomogeneous media. J. Acoust. Soc. Am. 121: 1324–1331.
- 30 Beyer, R.T. (1997). Nonlinear Acoustics. Woodbury, NY: Acoustical Society of America.
- 31 Duck, F.A. (1990). Physical Properties of Tissue. London: Academic Press.
- 32 Silva, G.T., Greenleaf, J.F., and Fatemi, M. (2004). Linear arrays for vibro‐acoustography: a numerical simulation study. Ultrason. Imaging 26: 1–17.
- 33 Urban, M.W., Chalek, C., Kinnick, R.R., et al. (2011). Implementation of vibro‐acoustography on a clinical ultrasound system. IEEE Trans. Ultrason., Ferrorelect., Freq . Control 58: 1169–1181.
- 34 Zhao, H., Song, P., Urban, M.W., et al. (2012). Shear wave speed measurement using an unfocused ultrasound beam. Ultrasound Med. Biol. 38: 1646–1655.
- 35 Hoyt, K., Hah, Z., Hazard, C., and Parker, K.J. (2012). Experimental validation of acoustic radiation force induced shear wave interference patterns. Phys. Med. Biol. 57: 21.
- 36 Nabavizadeh, A., Greenleaf, J.F., Fatemi, M., and Urban, M.W. (2014). Optimized shear wave generation using hybrid beamforming methods. Ultrasound Med. Biol. 40: 188–199.
- 37 Song, P., Urban, M.W., Manduca, A., et al. (2013). Comb‐push ultrasound shear elastography (CUSE) with various ultrasound push beams. IEEE Trans. Med. Imaging 32: 1435–1447.
- 38 Nabavizadeh, A., Song, P., Chen, S.,et al. (2015). Multi‐source and multi‐directional shear wave generation with intersecting steered ultrasound push beams. IEEE Trans. Ultrason., Ferroelectr., Freq . Control 62: 647–662.