
THE DEBUG MENU
The Debug menu contains commands that help you debug a program. These commands help you run the program in the debugger, move through the code, set and clear breakpoints, and generally follow the code’s execution to see what it’s doing and hopefully what it’s doing wrong.
Effectively using these debugging tools can make finding problems in the code much easier, so you should spend some time learning how to use them. They can mean the difference between finding a tricky error in minutes, hours, or days.
The commands visible in the Debug window change depending on several conditions, such as the type of file you have open, whether the program is running, the line of code that contains the cursor, and whether that line contains a breakpoint. The following list briefly describes the most important menu items available while execution is stopped at a line of code that contains a breakpoint:
- Windows — This submenu’s commands display other debugging-related windows. This submenu is described in more detail in the following section, “The Debug ⇒ Windows Submenu.”
- Continue — This command resumes program execution. The program runs until it finishes, it reaches another breakpoint, it encounters an error, or you stop it.
- Break All — This command stops execution of all programs running within the debugger. This may include more than one program if you are debugging more than one application at the same time. This can be useful, for example, if two programs work closely together.
- Stop Debugging — This command halts the program’s execution and ends its debugging session. The program stops immediately, so it does not get a chance to execute any cleanup code that it may contain.
- Step Into — This command makes the debugger execute the current line of code. If that code invokes a function, subroutine, or some other procedure, the point of execution moves into that procedure. It is not always obvious whether a line of code invokes a procedure. For example, a line of code that sets an object’s property may be simply setting a value or it may be invoking a property procedure.
- Step Over — This command makes the debugger execute the current line of code. If that code invokes a function, subroutine, or some other procedure, the debugger calls that routine but does not step into it, so you don’t need to step through its code. However, if a breakpoint is set inside that routine, execution will stop at the breakpoint.
- Step Out — This command makes the debugger run until it leaves the routine it is currently executing. Execution pauses when the program reaches the line of code that called this routine.
- QuickWatch — This command displays a dialog box that gives information about the selected code object.
- Exceptions — This command displays the dialog box shown in Figure 6-1. When you select a Thrown check box, the debugger stops whenever the selected type of error occurs. If you select a User-unhandled check box, the debugger stops when the selected type of error occurs and the program does not catch it with error-handling code.
FIGURE 6-1: The Exceptions dialog box lets you determine how Visual Basic handles uncaught exceptions.
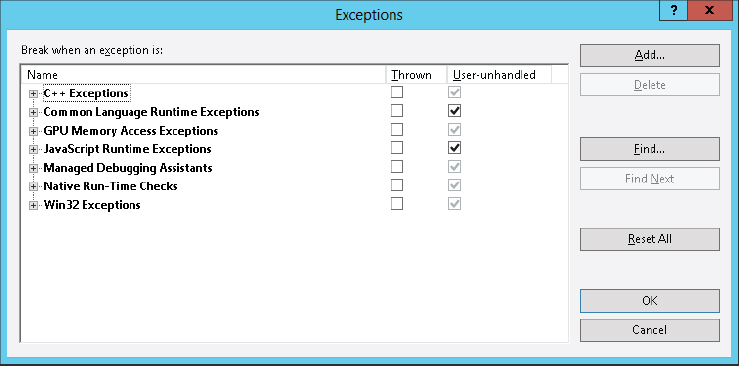 For example, suppose that your code calls a subroutine that causes a divide-by-zero exception. Use the dialog box to select Common Language Runtime Exceptions ⇒ System ⇒ System.DivideByZeroException (use the Find button to find it quickly). When you select the Thrown check box, the debugger stops in the subroutine when the divide-by-zero exception occurs, even if the code is protected by an error handler. When you select the User-unhandled check box, the debugger stops only if no error handler is active when the error occurs.
 - Toggle Breakpoint — This command toggles whether the current code line contains a breakpoint. When execution reaches a line with an active breakpoint, execution pauses so you can examine the code and program variables. You can also toggle a line’s breakpoint by clicking the margin to the left of the line in the code editor or by placing the cursor in the line of code and pressing F9.
- New Breakpoint — This submenu contains the Break At Function command. This command displays a dialog box that lets you specify a function where the program should break.
- Delete All Breakpoints — This command removes all breakpoints from the entire solution.
- Disable All Breakpoints — This command disables all breakpoints but leaves them in the solution so you can re-enable them later if you want.
- Enable All Breakpoints — This command enables all disabled breakpoints.