
Microsoft has produced one of the most advanced integrated development environments (IDE) that easily rivals all competition. Indeed, IDEs on other platforms are often compared to Visual Studio for their depth of features, refinement of tools, and breadth of languages supported.
The feature set in Visual Studio is so vast in fact that it would require a book several times the size of the one you’re holding to cover the basics of every feature. Moreover, each language supported (over 7 and counting) would require its own book of similar size. Clearly, mastering all of the features of Visual Studio would require a dedication that few would endure outside of a vocation or research requirement.
Fortunately, most IoT hobbyists and enthusiasts never need to learn every nuance of Visual Studio to develop IoT applications. As you will see, you need only to learn a few of the features, including writing the code, building (compiling), deploying, and debugging.1 Do not let the sheer size of the features in Visual Studio intimidate you. You’re likely to find mastery of the basics is all that you’ll ever need. Should you ever need to use the advanced features, you can always learn them when you need them. I find it nice to know that there are advanced tools that can help me develop solutions more easily.
In this chapter, you’ll see a demonstration of how to get started using Visual Studio 2015. You will also learn the layout of the GPIO headers for the three compatible boards and even see how to build, deploy, and test your first Windows 10 IoT Core application. Let’s begin with a look at the GPIO headers from all three boards.
Working with GPIO Headers
The general-purpose input/output (GPIO) headers permit you to connect hardware, such as electronic circuits, devices, and more, to your board, which you then access via special libraries from your applications. However, you must know what pins are available and what features they support. As you will see, not all pins can be programmed in the same way.
Once you’ve identified the pins you want to use, you can use those pin numbers or nomenclature to write the code that you need to set up and access the pin and read (or write) to the pin. That is, you can turn pins on or off (applying power or no power), read analog values, write analog values, and more. This allows you to work with both analog and digital sensors. You will discover more about sensors in Chapter 7.
Caution
Whenever you want to connect sensors or circuits to the GPIO header—either directly (not recommended) or via a breakout board (recommended)—you should first shut down your board. This may sound inconvenient when you’re working through a project, but it is the best method for ensuring that you do not accidentally short some pins or make the wrong connections.
It is common to use the word “pins” when talking about the header, but you should refrain from use “GPIO pins” when referring to the header itself. As you will see, the pins in the header may be mapped to one of several interfaces (also called a bus) and the GPIO is just one type of interface available. Although you can use the interface pins in your code, the pins that you use to connect to devices (save those that use one of the supported interfaces) are named GPIO pins. However, the physical pin numbering and order may differ among the various boards.
Furthermore, when you use one of the pins in your Visual Studio application, you specify the GPIO number. For example, GPIO 13 on the Raspberry Pi is physically pin number 33. The Visual Studio libraries are designed to use the pin nomenclature rather than the header pin number. Thus, when you refer to GPIO 13, you use 13 as shown in the following code snippet.
const int LED_PIN = 13; // GPIO13auto gpio = GpioController::GetDefault();...pin_ = gpio->OpenPin(LED_PIN);pin_->Write(pinValue_);pin_->SetDriveMode(GpioPinDriveMode::Output);
I discuss each of the three boards supported by Windows 10 IoT Core in the following sections. As you will see, each board has a different GPIO header layout, including some very important power differences.
Raspberry Pi
The GPIO headers on the Raspberry Pi 2 and 3 have the same layout. The header is located in the upper left and consists of a double row of 20 pins, making a 40-pin header. They are numbered sequentially in pairs starting with the leftmost set of pins.
Figure 4-1 shows the Raspberry Pi next to the header layout. I have oriented the photo to make it easier to see the GPIO pins. Pin 1 is the leftmost pin at the left side of the header (top side shown in the photo). Notice that the GPIO named pins are arranged in a non-sequential pattern.
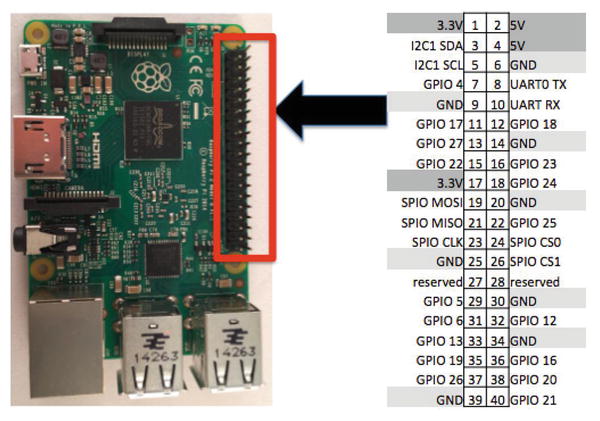
Figure 4-1. GPIO header (Raspberry Pi 2 and 3)
The Raspberry Pi GPIO header supports a number of interfaces including an I2C bus, SPIO bus, and Serial UART with pins devoted accordingly. You can see these in Figure 4-1. You also see two reserved pins (consider them unusable), eight ground pins, two 3.3V power and two 5V power pins. This leaves a total of 17 pins that you can use in your applications.
You must take care when using the GPIO pins for reading voltage. On the Raspberry Pi, all pins are limited to 3.3V. Attempting to send more than 3.3V will likely damage your Raspberry Pi. Always test your circuit for maximum voltage before connecting to your Raspberry Pi. You should also limit current to no more than 5mA.
MinnowBoard Turbot
The GPIO headers on the MinnowBoard Max–compatible boards (I use the Turbot in this section) is located on the bottom-left side of the board. The GPIO consists of a double row of 13 pins making a 26-pin header. They are physically numbered sequentially in pairs starting with the left-post pin.
Figure 4-2 shows the MinnowBoard Turbot next to the header layout. Pin 1 is the leftmost pin at the left side of the header (top side shown in the photo). I have oriented the photo to make it easier to see the GPIO pins. Notice that the GPIO named pins are arranged in a sequential pattern unlike the Raspberry Pi. That is, the GPIO pins are grouped together.

Figure 4-2. GPIO header (MinnowBoard Turbot)
The MinnowBoard Turbot GPIO header supports a number of interfaces including an I2C bus, SPIO bus, and Serial UART with pins devoted accordingly. You can see these in the Figure 4-2. You also see two ground pins, one 3.3V power, and one 5V power pin. This leaves a total of 10 pins that you can use in your applications.
DragonBoard 410C
The GPIO headers on the DragonBoard 410C are located on the top-left side of the board. The GPIO consists of a double row of 20 pins making a 40-pin header. They are physically numbered sequentially in pairs starting with the left-post pin. Unlike the Raspberry Pi and MinnowBoard Max–compatible boards, the DragonBoard 410C uses female header pins.
Figure 4-3 shows the DragonBoard 410C next to the header layout. Pin 1 is the leftmost pin at the left side of the header (top side shown in the photo). I have oriented the photo to make it easier to see the GPIO pins. The GPIO named pins are arranged in a non-sequential pattern like the Raspberry Pi.
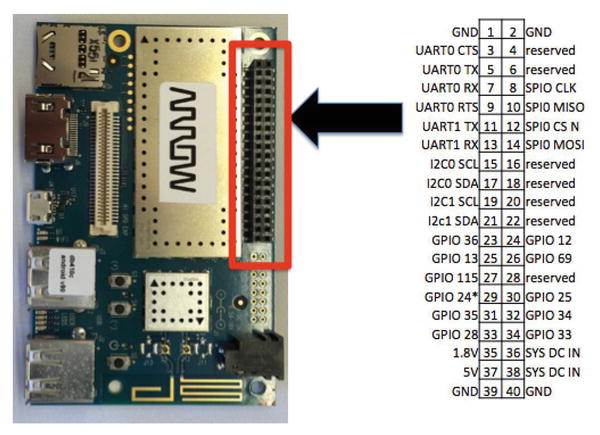
Figure 4-3. GPIO header (DragonBoard 410C)
The DragonBoard 410C GPIO header supports a number of interfaces including an I2C bus, SPIO bus, and two serial UART with pins devoted accordingly. You can see these in Figure 4-3. You also see four ground pins, one 1.8V power, and one 5V power pin. This leaves a total of 11 pins that you can use in your applications. GPIO 24 can be used for input only. Also, the pins marked SYS DC in can be used to power the board.
Now that you know more about the GPIO headers on your boards, you can learn how to get started using Visual Studio 2015.
Visual Studio 2015 Primer
The Visual Studio product line is very long lived. In fact, it has been around since the early days of Windows. As you can imagine, the product has undergone a great deal of changes—with new languages, frameworks, platforms, and more added every few years. As I mentioned earlier, Visual Studio 2015 offers a huge array of features for developing applications for Windows using a variety of languages. Visual Studio also supports several platforms.2
With all of these features and the many languages, it can be quite intimidating getting started with Visual Studio. In fact, books devoted to Visual Studio (just the features, not languages) can easily exceed hundreds of pages in length. However, you can accomplish quite a lot with a small amount of knowledge.
Tip
If you want to know more about Visual Studio 2015, check out Professional Visual Studio 2015 by Bruce Johnson (Wrox, 2015). The book contains over 1,000 pages of detailed explanations about every feature of Visual Studio.
This section gives you a brief introduction to how to get around in Visual Studio for the purposes of developing applications for Windows 10 IoT Core. Don’t feel like you have to learn everything about Visual Studio to enjoy working with Windows 10 IoT Core. This section and the next chapters provide you a guide to getting started writing Windows 10 IoT Core applications by example. But first, let’s explore the major features, interface features, and project templates that you will use to write your Windows 10 IoT Core applications.
Note
The following provides a high-level overview of the features that you need to know to write Windows 10 IoT Core applications. As such, it is not a complete tutorial of Visual Studio. If you need more information about Visual Studio, refer to the help system inside the application and the Microsoft Developer Network (MSDN) library of documentation.
Major Features
Visual Studio 2015 is truly the do everything tool for Windows software development. In that respect, Microsoft has established the bar for which all others are measured. Visual Studio is an IDE that places all the tools that you need to develop applications in one interface, making Visual Studio the only tool that you need to develop applications for Windows.
Another aspect to its superiority has to do with the languages supported. For example, there are a variety of programming languages, including C, C#, C++, Visual Basic, Python, and more. Each of these languages can be used to build a host of different applications in one of several frameworks.
Note
Most of the examples for building Windows 10 IoT Core applications are written in either C#, C++, or Python. Once you master these languages and mechanisms for building projects, learning to do the same in other languages requires only learning the syntax and semantic nuances of the language.
For example, you can build desktop applications (GUI or command line) in several frameworks, including Windows 32 and .NET, create web applications, dynamic libraries for reuse, and more. Of course, you can also build applications for Windows 10 as a Universal Windows Platform or one of several special project templates (prebuilt collections of files and specific settings).3 Project templates create a special file called a solution (with a filename of <project_name>.sln) that contains several types of files.
To create an application, you select a project template and name the solution, write your code, compile the application into an executable, test and debug the application (optional), and finally, deploy the application.
I guide you through selecting the right project template later in this section. Writing the source code (developing the functionality) requires modifying one or more of the files in the solution. I discuss the major types of Windows 10 IoT Core projects later in this section.
The compilation step is easy to initiate but can be an iterative process. This is because the compiler performs intensive syntax and semantic checks on the code flagging anything that isn’t quite up to the language or framework rules as warnings or errors. Fortunately, you can click each warning or error to zoom to the line of code. But don’t worry; compiler errors are normal and are not a sign of inexperience or lack of knowledge—they’re just a part of the learning experience. That said, as you learn the language and frameworks, you should encounter fewer issues and errors. Also, do not disregard warnings. While they may not prohibit your code from compiling, it is always a good practice to remove the cause of the warning before completing your solution.
I think it is the interactive debugger where Visual Studio shines the most. In fact, I find the interactive debugger the most useful of all features in Visual Studio. Not only can you run your applications stepping through code one line at a time, you can do so while inspecting variables, memory, the stack (the order of method calls), and more. This helps you test your application and improve quality while finding logic or data errors. You can even remotely debug your Windows 10 IoT Core applications.
Finally, when you are satisfied with the quality of your code, you can use Visual Studio to deploy your application to your Windows 10 IoT device .
The Interface
At first glance, the Visual Studio 2015 interface appears with several smaller windows arranged inside a larger window. The layout of the windows can change depending on settings you used when installing Visual Studio and can vary slightly from one project template to another. Figure 4-4 shows the layout of the IDE using C++ environment settings. I have placed numbers next to the major components of the IDE. I explain each in more detail.
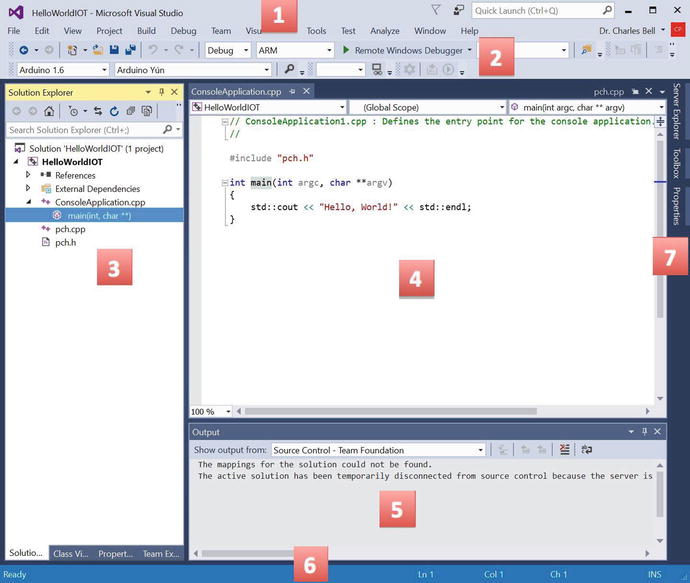
Figure 4-4. The Visual Studio 2015 interface (C++ settings)
The IDE components shown include the following.
Menus: This area contains the system of menus for all the standard features. The features are categorized into several areas, including operations on the project, building, debugging, and more.
Toolbars: In this area you see a variety of toolbars that have buttons and other controls for commonly used functions for particular features. In this image, you see toolbars for debugging and Arduino. You can add and remove (show and hide) using the Tools menu.
Solution Explorer: This window lists the various files included in the solution. You can double-click any of the files to open the appropriate window to work with that file. You can also use the tree control to drill down into the specifics for each file type. For example, I opened the ConsoleApplication.cpp node and double-clicked the main() method, which opened the code editor window and zoomed (placed the cursor) to the method .
Code Editor: This window is where you enter all the code for your source code. You can use this area to edit all manner of files and the IDE will change its behavior based on context. That is, it performs operations such as language-specific automatic code completion.
Output Window: This window is used to communicate messages to you from the compiler and other features. For example, look here when you compile your application for warnings and errors.
Information Bar: The bar down at the bottom of the IDE is also used to provide contextual information. Since the focus of the IDE is on the source code editor, data such as cursor location (position on line), code line number, and more, is shown.
Dock: To the right (in this layout) are additional windows that are docked or minimized. You can click any of the tabs to open the windows.
Windows
The windows in the IDE can be repositioned and resized. There are a number of states each window can become, including the following. When you expand a window by clicking the window title bar to expand the window, you see three small icons on each window title bar. The first one, a small down arrow, when clicked, opens a context menu with options for the disposition of the window. I describe how the other two icons are used in the descriptions of window states.
Float: The window is free to be moved around and floats above (outside) the confines of the IDE. This is also called unpinning.
Dock: The window is restricted to the confines of the IDE but can be repositioned inside the IDE itself. The window remains the size you set. Click the thumbtack (or pin) icon to dock the window. This is also called pinning. You can move the window around in the IDE, and when it hovers near a docking area, an overlay allows you to dock the window in that area. Much like the side-by-side feature of Windows.
Dock as Tabbed Document: The window is reduced to a tab on the tab bar associated with its function. There are multiple tab areas throughout the IDE.
Auto Hide: The window opens when you hover over its tab. The window stays open as long as the mouse pointer is within its borders. When you move the mouse away from the window, it reverts to a tab on the tab bar. To auto hide, click the small thumbtack (sometimes called the pin).
Hide: The window closes and is removed from the tab bar. You have to use the menu options to reopen it. Click the X icon to hide the window .
Environment Settings
Recall that during the installation of Visual Studio in Chapter 2, you chose the C++ option for the environment settings. This is another great feature of Visual Studio. Environment settings configure the layout of the IDE for a specific language or framework. There are generic (general) environment settings for language-agnostic layout as well as environment settings for languages such as C# and C++. Figure 4-5 shows the environment settings that are available.

Figure 4-5. Visual Studio 2015 environment settings
You can change the environment settings any time you want. Use the Tools ➤ Import and Export Settings... menu to open the settings management dialog. You can use this dialog to save the settings (export) or restore settings you’ve saved (import) by selecting the appropriate radio button.
To change the default environment settings, choose the Reset all settings radio button and then click Next. The dialog gives you another chance to save your settings. If you do not want to save them, or once you have saved the settings, choose the No radio button and then click Next. On the next screen, choose the environment settings (see Figure 4-5) that you want and then click Finish.
Common Menu Items
While there are a number of menus in the interface, each with dozens of subitems and submenus, there are a few that you use quite often. The following is a brief overview of the commonly used menu items categorized by the entries on the main menu bar. I add the keyboard shortcut in parenthesis where available. Note that <project> changes to the name of the currently opened or selected project.
File: File and project operations
New ➤ Project (Ctrl+Shift+N): Start a new project
Save Selected Items (Ctrl+S): Save the file(s) selected
Save All (Ctrl+Shift+S): Save all files
Project: Operations on the current project
<project> Properties (Alt+F7): Open the properties dialog for the project
Build: Compilation and deployment with two sections: one for the entire solution, and one for the current project (a solution can have multiple projects)
Build Solution (F7): Build (compile) all projects in the solution
Rebuild Solution (Ctrl+Alt+F7): Rebuild (compile) all files in the solution
Deploy Solution: Deploy the compiled solution to the destination specified in the debug settings
Clean Solution: Remove all compiled files and headers and generated files in the solution
Build <project>: Build (compile) the currently selected project
Rebuild <project>: Rebuild (compile) all files in the project
Deploy Selection: Deploy the compiled project to the destination specified in the debug settings
Clean <project>: Remove all compiled files and headers and generated files in the project
Compile (Ctrl+F7): Compile the currently selected file/project
Debug: Interactive debugger
Start Debugging (F5): Start the interactive debugger
Start Without Debugging (Ctrl+F5): Run the project without the debugger (adds a pause at the end of execution for console applications)
Step Into (F11): While debugging, enter any method calls one line at a time
Step Over (F10): While debugging, execute current line (do not step into methods)
Toggle Breakpoint (F9): Turn a breakpoint on/off
Now that you know a bit more about the interface, let’s look at the templates you will use for your Windows 10 IoT Core projects.
Windows 10 IoT Core Project Templates
A project template is a special set of files and settings that are configured for a specific language, framework, or application target. Project templates are arranged by programming language and by project type. The following are some of the more common project types available in the standard Visual Studio installation.
Windows: A very broad category that covers any application type for Windows
Web: Applications built using ASP.NET
Office/SharePoint: Applications for add-ins for the Microsoft productivity tools
Android: Builds C# applications for Android devices
iOS: Builds C# applications for some iOS devices
Cloud: Builds applications for Windows Azure
Windows IoT Core: Builds applications for deployment to Windows 10 IoT Core devices
Note
Some project template categories are only available for certain languages. Similarly, some languages may list fewer project template categories.
See the Visual Studio online documentation for a complete list of project types available. Check the online help for more information about the project types from the following resources .
Microsoft Developer Network (MSDN) ( https://msdn.microsoft.com/library/dd831853%28v=vs.140%29.aspx )
Visual Studio Getting Started ( https://www.visualstudio.com/get-started/get-started-vs )
To start a new project, click the File ➤ New ➤ Project... menu item. The New Project dialog is displayed, as shown in Figure 4-6.
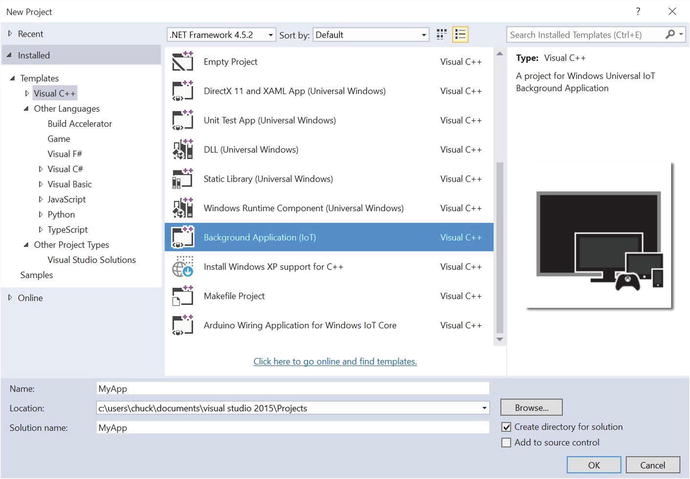
Figure 4-6. Selecting a Visual Studio project template
You can see the programming languages installed in the tree view on the left. You can use this view to drill down to the specific language and framework/platform you want. If you click the language itself, you see all the project templates for that language. You can see this in Figure 4-6.
Once you select the project template you want, you can name the project in the area at the bottom, including placing the project and all of its files in a specific location. By default, the name of the application and the solution name are the same but you can change them. Once you are ready to create the project, click OK. The IDE opens the project (a project’s settings are saved in a file called a solution) and creates the basic source files for you.
Tip
You may see a Windows for IoT category once you have installed the Arduino feature. This is only for projects that work with the Arduino. It is not the same as the Windows IoT Core project template category.
There are three basic project templates that you use in this book to create applications for Windows 10 IoT Core. They aren’t the only ones you can use, but they are the templates you should use to get started. If you want to build more complicated applications, you may want to consider some of the other project types. The three project templates include the following ordered by complexity. I explain each in the following sections.
Blank Windows IoT Core Console Application
Background Application (IoT)
Blank App (Universal Windows)
Again, there are other project templates that you may want to use, but these three are the ones that you use in this book.
Blank Windows IoT Core Console Application
This project template is the most basic and simplistic of all project templates for Windows 10 IoT Core. It permits you to create a simple text-only console application. If you want to experiment with writing applications or want to create a solution that provides data or produces a report for a headed device, choose this project template. You will use this template in the walkthrough of building your first application.
The code for this project template is very simple. The template creates a source file named ConsoleApplication.cpp, which you can use to write your application. Use this source file to write your application. You can create additional source files if you want, need, or desire to do so. For example, if you are modeling concepts or creating abstractions for hardware, you may want to add additional source files to contain these models (e.g., classes).
Listing 4-1 shows this file. The project template fills in the main() function with a simple, Hello, World! print statement. You can find this project template under the Windows ➤ Windows IoT Core category.
Listing 4-1. Blank Windows IoT Core Console Application
// ConsoleApplication1.cpp : Defines the entry point for the console application.//#include "pch.h"int main(int argc, char **argv){std::cout << "Hello, World!" << std::endl;}
Background Application (IoT)
This project template is used to create an application that runs in the background (or headless) on your device. Typically, you’d use this project template to create an application that communicates to other devices, interacts with hardware (and then communicates with other devices), or drives hardware to display or report sensor data to the user.
The project files for this project template are quite different and there are a few extra files. The one source file that you work with most is named StartupTask.cpp, which is where you place the code you want to run when the application starts. There is also a corresponding header file named StartupTask.h where you can place function and class primitives for your design.
Listing 4-2 shows the StartupTask.cpp file as created by the new project dialog. You can find this project template under the Windows ➤ Windows IoT Core category.
Listing 4-2. Background Application (IoT)
#include "pch.h"#include "StartupTask.h"using namespace BackgroundApplication6;using namespace Platform;using namespace Windows::ApplicationModel::Background;// The Background Application template is documented at http://go.microsoft.com/fwlink/?LinkID=533884&clcid=0x409void StartupTask::Run(IBackgroundTaskInstance^ taskInstance){//// TODO: Insert code to perform background work//// If you start any asynchronous methods here, prevent the task// from closing prematurely by using BackgroundTaskDeferral as// described in http://aka.ms/backgroundtaskdeferral//}
There is a link in the code for more information about the project template. Also, there are hints in the code comments (designated by //) to help you get started.
Blank App (Universal Windows)
This project template is the most sophisticated of the three project templates that you will use. This project template allows you to create simple user interfaces using Microsoft’s Extensible Application Markup Language (XAML) . XAML is similar to XML except you use a special declarative language to create a user interface. It is a very expressive and powerful language that permits you to create sophisticated user interfaces without the need for high overhead graphical libraries.
Tip
To learn more about XAML, see https://msdn.microsoft.com/en-us/windows/uwp/xaml-platform/xaml-overview?f=255&MSPPError=-2147217396 .
There are several files for this project template. The main files that you will be working with are the XAML files (MainPage.xaml, MainPage.xaml.h, and MainPage.xaml.cpp), which include the XAML code. You also see files named App.xaml, App.xaml.h, and App.xaml.cpp, which are the entry or starting point for the application. There is no specific XAML code here; rather, it contains the code for the OnLaunched and OnSuspending events. You can use these events to initialize your application or cleanup when it is shut down or suspended. There are a number of other files, but these are explored in later chapters when you see examples of each project template.
Listing 4-3 shows the main page for the XAML source files. You can find this project template under the Windows ➤ Universal category.
Listing 4-3. Blank App (Universal Windows)
//// MainPage.xaml.cpp// Implementation of the MainPage class.//#include "pch.h"#include "MainPage.xaml.h"using namespace App8;using namespace Platform;using namespace Windows::Foundation;using namespace Windows::Foundation::Collections;using namespace Windows::UI::Xaml;using namespace Windows::UI::Xaml::Controls;using namespace Windows::UI::Xaml::Controls::Primitives;using namespace Windows::UI::Xaml::Data;using namespace Windows::UI::Xaml::Input;using namespace Windows::UI::Xaml::Media;using namespace Windows::UI::Xaml::Navigation;MainPage::MainPage(){InitializeComponent();}
Now that you’ve had a brief overview of Visual Studio, let’s see these features in action by writing your very first Windows 10 IoT Core application .
Example Project: Hello, World
Now let’s get our hands into some code and see how to write a basic application for your Windows 10 IoT Core device. I know you’ve been itching to get started, so grab a stockpile of your favorite diet crushing snacks, kid-approved beverages of choice, recline your chair4 and let’s write some code!
The project is an adaptation of a classic computer science homework assignment: converting temperature from Celsius to Fahrenheit. But you’re going to mix it up a bit and make the application a bit more interactive. That is, you ask the user which scale she wants to use as the base temperature, prompt for the temperature, and finally, convert and print the result.
In case you’ve forgotten or perhaps never gave it another thought after the mid-term and final exam, the formulas that you use include converting Celsius to Fahrenheit and Fahrenheit to Celsius as follows. You use these in the code that you write for the application.
Celsius = (5/9) X (fahrenheit - 32)Fahrenheit = ((9/5) X Celsius) + 32.0
To keep things as simple as possible, you’ll write a Windows IoT Core console application that you can deploy to your Windows 10 device and run from a remote login (SSH). This keeps the code simple and allows you to focus on the mechanics of building and deploying the application.
Note
In this example and in future projects I use the Raspberry Pi as my Windows 10 IoT Device (or simply device) and often use those terms interchangeably. You can perform all of these steps with the other boards. The only difference in the steps that follow concerns the architecture selection. For Raspberry Pi and DragonBoard 410C, choose ARM, for the MinnowBoard Max–compatible boards, choose x86 in the Solutions Platform drop-down box. That is the only difference.
Now that you know what you want to build, let’s get started!
Create the Project
You need to create a new project in Visual Studio to contain your code. If you’re following along, go ahead and launch Visual Studio and create a new project. You can use the File ➤ New ➤ Project... menu option or you can click the New Project... link in the welcome dialog or press Ctrl+Shift+N. Figure 4-7 shows the location of the link. I highlighted it so you can find it easier.

Figure 4-7. Visual Studio: Create new project
When the new project dialog appears, you need to select the language, platform, and project type. For this project, you want to choose Visual C++ as the language, Windows as the platform, and Windows IoT Core as the framework (category) in the tree view on the left. Then, choose the Blank Windows IoT Core Console Application entry from the list, as shown in Figure 4-8.
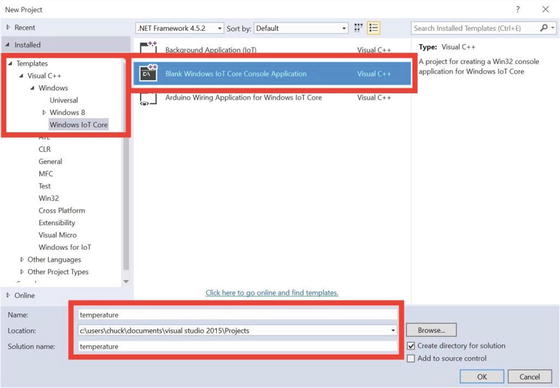
Figure 4-8. New Project dialog
At the bottom of the dialog you can choose the name of the application (temperature) and optionally a directory of where to store the solution (all the source code and related files). If you type temperature in the Name box, the dialog will fill in the same name for the solution name. Once you are satisfied with the name and location, click OK to create the project. You may also be asked for the target and minimum platform versions. You should choose the latest version of each. Once you click OK, the project creation process may take a moment to run. Once complete, you see the blank files for the solution, as shown in Figure 4-9.

Figure 4-9. Blank console application project
Write the Code
Now it is time to write the code! In this project, you place all the source code in the main(int, char**) method inside the ConsoleApplication.cpp source file. To open this file (if it is not already open in the code editor), select the project in the Solution Explorer and navigate to the ConsoleApplication.cpp file. Then, open that branch and double-click the main(int, char**) method. Visual Studio opens and refocuses the code editor window to the method, as shown in Figure 4-9.
Did you notice something interesting in the source code? Yep, Microsoft has populated the main(int, char**) method with the ubiquitous “Hello, World” code. In this case, it is statement that sends the character string to the standard out (std::cout) or console. Thus, if you were to run this code without modification, the application will simply print that string and exit. You want to do something similar since you are only working with the console, but with a bit more sophistication than that simple output statement.
Don’t worry too much about whether you’ve written C++ code before. I provide all the statements that you need in this chapter. I present a brief tutorial of the C++ language in the next chapter. For now, just enter the code as shown in Listing 4-4. I’ll walk you through what the code does in a moment.
Listing 4-4. Temperature Example Code
//// Windows 10 for the IoT//// Example C++ console application to demonstrate how to build// Windows 10 IoT Core applications.//// Created by Dr. Charles Bell//#include "pch.h"using namespace std;int main(int argc, char **argv){double fahrenheit = 0.0;double celsius = 0.0;double temperature = -.0;char scale{ 'c' };cout << "Welcome to the temperature conversion application. ";cout << "Please choose a starting scale (F) or (C): ";cin >> scale;if ((scale == 'c') || (scale == 'C')) {cout << "Converting value from Celsius to Fahrenheit. ";cout << "Please enter a temperature: ";cin >> celsius;fahrenheit = ((9.0 / 5.0) * celsius) + 32.0;cout << celsius << " degrees Celsius = " << fahrenheit <<" degrees Fahrenheit. ";}else if ((scale == 'f') || (scale == 'F')) {cout << "Converting value from Fahrenheit to Celsius. ";cout << "Please enter a temperature: ";cin >> fahrenheit;celsius = (5.0 / 9.0) * (fahrenheit - 32.0);cout << fahrenheit << " degrees Fahrenheit = " << celsius <<" degrees Celsius. ";}else {cout << " ERROR: I'm sorry, I don't understand '" << scale << "'.";return -1;}}
The code begins with a number of comment lines. These are designated with the // symbol at the start of the line. In fact, you can place the // anywhere on the line making everything to the right a comment. The compiler ignores these statements so you can write whatever you like. The very first thing that you may notice is the following line of code. This is part of the preamble of the code. The first line is an include directive that tells the compiler to include the pch.h (precompiled header file), which Visual Studio supplies.
#include "pch.h"Next is a shorthand notation I like to use. It allows you to avoid typing the namespace over and over again. In this case, you’re using the namespace std:: a lot. The following line of code permits you to omit that—provided that what you are referencing (cout, cin) can be found unambiguously in the namespace. That is, if there were multiple namespaces used, cout and cin would have to be unique to one of them otherwise, you’d still have to provide the namespace std::.
using namespace std;Those two lines are the only code outside of the main() method. The main() method is the entry point for a C++ application. When the application is run, code inside this method is executed first. The code you want for this method is shown in Listing 4-1.
You begin by asking the user what scale she wants to use. You prompt the user to enter a C for Celsius or an F for Fahrenheit. Take a look at the code again. If the user specifies either a C or c, you calculate the conversion using Celsius as the base. If the user specifies either an F or f, you calculate the conversion using Fahrenheit as the base. If something else was entered, you exit with an error. You include additional prompts to ask the user for the base temperature. Following that, you use the formulas to perform the calculations.
You may be wondering what all of those cout and cin and << and >> thingys do. Essentially, the cout << string phrase tells the compiler you want to take a string and print it to the screen (standard out or stdout). The cin >> variable phrase tells the compiler to read information entered by the user and store it in the variable named. Go through the code again and read it until you understand how this works. Again, I explain C++ coding in more detail in the next chapter.
Once you’ve entered all the code, go ahead and save the project using either the save on the toolbar or the File ➤ Save Solution menu item. Next, let’s build and test the code!
Build and Test Your Code
To build the code, you first must choose build type and the architecture. Figure 4-10 shows where these options are on the toolbar. Go ahead and choose Debug as the build type and x86 or x64 as the architecture to match your PC. You choose x86 or x64 here because you will first build and test the application on your PC before deploying it to the Raspberry Pi. This shows the true power of UWP—the ability to run the same code on different architectures.
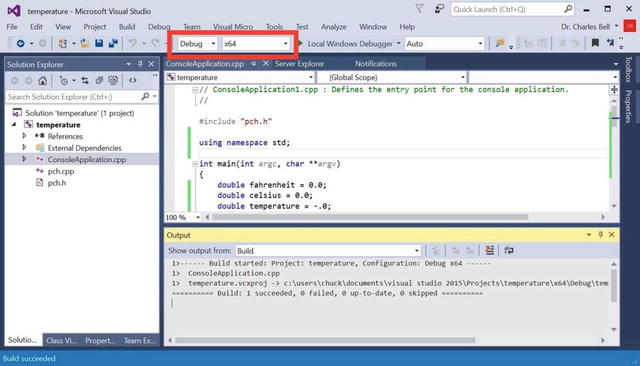
Figure 4-10. Build and test your code
Once selected, press Ctrl+Shift+B or choose Build ➤ Build Solution from the menu. This compiles your application and opens the Output window to show you the results of the build. As you can see in Figure 4-10, the solution built without errors. If you encounter errors, check the code against Listing 4-4 and correct any lines that do not compile.
To test the application, you can simply run it with the debugger (but without any breakpoints) by pressing Ctrl+F5 or choosing Debug ➤ Start without Debugging. This opens a console and runs the application on your PC, and waits to close the console. Note that if you changed your code since the last build, you may be asked to rebuild the solution/project. If you choose the F5 option, the console would close when the application terminates. Figure 4-11 shows what the application should look like.

Figure 4-11. Testing the temperature application
You see what you expected: the application prompts you for some information and depending on your selection, converts the temperature entered. Go ahead and run the application several times until the joy has passed or you are convinced it is working correctly. When you’re done, congratulate yourself on having written your first Windows 10 application! You are now ready to set up your Windows 10 IoT Device and deploy the application.
Set up your Windows 10 IoT Device
You’re ready to power on your device and get it ready for deployment. All you need to do is set up the device as described in Chapter 2 and power it on.
Cool Gadget: Micro-USB to USB Adapter
If you’re like me and have very few micro-USB cables and most of those devoted to specific devices, chances are that you have to borrow a cable to get your Raspberry Pi powered up. Rather than buying a whole new cable, you can buy a brilliant little adapter that lets you convert your normal USB type A cable to a micro-USB cable. The adapter (known by a variety of names) fits inside the male end of a USB cable converting it to a micro-USB plug. The following shows this adapter.

You can find it on most online auction sites. Just search for micro-USB adapter and you should find it among the more normal adapters. I like this adapter because it is small and removes the need for yet another cable to junk up my store of USB cables.
Once powered on, take note of the IP address. You need this to deploy your application in the next step.
Deploy and Test to your Windows 10 IoT Device
This is the step that most people have issues, especially when deploying a Windows IoT Core application for the first-time. This is mostly due to the fact that you must configure the project settings correctly or else the deployment will fail. Once you know what to change (and it isn’t so obvious), deployment is really easy.
The first thing you should understand is the build configuration. You can choose to build an application for debugging (debug) or for releasing (release). Remember that you also need to choose the architecture. If you are working with the Raspberry Pi or DragonBoard 410C, you choose ARM; otherwise, you choose x86 for the MinnowBoard Max–compatible boards.
However, the project properties for these combinations of build and architecture are different! Thus, setting the values for debug won’t change those for release and so on. This is perhaps the most difficult thing to remember. But do not despair, I will demonstrate the settings you need for both a debug and release build.
In fact, I will demonstrate one of the most powerful features of Visual Studio: the interactive debugger. But not just that, I’ll also demonstrate how to debug your application running on your Windows 10 IoT device directly from your PC. How cool is that?
Using the Interactive Debugger
The interactive debugger allows you to step through your code one line at a time, view the state of variables, see the stack, and much more. You must set the build type to debug in order to use debugging .
The key concepts involved are the use of breakpoints or places in the code where you want the debugger to stop at when executing. You can set breakpoints on most lines of code. To do so, click in the leftmost portion of the code editor next to the line you want a breakpoint. You can also position the cursor on the line and press F9 to set (turn on) the breakpoint. A small red circle appears, which indicates that a breakpoint has been set. To clear a breakpoint, just click the red circle again or position the cursor on the line and press F9. Figure 4-12 shows the code editor window with a breakpoint set on the first print statement.
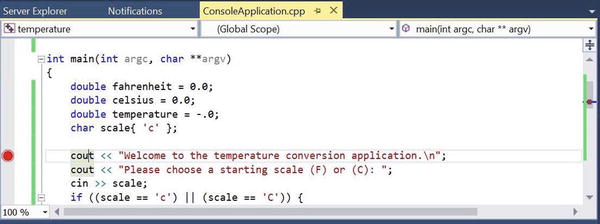
Figure 4-12. Interactive debugger: setting breakpoints in the code editor
To start the debugging session, press F5 or choose the Debug ➤ Start Debugger menu. This causes the application to start a new console window so that you can interact with the application. The debugger stops on the first line of code (where the breakpoint is set). You can then step through the code one line at a time by pressing F10 or by choosing the Debug ➤ Step Into menu.
When the debugger is running, several new windows open, including diagnostic tools that show memory and CPU usage, a tabbed window that allows you to watch variables (and more), and another tabbed window that allows you to see the call stack, breakpoints, and more. Figure 4-13 shows an excerpt of running the debugger with our sample project.
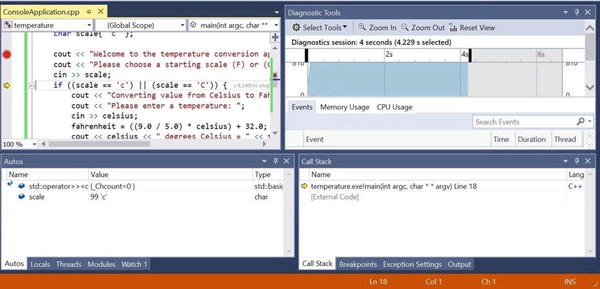
Figure 4-13. Interactive debugger: inspection
Go ahead and step through the application. Take some time to tour the various windows. Pay attention to the watch window and note how the variables change values. Clearly, there is far more that you can do with debugging Windows applications than what I have described here. Indeed, I consider the interactive debugger the most important feature of Visual Studio: one that requires some time and experience using to be able to fully utilize it. However, what I’ve shown here is the bare essentials for getting started.
Tip
To learn more about the interactive debugger, see https://msdn.microsoft.com/en-us/library/dn986851.aspx .
It is also possible to remotely debug an application running on your Windows 10 IoT device. I will demonstrate how to do this in a later chapter. Remote debugging allows you to run the application on the Windows 10 IoT device and monitor its progress with the interactive debugger on your PC. Due to the nature of console applications, if you were to try remote debugging this project, you would not get far. This is because the application prompts the user for input and there is no way to connect to the application to interact with it. Thus, remote debugging is best used for cases where you want to see how the code works on the device—checking variables, logic, and so forth, much like the interactive debugger.
Deploying a Debug Build
Now you’re ready to deploy the application to your Raspberry Pi and start using it. In this section, I describe how to set up your project for deploying a debug build. Let’s begin with the setting the project properties. Be sure to choose the build type (Debug) and platform (ARM) before opening the project properties .
Open the project properties by right-clicking the project and choose Properties. You see a dialog open that has a host of settings you can change. You want the debugging section. Click that label to open the debug settings panel. Figure 4-14 shows the completed dialog.
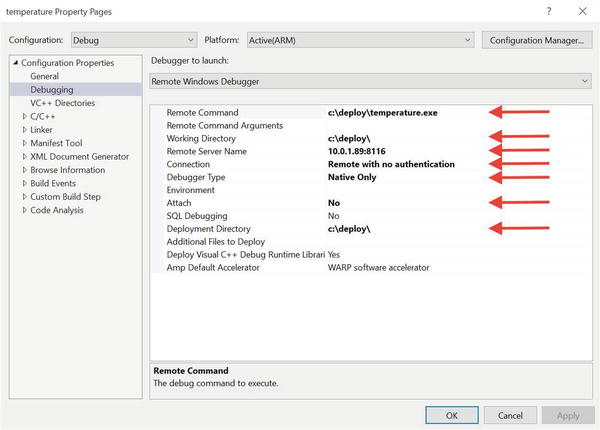
Figure 4-14. Project properties (debug builds)
The current configuration is at the top of the dialog. Make sure that everything corresponds to the debug build and ARM platform. There are seven settings you must change. I describe each next.
Remote Command: Set this to the path and executable of your application. Use the working directory set below.
Working Directory: Enter a working directory to deploy your application. The directory is created for you. Remember to add the trailing slash or else you may get a warning when you deploy the application.
Remote Server Name: Set this to the IP address or hostname of your device along with port 8116 with .8116. For example, my Raspberry Pi was on 10.0.1.89 so I entered 10.0.1.89:8116. This is the most commonly misunderstood setting .
Connection: Set this to Remote with no authentication.
Debugger Type: Choose Native Only. You only want to deploy the native ARM application.
Attach: Choose No. For a debug build deployment, you do not want to attach to the process once deployed.
Deployment Directory: Set this to be the same as the working directory. You can choose a different directory, but if you do, make sure that the remote command reflects the difference in path.
Once these settings are entered, click Apply and then close the dialog. You are almost ready to deploy. But first, you must ensure that the remote debugger on the Raspberry Pi is turned on. Use your browser to browse to your device at port 8080 (e.g., 10.0.1.89:8080) or use the Device Portal from the Windows IoT Core dashboard. Click the Debug label and then click the Start button at the top of the page. This starts the remote debugger and readies the device for deployment. Figure 4-15 shows the result of start in the device portal. Note the port that the pop-up dialog presents. This is where you got the value for the debug settings.
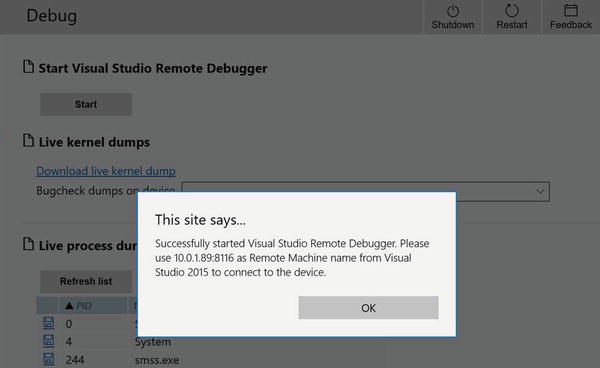
Figure 4-15. Starting the Remote Debugger: Device Portal
Now return to Visual Studio and choose Build ➤ Deploy temperature from the menu or click the Remote Debugger button on the toolbar. This initiates a build (if needed) and deploys the application to the Raspberry Pi. Once the deployment is complete, you see a message the output window.
Note
The remote debugger is no longer installed by default in the 10586 release of Windows 10 IoT Core. This is because the deployment of the remote debugger was added in Visual Studio 2015 Update 1. If you try to deploy your debug build to your device and you get a message about MSVSMON.EXE missing or you get an error in the Device Portal when you try to start the remote debugger, you can try deploying a blank C# application to your device. This should install the remote debugger and allow you to deploy your application without errors. You can also try closing the MSVSMON.EXE application on your device. Sometimes the debugger can hang resulting in errors when deploying. Shutting down the remote debugger and restarting it can help solve deployment issues.
To test your application, use PuTTY to open a SSH session to log into your device. Once connected, you can change into the directory that you specified in the project properties. Figure 4-16 shows an example deployment. Notice the files that are deployed. Among those is the temperature.exe file, which you can use to run the application .

Figure 4-16. Checking the debug deployment
Now go ahead and run the application by entering temperature.exe. You can now interact with the application as I did in Figure 4-17.
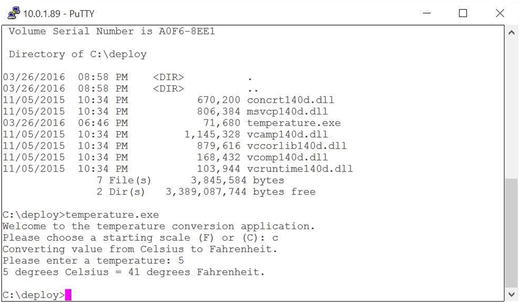
Figure 4-17. Testing the application
That’s it! You’ve just deployed your first Windows 10 IoT Core application to your device and ran it. Very nice.
Tip
If you encountered problems during deployment, be sure the project settings are correct and that the build type and platform are set correctly. You can access the configuration management dialog to check these.
Deploying a Release Build
Deploying a release build is very similar to deploying a debug build. That is, you must set the project properties correctly. This may seem a bit strange, but you will use the same dialog that you did for deploying the debug build but with slightly different settings.
Like the debug build, you must set the build type to release and the platform to ARM. Then open the project properties and set the values, as shown in Figure 4-18.

Figure 4-18. Project properties (release builds)
There are six settings that need to be set as described next. If this is your first time visiting the dialog after setting the project settings for the debug build, you may notice the values are back to the defaults. This is because each build type has its own settings and you must set them for each build you want to work with .
Remote Command: Set this to the path and executable of your application. Use the working directory set below.
Working Directory: Enter a working directory to deploy your application. The directory is created for you. Remember to add the trailing slash or else you may get a warning when you deploy the application.
Remote Server Name: Set this to the IP address or hostname of your device along with port 8116 with :8116. For example, my Raspberry Pi was on 10.0.1.89, so I entered 10.0.1.89:8116. This is the most commonly misunderstood setting. Even though this is a release build, you still use the remote debugger to do the deployment.
Connection: Set this to Remote with no authentication.
Debugger Type: Choose Native Only. You only want to deploy the native ARM application. “Native” means that the code is compiled for the ARM platform; it does not include managed code.
Deployment Directory: Set this to be the same as the working directory. You can choose a different directory but if you do make sure that the remote command reflects the difference in path.
I set the deployment directory to deploy_rel so that I can tell the difference. Once you’ve completed the settings, apply them, and close the dialog. Then, choose the Build ➤ Deploy temperature to deploy the application. You can check the deployment once it is complete. Figure 4-19 shows the results of deploying the release build to the Raspberry Pi.

Figure 4-19. Checking the release deployment
If you have followed along and succeeded in deploying both the debug and release builds, you’re ready to learn more about the power and level of sophistication available for writing IoT solutions with Windows 10.
Summary
Developing applications for Windows 10 IoT Core requires the use of Visual Studio and the choice of several programming languages. Visual Studio is loaded with advanced features that meet the needs of even the most serious developers for the most complex solutions.
Fortunately for you, you do not need to master every nuance of the IDE. Indeed, you need only learn the most basics of getting around in the IDE, including starting new projects, coding, compiling, testing and debugging, and deploying your applications to your Windows 10 IoT Core devices.
In this chapter, you explored the Visual Studio 2015 interface, which included learning how the windows are laid out in the IDE and the sample project templates used in this book to write applications for your Windows 10 IoT Core devices. You learned the basic features that you will use for most of the book’s projects. You also had a detailed overview of a basic Windows 10 IoT Core application using C++.
In the next chapter, you’ll take a closer look at developing Windows 10 IoT Core applications by using C++. I present a short tutorial on the major language constructs and walk you through an application that blinks an LED.
Footnotes
1 Much like most people will never need or use more than 20% of the features of Microsoft Word.
2 There’s even support for Android if you’re into that kind of thing.
3 Project templates are quite extensive and specific to a particular language, framework, and platforms. Indeed, you will find project templates are organized in that order.
4 A common pose that is very bad for your posture but some insist it exudes the proper attitude of a serious coder. Recline at your own risk.